

Abstract
The purpose of this study was to investigate whether CFS patients without comorbid psychiatric diagnoses differ from CFS patients with comorbid psychiatric diagnoses and healthy control subjects in neuropsychological performance, the proportion with elevated spinal fluid protein or white cell counts, cerebral blood flow (CBF), brain ventricular lactate and cortical glutathione (GSH). The results of the study did not show any differences in any of the outcome measures between CFS patients with and without psychiatric comorbidity, thus indicating that psychiatric status may not be an exacerbating factor in CFS. Importantly, significant differences were found between the pooled samples of CFS compared to controls. These included lower GSH and CBF and higher ventricular lactate and rates of spinal fluid abnormalities in CFS patients compared to healthy controls. Thirteen of 26 patients had abnormal values on two or more of these 4 brain-related variables. These findings, which replicate the results of several of our prior studies, support the presence of a number of neurobiological and spinal fluid abnormalities in CFS. These results will lead to further investigation into objective biomarkers of the disorder to advance the understanding of CFS.
Chronic fatigue syndrome (CFS) is a debilitating multi-symptom disorder characterized by at least 6 months of fatigue severe enough to cause a substantial decrease in activities of daily living, and is usually accompanied by infectious, rheumatological and/or neuropsychiatric symptoms. Due to the lack of validated illness biomarkers, CFS is currently diagnosed based on a relatively broad clinical case definition. Consequently, the pool of patients included in clinical studies of the disorder is generally heterogeneous, which has quite likely impeded research progress.
In a series of studies stratifying CFS patient samples into those with or without comorbid Axis I psychiatric diagnosis, we have reported more brain related abnormalities in the group of patients without psychiatric comorbidity; these included poorer performance on neuropsychological testing1, more brain lesions on structural MRI2, greater decreases in cerebral blood flow3, a higher rate of either elevated protein or white cell count in spinal fluids4, and a tendency toward higher ventricular lactate [unpublished results]. In the present study, we aimed to confirm the presence of these clinical, biochemical, physiological and neuroimaging differences prospectively and at the same time point to determine if stratifying CFS patients on the basis of psychiatric comorbidity would be a useful strategy to minimize sample heterogeneity in future research studies.
METHODS
Subjects
Participants for this study, which was conducted from January 2012 through February 2015, consisted of 44 patients fulfilling the 1994 case definition for CFS5 and 17 healthy controls who did not exercise more than once a week – i.e., sedentary, used for study for two reasons: first to try to minimze the difference in deconditioning that is produced by inactivity and second because fit controls differ physiologically from non-fit controls (e.g., heart rates are lower and immune function is better). None of these subjects had any of the psychiatric exclusions noted in the 1994 case definition of CFS as determined by a telephone psychiatric diagnostic interview, the Structured Clinical Interview for DSM-IV6 [SCID]. All subjects provided informed written consent to participate in this study, which was approved by the Institutional Review Boards of Mount Sinai Beth Israel and Weill Cornell Medicine.
Criteria for Diagnosis of CFS
Subjects downloaded and completed a health screen form from the Center website [www.painandfatigue.com]. The screen form asked patients to rate on a 0 to 5 Likert Scale [1 mild; 2 moderate; 3 substantial; 4 severe; 5 very severe] the magnitude of reduction of activity produced by their fatigue in workplace, personal, social, and/or classroom. Then, subjects had to provide duration information regarding the 8 symptoms in the 1994 case definition5. To be counted, symptoms had to exist for at least 6 months. Next, subjects used the same 0 to 5 Likert scale to rate the burden that the 8 CFS symptoms had produced for them in the month prior to intake. To fulfill the paper diagnosis for CFS, subjects had to have ≥ 3 on activity reduction in at least one of the four life spheres and at least 4 of the 8 symptoms in the 1994 case definition5 rated as at least a 3 on the Likert scale. We have found that this screening method is approximately 95% accurate in identifying CFS. In addition, the screen form had an extensive list of possible medical causes of fatigue; the only acceptable medical diagnoses were hypertension or hypothyroidism with the patient reporting being under good medical control.
Intake Procedure
Subjects screening positive for CFS were brought into our Center for a medical history and physical. The above criteria for diagnosing CFS were repeated in this face to face interview, and every patient continued to fulfill these diagnostic criteria. Thirty six patients endorsed having at least a substantial problem [≥ 3 on the 0 to 5 Likert scale] with attention or concentration. In addition, the medical history asked about possible illnesses that could produce chronic fatigue; patients in this cohort had no such exclusions. Because centrally active medications [psychotropics, sleep or pain medicine other than NSIADs] could affect brain chemistry, subjects had to off any of these medications for at least 10 days prior to imaging. The following rule out blood tests were then performed on patients: CBC with sedimentation rate; metabolic panel; liver function tests; C reactive protein; TSH/free T4; ANA; Lyme titer with reflex to Western Blot if positive; ANA; Rheumatoid Factor. Elevations in sedimentation rate, C reactive protein and ANA titers up to 1:160 were allowed; the other labs were normal in this cohort. When permitted by the subject, lumbar puncture was then performed with fluid sent to the laboratory for white cell count, protein and lactate concentrations.
Psychiatric Assessments and Neuropsychological Testing
The presence of lifetime and current psychiatric diagnosis was assessed with the SCID6 administered by telephone. Current psychiatric diagnostic status was used to separate patients into two groups: CFS with current psychiatric diagnosis (CFS-P) and CFS without current psychiatric diagnosis (CFS-NP). All subjects underwent a battery of neuropsychological tests, which included the b Adult Reading Test, a measure used to estimate overall intellectual ability prior to illness onset7; the Gordon Vigilance and Distractibility Test, computer administered measures to evaluate sustained and focused attention as well as processing speed8; the WAIS IV Digit Span forward and backward, assessments of simple attention and working memory9; and the Rey-Osterrieth complex figure test, a measure of visuo-constructional ability and visual memory10. Additional mental and physical health and disability information was obtained using the Short Form Health Survey (SF-36)11, Profile of Mood States (POMS)12, Fatigue Severity Scale (FSS)13 and Center for Epidemiologic Studies Depression Scale (CES-D)14.
Neuroimaging scans
Some days after this intake process, proton magnetic resonance spectroscopy (1H MRS) was performed to measure ventricular lactate and glutathione and arterial spin labeling MRI to derive cerebral blood flow as fully described elsewhere15.
Statistical analysis
To determine the effect of psychiatric status, neuropsychological data were analyzed using a multivariate analysis of variance model (MANOVA) with a single factor for group (Controls vs. CFS-P vs. CFS-NP). Ventricular lactate, glutathione, and symptom and mood data (i.e., SF-36, POMS, FSS and CES-D) were analyzed with separate one-way analysis of variance (ANOVA) models. Regional cerebral blood flow in 39 a priori defined bilateral regions of interest was compared between groups using a repeated-measures ANOVA model with a single factor for group membership. Post-hoc comparisons of any significant F-test results were compared using Tukey’s HSD. Spinal fluid was considered abnormal if it revealed ≥ 5 cells per high power field on microscopy or > 60 mg/ml for protein; a difference in rates of abnormal spinal fluid was assessed with the Fisher exact test. The level of significance (α) for all analyses was 0.05.
In an attempt to replicate some of our previous findings and fully explore the data, we also conducted secondary analyses comparing the healthy controls and pooled CFS patients, i.e., without regard to their psychiatric comorbidity. The neuropsychological data were analyzed with a single factor (Controls vs. Patients) MANOVA, while data for ventricular lactate and glutathione were compared with separate one-way ANOVAs (α = 0.05). A series of independent t-tests were employed to compare rCBF in each of the regions of interest (α = 0.05). Given the number of comparisons planned for this analysis, we elected to employ the Holm-Bonferroni correction for multiple comparisons in order to reduce the likelihood of making a Type I error. The overall level of significance of the Holm-Bonferroni correction for the rCBF analyses was set to 0.05.
While these analyses provided data on overall group effects, they did not provide information on how often individual subjects had these abnormalities. To determine this, we did a count of extreme or outlier values for the four variables where we found consistent differences between CFS and healthy controls. To participate in this analysis, subjects had to have provided data for all four of these variables. Outlier values were defined as an abnormal cerebral spinal fluid measure, a ventricular lactate falling above the 90th percentile of that derived from healthy controls, a cortical glutathione falling below the 10th percentile, and a rCBF below the 10th percentile of that of healthy controls in at least two of the following three regions: frontal superior medial, frontal medial orbital, and rectus gyri. Each subject was categorized based on the number of extreme-value criteria they had met (0–4). A Fisher’s Test (2 × 5) was used to compare patients and controls and the distribution of each group relative to the extreme value categories.
RESULTS
Clinical Characteristics
One patient completed only the symptom and mood measures and did not take part in any other procedures. As a result, this individual was excluded from all analyses which then reduced the final sample to 60 individuals (CFS: 43, Controls: 17). Due to incomplete participation in all testing sessions, the final samples for the neuroimaging (CFS: 35, Controls: 17) and spinal fluid analyses (CFS: 35, Controls: 13) were further reduced. There were no significant differences in age, gender breakdown or body mass index between patients and controls (Table 1). In addition, those individuals not included in either the neuroimaging or spinal fluid analyses due to missing data did not significantly differ from their peers on any of the demographic, symptom, or mood variables.
Table 1.
Average and standard deviation for age, height, weight, and body mass index of the sample. Average duration of illness for patients is included. Proportion of female participants in each group and onset type for patients, gradual or sudden, are also noted.
| CFS-NP (n=27) | CFS Patients (n=43) CFS-P (n=16) |
Combined | Controls (n=17) | |
|---|---|---|---|---|
| Age (years) | 41.6 (±9.5) | 44.5 (±9.6) | 42.7 (±9.5) | 40.7 (±10.4) |
| Gender (% female) | 62.9 | 56.2 | 60.5 | 70.5 |
| Height (cm) | 172.4 (±11.5) | 174.1 (±8.1) | 173.0 (±10.3) | 170.5 (±8.8) |
| Weight (kg) | 76.0 (±16.6) | 78.0 (±15.7) | 76.7 (±16.1) | 74.6 (±13.3) |
| BMI (kg/m2) | 25.3 (±4.0) | 25.5 (±3.9) | 25.4 (±3.9) | 25.6 (±3.8) |
| Illness Duration (years) | 11.5 (±8.2) | 12.8 (±8.6) | 12.0 (±8.3) | – |
| Onset (% sudden) | 40.7 | 37.5 | 39.5 | – |
No significant differences between groups on any variable (p > 0.05). BMI = Body Mass Index, CFS = Chronic Fatigue Syndrome, CFS-NP = CFS patients without a current psychiatric diagnosis, CFS-P = CFS patients with a current psychiatric diagnosis.
Sixteen of the 43 CFS patients (37.2%) were found to have current psychiatric diagnoses consisting of major depressive disorder, depression not otherwise specified, general anxiety disorder, post traumatic stress disorder, anxiety not otherwise specified, or phobia. Seven patients had an anxiety disorder diagnosis; 8 a depressive disorder; and 1 patient had both anxiety and depressive disorders. None of the healthy controls had a current psychiatric diagnosis.
Premorbid intellectual function among the two CFS groups and the healthy controls did not differ significantly (118.6 ± 5.4, 117.8 ± 4.9 and 114.9 ± 7.8 for CFS-NP, CFS-P and controls, respectively, p > 0.1). Patients reported more fatigue, less energy and poorer health and mood (SF-36 in Table 2), than controls on the SF-36; in addition, patients showed limitations to emotional health, emotional well-being (SF-36), depression (CES-D), and total mood disturbance (POMS) with CFS-P scoring significantly worse than CFS-NP patients. There were no differences between controls and patients or between CFS-P and CFS-NP in any of the neuropsychological variables (p > 0.05). Means and standard deviations for the results of the neuropsychological test are included in Table 3.
Table 2.
Means and standard deviations of self-reported symptom and mood measure scores by group. One patient did not complete the mood and symptom measures reducing the CFS sample (n=43).
| CFS-NP (n=26) | CFS-P (n=16) | Controls (n=17) | |
|---|---|---|---|
| Phys. Functioning (SF-36) | a45.2 (±22.0) | a47.0 (±15.7) | 99.4 (±1.7) |
| Limits. due to Phys. Hlth. (SF-36) | a10.6 (±22.6) | a4.7 (±13.6) | 94.3 (±23.5) |
| Limits. due to Emo. Hlth. (SF-36) | 83.3 (±31.6) | ab37.5 (±45.3) | 94.1 (±17.6) |
| Energy/Fatigue (SF-36) | a17.3 (±14.8) | a10.6 (±13.0) | 70.5 (±25.9) |
| Emotional Well-Being (SF-36) | a75.2 (±17.3) | ab49.3 (±21.8) | 88.9 (±11.0) |
| Social Functioning (SF-36) | a30.3 (±20.6) | a26.6 (±17.6) | 92.1 (±23.5) |
| Bodily Pain (SF-36) | a44.6 (±22.5) | a46.3 (±26.6) | 96.2 (±7.8) |
| General Health (SF-36) | a32.5 (±18.4) | a28.1 (±17.7) | 85.5 (±23.2) |
| Depression (CES-D) | a15.0 (±8.6) | ab28.1 (±9.4) | 2.8 (±3.3) |
| Fatigue Severity (FSS) | a6.1 (±1.2) | a6.4 (±0.7) | 2.1 (±1.1) |
| Total Mood Disturbance (POMS) | a129.7 (±15.4) | ab146.1 (±15.2) | 94.2 (±9.5) |
Groups were compared using separate single-factor (Group) ANOVAs with a Tukey HSD as a post-hoc for any significant effect. CES-D = Center for Epidemiological Studies Depression Scale, CFS = Chronic Fatigue Syndrome, CFS-NP = CFS patients without a current psychiatric diagnosis, CFS-P = CFS patients with a current psychiatric diagnosis, Emo. = Emotional, FSS = Fatigue Severity Scale, Hlth. = Health, Limits. = Limitations, Phys. = Physical, POMS = Profile of Mood States, SF-36 = Short Form Health Survey.
Significantly different from Controls (p <0.05)
Significantly different from CFS-NP (p <0.05)
Table 3.
Means and standard deviations of neuropsychological tests by group.
| CFS-NP (n=27) | CFS Patients (n=43) CFS-P (n=16) |
Combined | Controls (n=17) | |
|---|---|---|---|---|
| NART: Verbal IQ | 118.22 (±6.05) | 116.71 (±5.66) | 117.64 (±5.88) | 113.94 (±8.96) |
| NART: Performance IQ | 114.57 (±2.89) | 113.99 (±2.65) | 114.35 (±2.78) | 112.43 (±4.23) |
| NART: Full Scale IQ | 118.83 (±5.36) | 117.76 (±4.92) | 118.42 (±5.16) | 114.86 (±7.85) |
| Gordon Vigilance | 29.38 (±0.90) | 28.44 (±2.85) | 29.02 (±1.92) | 28.59 (±3.52) |
| Gordon Distractibility | 26.19 (±5.38) | 21.75 (±11.45) | 24.50 (±8.39) | 26.24 (±6.45) |
| Digit Span: Forward | 12.30 (±2.27) | 11.88 (±2.13) | 12.14 (±2.20) | 10.94 (±2.25) |
| Digit Span: Backward | 9.63 (±2.72) | 8.69 (±2.50) | 9.28 (±2.65) | 8.65 (±2.71) |
| ROCF: Copy Task | 70.15 (±2.91) | 70.00 (±3.33) | 70.09 (±3.03) | 69.94 (±3.63) |
| ROCF: Immediate Recall | 46.19 (±13.59) | 45.56 (±15.14) | 45.95 (±14.01) | 43.94 (±16.87) |
| |ROCF: Delayed Recall | 46.67 (±12.20) | 42.13 (±14.56) | 44.98 (±13.15) | 43.82 (±17.01) |
Groups were compared using separate single-factor (Group) ANOVAs with a planned Tukey HSD as a post-hoc for any significant effect. There were, however, no significant differences (p > 0.05) between groups on task performance for any of the neuropsychological tests. IQ = Intelligence Quotient, ROCF = Rey-Osterrieth Complex Figure, NART = North American Adult Reading Test.
Spinal Fluid
Spinal fluid abnormalities were found in 9 of 35 patients (4 with elevated white cell counts, 4 with elevated protein concentrations, and 1 with both; Chi square = 4.11; p = 0.04) and in none of the 13 healthy controls. Presence or absence of psychiatric diagnosis did not affect results. There were no significant differences in peripherally obtained spinal fluid lactate levels among groups, and spinal fluid lactate did not correlate with ventricular lactate levels (r = 0.21, p = 0.17).
Neuroimaging
Pooled CFS patients, but not the CFS-P or CFS-NP separately, had significantly higher ventricular lactate and significantly lower occipital lobe glutathione than healthy controls (Figures 1 & 2). Cerebral blood flow, assessed in 39 regions bilaterally, was found to be significantly lower in CFS than in controls in only 3 regions: the frontal medial orbital, frontal superior medial and rectus gyri (Table 4); these CBF differences did not survive correction for multiple comparisons.
Figure 1.
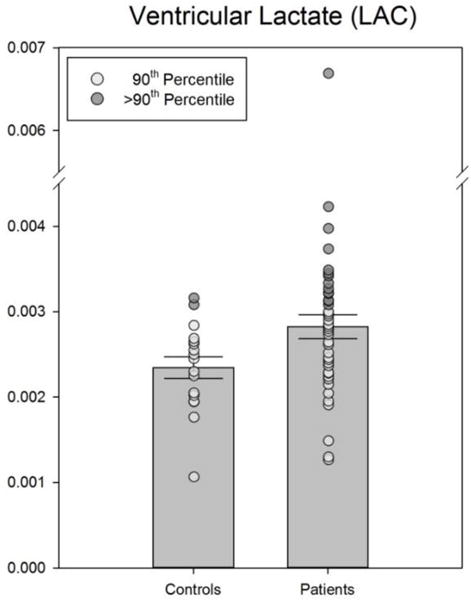
Actual data as well as means ± SEM of ventricular lactate values for controls and CFS. The difference between groups was significant (p < .05). Extreme values have been highlighted.
Figure 2.
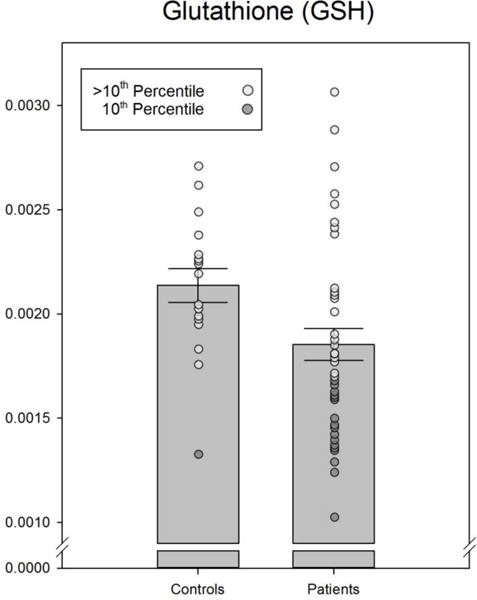
Actual data as well as means ± SEM of cortical glutathione values for controls and CFS. The difference between groups was significant (p < .05). Extreme values have been highlighted.
Table 4.
Regional cerebral blood flow, measured using arterial spin labeling during magnetic resonance imaging, in brain areas with significant differences between patients and controls.
| CFS-NP (n=22) | CFS Patients (n=35) CFS-P (n=13) |
Combined | Controls (n=17) | |
|---|---|---|---|---|
| Fr. med. orbital | 34.18 (±5.68) | 34.10 (±5.80) | a34.15 (±5.64) | 38.71 (±5.45) |
| 37.70 (±4.69) | 37.74 (±6.60) | a37.72 (±5.38) | 41.37 (±5.41) | |
|
| ||||
| Fr. superior (med.) | 36.62 (±5.11) | 37.88 (±6.14) | a35.13 (±5.96) | 40.62 (±5.97) |
| 27.74 (±4.45) | 26.97 (±5.49) | a37.08 (±5.46) | 29.73 (±4.89) | |
|
| ||||
| Rectus | a30.87 (±4.35) | a29.85 (±4.33) | a30.49 (±4.31) | 34.42 (±4.14) |
| a32.54 (±3.90) | a30.80 (±4.20) | a31.90 (±4.04) | 35.29 (±3.86) | |
Values are in ml/100 g/min and are listed laterally for each region (left above; right below). CFS = Central Fatigue Syndrome, CFS-NP = CFS patients without a current psychiatric diagnosis, CFS-P = CFS patients with a current psychiatric diagnosis, Fr. = Frontal, med. = medial.
Significantly different from Controls (p<0.05)
Outlier analysis
Table 5 shows the results of the outlier analysis. Only those participants providing data for all four of the criteria variables were included. As a result, the sample for the analysis was reduced to 39 participants, 26 CFS patients and 13 Controls. Of the 26 patients, 1, 3 and 9 individuals, respectively, had abnormalities in 4, 3 or 2 brain-related variables [i.e., brain-affected group] in contrast to none of the 13 controls. Fisher’s exact test was conducted on the data in the 2 × 5 matrix and found to be significant (p=0.011).
Table 5.
Frequency table for the outlier analysis. Patients and Controls were categorized based on four criteria: abnormal CSF, below the 10th percentile for GSH, above the 90th percentile for LAC, and below the 10th percentile for rCBF in at least 2 of 3 defined regions (i.e., frontal medial orbital, frontal superior medial and rectus gyrus).
| Number of Criteria met | Patients (n = 26) | Controls (n= 13) | Total |
|---|---|---|---|
| 4 | 1 | 0 | 1 |
| 3 | 3 | 0 | 3 |
| 2 | 9 | 0 | 9 |
| 1 | 7 | 4 | 11 |
| 0 | 6 | 9 | 15 |
Fisher’s exact test (2 × 5 matrix) was significant (p=0.011). CSF = cerebral spinal fluid, GSH = glutathione, LAC = lactate, rCBF = regional cerebral blood flow.
Peripherally obtained spinal fluid lactate was a variable that discriminated between the brain-affected group and the patients with <2 of the 4 brain-related outcomes [15.94 (±2.34 SEM) vs. 13.48 (±1.46), respectively; t=3.22, p=0.004]; lactate levels in the brain-affected group were also significantly higher than in healthy controls [15.94 (±2.34) vs. 13.05 (±4.27), respectively; t=2.14, p=0.043; corrected for multiple comparisons using Holm-Bonferroni]. Another discriminator between the groups appeared to be cerebral blood flow in regions not used to select these patients. Those in the brain-affected group had significantly lower rCBF in 33 of 36 bilateral regions compared to patients having <2 criteria. Only the thalamus, hippocampus and parahippocampus were not significantly different. All 33 differences still met criteria for significance after correction for multiple comparisons.
DISCUSSION
This study was undertaken to test the hypothesis that consistent brain-related abnormalities would be uncovered in the subgroup of CFS patients without current psychiatric comorbidity but not in those patients with that comorbidity. The results did not support this hypothesis. Stratifying patients by presence or absence of psychiatric comorbidity did not reveal significant subgroup differences in spinal fluid abnormalities, neuropsychological test results, ventricular lactate, cortical glutathione or cerebral blood flow. Thus, this study joins several prior others that found that the presence of psychiatric illness is not related to illness severity as reflected by illness course16,17, cognitive processing18, or physical function19. This result is very important because it indicates that neither the phenomenology of CFS nor its biology is driven by psychiatric diagnosis. Another important outcome of this study is that significant differences were found between pooled CFS patients and healthy controls that replicate the results of prior studies for higher rates of abnormal spinal fluid4, abnormally higher ventricular lactate15,20,21, lower cortical glutathione15, and lower regional cerebral blood flow3,22 in CFS. These grouped data support our working hypothesis that some CFS patients have an ongoing encephalopathic process responsible for their illness.
While these data showed consistent abnormalities for the group of all CFS patients across brain-related variables, they left unanswered the question of how often these abnormalities might be found in individual patients. Table 5 indicates that half the patients had more than one abnormality. This group of patients with multiple brain-related abnormalities would be the one to target in future studies aimed at identifying those with brain dysfunction. This strategy would reduce patient pool heterogeneity and would improve the chances of understanding the underlying pathophysiology producing CFS in this subgroup of patients. It will be important to determine if specific illness characteristics would help identify this brain-affected group. Our post-hoc analysis indicated that peripherally obtained spinal fluid lactate and cerebral blood flow outside of the regions used to define this subgroup discriminated these patients from ones without brain abnormalities or from healthy controls. But replication of these findings plus additional efforts to identify other predictors of the brain-affected group are needed in future studies.
Although the results of this study did not support the presence of more brain and spinal fluid abnormalities in CFS without rather than CFS with psychiatric comorbidity, as postulated, they have replicated and supported the results of our prior study15 that hypothesized that the observed abnormalities point to a pathophysiological model of CFS in which oxidative stress may underpin the clinical manifestations of the disorders. Ventricular lactate and cortical glutathione were altered to the same degree in CFS as in patients with major depressive disorder15; moreover levels of ventricular lactate were elevated to the same magnitude in CFS as in fibromyalgia23, a medically unexplained syndrome that overlaps with CFS19. While this means that neither brain chemical can be used as a specific biomarker for CFS, the inference is that both illnesses may share a pathophysiological link related to oxidative stress. Importantly however, ventricular lactate can serve as a marker for therapeutic efficacy. A recent study24 showed that milnacipran reduced ventricular lactate while also reducing ratings of pain severity in patients with fibromyalgia. Further studies are, therefore, warranted to determine whether some combination of these brain-related variables may serve as potential biomarkers that can advance the understanding, permit a more reliable diagnosis and point to more effective treatment targets in CFS.
Strengths and Weaknesses
The major strength of this study was that multiple and diverse assessments of brain function were determined in the same subject. This allowed us to test the hypothesis that some patients have brain dysfunction as the probable cause of their illness. That hypothesis was supported by table 5 listing how often patients had outlying values across the four brain-related variables which differentiated CFS from controls. A synonym for CFS, used often in the United Kingdom, is myalgic encephalomyelitis, a term originally applied to an early report of medically unexplained fatigue accompanied by neurological signs25. This term might be best applied to the subgroup of patients in Table 5 having multiple abnormalities in brain-related variables – i.e., the brain-affected group.
A limitation of the study is the fact that study participants had to be off brain active medications as these might have affected the brain-related variables under study – thus restricting participation in the study to patients who were either unmedicated or able to come off their medications. Another weakness relates to sample size in that not all study subjects agreed to provide data across all the brain-related variables under study. In addition, given the heterogeneous nature of CFS, it is possible that the sample sizes of our patient groups did not provide us with the power necessary to detect the actual differences in these populations. Nonetheless, there were sufficient numbers of patients and controls to allow us to generate the outlier analysis reported in Table 5.
Highlights.
As a group, CFS patients have higher brain ventricular lactate, more abnormal spinal fluid results, lower brain GSH, and reduced cerebral blood flow relative to healthy sedentary controls
Psychiatric comorbidity does not influence any of these potential biological markers of CFS
50% of the patients had more than one of these abnormalities
The subgroup of patients with brain abnormalities may have an underlying encephalopathy producing their illness
Acknowledgments
This research was supported by NIH grant NS-075653 to BHN.
Footnotes
Publisher's Disclaimer: This is a PDF file of an unedited manuscript that has been accepted for publication. As a service to our customers we are providing this early version of the manuscript. The manuscript will undergo copyediting, typesetting, and review of the resulting proof before it is published in its final citable form. Please note that during the production process errors may be discovered which could affect the content, and all legal disclaimers that apply to the journal pertain.
References
- 1.DeLuca J, Johnson SK, Ellis SP, Natelson BH. Cognitive functioning is impaired in chronic fatigue syndrome patients devoid of psychiatric disease. J Neurol Neurosurg Psychiatry. 1997;62:151–155. doi: 10.1136/jnnp.62.2.151. [DOI] [PMC free article] [PubMed] [Google Scholar]
- 2.Lange G, DeLuca J, Maldjian JA, Lee HJ, Tiersky LA, Natelson BH. Brain MRI abnormalities exist in a subset of patients with chronic fatigue syndrome. Journal of the Neurological Sciences. 1999;171(1):3–7. doi: 10.1016/s0022-510x(99)00243-9. [DOI] [PubMed] [Google Scholar]
- 3.Yoshiuchi K, Farkas J, Natelson BH. Patients with chronic fatigue syndrome have reduced absolute cortical blood flow. Clin Physiol Funct Imaging. 2006;26(2):83–86. doi: 10.1111/j.1475-097X.2006.00649.x. [DOI] [PubMed] [Google Scholar]
- 4.Natelson BH, Tseng C-L, Ottenweller JE. Spinal fluid abnormalities in patients with chronic fatigue syndrome. Clin Diagn LabImmunol. 2005;12(1):53–55. doi: 10.1128/CDLI.12.1.52-55.2005. [DOI] [PMC free article] [PubMed] [Google Scholar]
- 5.Fukuda K, Straus SE, Hickie I, et al. The chronic fatigue syndrome: A comprehensive approach to its definition and study. Ann Intern Med. 1994;121(12):953–959. doi: 10.7326/0003-4819-121-12-199412150-00009. [DOI] [PubMed] [Google Scholar]
- 6.First RLMBS, Gibbon M, Williams JBW. Structured Clinical Interview for DSM-IV-TR Axis I Disorders, Research Version, Non-patient Edition (SCID-I/NP) New York: Biometrics Research New York State Psychiatric Institute; 2002. Revision January 2010. [Google Scholar]
- 7.Uttl B. North American Adult Reading Test: age norms, reliability, and validity. Journal of clinical and experimental neuropsychology. 2002;24(8):1123–1137. doi: 10.1076/jcen.24.8.1123.8375. [DOI] [PubMed] [Google Scholar]
- 8.Gordon M, Mettelman BB. The assessment of attention: I. Standardization and reliability of a behavior-based measure. Journal of clinical psychology. 1988;44(5):682–690. doi: 10.1002/1097-4679(198809)44:5<682::aid-jclp2270440504>3.0.co;2-e. [DOI] [PubMed] [Google Scholar]
- 9.Wechsler D. Wechsler Adult Intelligence Scale. Fourth. San Antonio TX: Pearson; 2008. [Google Scholar]
- 10.Rey A. L’examen psychologique dans les cas d’encephalopathie traumatique.(Les problems) Arch Psychologie. 1941;28:215–285. [Google Scholar]
- 11.Ware JE, Jr, Snow KK, Kosinski M, Gandek B. SF-36 health survey Manual and interpretation guide. I. Boston: The Health Institute, New England Medical Center; 1993. [Google Scholar]
- 12.McNair DM, Lorr M, Droppleman LF. Profile of Mood States: Manual. San Diego: Educational and Industrial Testing Service; 1971. [Google Scholar]
- 13.Krupp LB, LaRocca NG, Muir-Nash J, Steinberg AD. The fatigue severity scale – Application to patients with Multiple Sclerosis and Systemic Lupus Erythematosus. Arch Neurol. 1989;46:1121–1123. doi: 10.1001/archneur.1989.00520460115022. [DOI] [PubMed] [Google Scholar]
- 14.Radloff LS. The CES-D scale: A self-report depression scale for research in the general population. Appl Psychol Measurement. 1977;1:385–401. [Google Scholar]
- 15.Shungu DC, Weiduschat N, Murrough JW, et al. Increased ventricular lactate in chronic fatigue syndrome. III. Relationships to cortical glutathione and clinical symptoms implicate oxidative stress in disorder pathophysiology. NMR Biomed. 2012;25(9):1073–1087. doi: 10.1002/nbm.2772. [DOI] [PMC free article] [PubMed] [Google Scholar]
- 16.Ciccone DS, Chandler HK, Natelson BH. Illness trajectories in the chronic fatigue syndrome: a longitudinal study of improvers versus non-improvers. J Nerv Ment Dis. 2010;198(7):486–493. doi: 10.1097/NMD.0b013e3181e4ce0b. [DOI] [PubMed] [Google Scholar]
- 17.Matsuda Y, Matsui T, Kataoka K, et al. A two-year follow-up study of chronic fatigue syndrome comorbid with psychiatric disorders. Psychiatry and clinical neurosciences. 2009;63(3):365–373. doi: 10.1111/j.1440-1819.2009.01954.x. [DOI] [PubMed] [Google Scholar]
- 18.Claypoole KH, Noonan C, Mahurin RK, Goldberg J, Erickson T, Buchwald D. A twin study of cognitive function in chronic fatigue syndrome: the effects of sudden illness onset. Neuropsychology. 2007;21(4):507–513. doi: 10.1037/0894-4105.21.4.507. [DOI] [PubMed] [Google Scholar]
- 19.Ciccone DS, Busichio K, Vickroy M. Effects of psychiatric morbidity and psychological distress on physical impairment in the chronic fatigue syndrome. J Psychosom Res. 2003;54:445–452. doi: 10.1016/s0022-3999(02)00525-1. [DOI] [PubMed] [Google Scholar]
- 20.Mathew SJ, Mao X, Keegan KA, et al. Ventricular cerebrospinal fluid lactate is increased in chronic fatigue syndrome compared with generalized anxiety disorder: an in vivo 3.0 T (1)H MRS imaging study. NMR Biomed. 2009;22(3):251–258. doi: 10.1002/nbm.1315. [DOI] [PubMed] [Google Scholar]
- 21.Murrough JW, Mao X, Collins KA, et al. Increased ventricular lactate in chronic fatigue syndrome measured by I H MRS imaging at 3T. II: Comparison with major depressive disorder. NMR Biomed. 2010;23:643–650. doi: 10.1002/nbm.1512. [DOI] [PubMed] [Google Scholar]
- 22.Biswal B, Kunwar P, Natelson BH. Cerebral blood flow is reduced in patients with chronic fatigue syndrome as assessed by arterial spin labeling. J Neurol Sci. 2011;301(1–2):9–11. doi: 10.1016/j.jns.2010.11.018. [DOI] [PMC free article] [PubMed] [Google Scholar]
- 23.Natelson BH, Vu D, Coplan JD, et al. Elevations of ventricular lactate levels occur in both chronic fatigue syndrome and fibromyalgia. Fatigue: Biomedicine, Health & Behavior. 2017 doi: 10.1080/21641846.2017.1280114. in press. [DOI] [PMC free article] [PubMed] [Google Scholar]
- 24.Natelson BH, Vu D, Mao X, et al. Effect of Milnacipran Treatment on Ventricular Lactate in Fibromyalgia: A Randomized, Double-Blind, Placebo-Controlled Trial. The journal of pain: official journal of the American Pain Society. 2015;16(11):1211–1219. doi: 10.1016/j.jpain.2015.08.004. [DOI] [PMC free article] [PubMed] [Google Scholar]
- 25.White DN, Burtch RB. Iceland disease: a new infection simulating acute anterior poliomyelitis. Neurology. 1954;4(7):506–516. doi: 10.1212/wnl.4.7.506. [DOI] [PubMed] [Google Scholar]