

SUMMARY
Melanomas accumulate a high burden of mutations that could potentially generate neoantigens, yet somehow suppress the immune response to facilitate continued growth. In this study, we identify a subset of human melanomas that have loss of function mutations in ATR, a kinase that recognizes and repairs UV-induced DNA damage and is required for cellular proliferation. ATR mutant tumors exhibit both the accumulation of multiple mutations and the altered expression of inflammatory genes, resulting in decreased T-cell recruitment and increased recruitment of macrophages known to spur tumor invasion. Taken together, these studies identify a mechanism by which melanoma cells modulate the immune microenvironment to promote continued growth.
eTOC Blurb
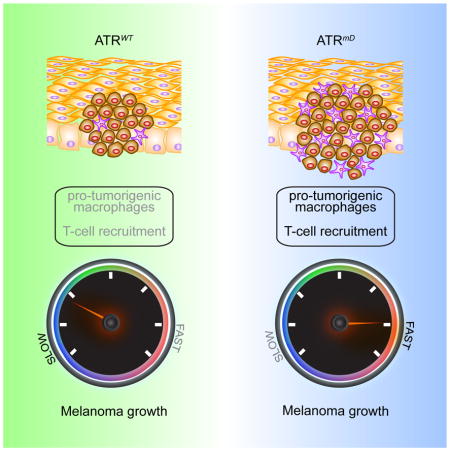
Tumors grow not only because they acquire mutations that promote their growth, but also because they prevent the immune system from recognizing them. Chen et al. identify ATR mutations in human melanoma tumors and determine that ATR mutant melanomas harness the immune system to accelerate tumor growth.
INTRODUCTION
Melanomas accumulate a high burden of UV-induced mutations (Hodis et al., 2012). While genomic studies have identified some putative melanoma driver mutations, leading to the development of agents such as MAP kinase inhibitors that induce tumor regression (Wellbrock and Arozarena, 2016), it is less understood how other UV-induced mutations and tumor heterogeneity as a whole modulates tumor growth. These questions are not easily addressed by existing in vivo models, as existing animal models are either genetically homogeneous or lack a functional immune system (Kuzu et al., 2015).
While UV-irradiation contributes to the high mutation burden in skin cancer (Martincorena et al., 2015), melanoma tumors accumulate even more mutations as they fail to repair UV-damaged DNA. Patients with the DNA repair disorder Xeroderma Pigmentosum have an increased risk of melanoma (Masaki et al., 2014), while mutations that affect telomere maintenance are also linked to melanoma (Potrony et al., 2015), and mutations in CDKN2a, which is commonly defective in melanoma (Hayward, 2003), also regulates genome maintenance (Box and Terzian, 2008). Melanoma cells also have DNA damage checkpoint defects-70% of cutaneous melanoma cell lines demonstrate defective G1 checkpoint arrest (Carson et al., 2012). Finally, some patients predisposed to melanoma have mutations in the MC1R receptor which is known to activate DNA repair mechanisms (Cassidy et al., 2015) by modulating the activity of the ATR kinase (Jarrett et al., 2015; Jarrett et al., 2014).
The ATR kinase is essential for the viability of both human and mouse cells (Brown and Baltimore, 2000; Cortez et al., 2001). In response to single stranded DNA damage, the ATR kinase is recruited to damaged DNA, becomes activated, and then phosphorylates its downstream target Chk1 (Cimprich and Cortez, 2008). Activation of Chk1 results in cell cycle arrest and DNA repair to prevent damaged cells from progressing through the cell cycle (Smits and Gillespie, 2015). Chk1 is essential for the development of murine melanocytes (Smith et al., 2013), identifying a specific role for ATR-Chk1 in the melanocyte lineage. While ATR is essential for replication, hypomorphic mutations in ATR are observed in Seckel syndrome (O’Driscoll et al., 2003), a recessive disorder characterized by developmental delay and premature aging. Similarly, ATR mutant (ATR mt) mice develop signs of premature aging and hair greying (Ruzankina et al., 2007). Partial loss-of-function ATR mutations also can cause an oropharyngeal cancer syndrome (Tanaka et al., 2012).
In this study, we sought to examine whether ATR mutations can contribute to the development of melanoma. We identify ATR loss of function mutations in human melanoma, and determine that introducing similar mutations into BRAF mt PTEN heterozygous mouse melanomas (Dankort et al., 2009) accelerates both tumor growth and mutation accumulation. ATR mt tumors in this model recruited proinflammatory macrophages while repelling T cells important for the anti-tumor response, identifying ATR mutations that modulate the immune response to promote growth.
RESULTS
Loss of Function ATR mutations are present in human melanoma
Initial studies identified mutations in the ATR pathway in human melanoma. 7% of melanoma tumors in the TCGA have mutations in genes that affect the ATR pathway (ATR and CHK1), with most of these mutations occurring in the ATR gene (6%) (Supplemental Data File1-sheet1). Analysis of an independent set of primary tumors revealed a higher incidence of ATR mutations (13%, Supplemental Data File1-sheet1). ATR mutations did not map to a specific hotspot within the open reading frame (Figure S1A, Supplemental Data File1-sheet2), and none of the ATR mutations observed were recurrent in the dataset analyzed. ATR mt tumor cell lines from this cohort were examined to determine whether they had defective cell cycle checkpoints. Upon UVB-irradiation, ATR is recruited to damaged DNA and initiates the phosphorylation of CHK1 at Serine 345, initiating cell cycle arrest (Marechal and Zou, 2013). While UVB-irradiation was sufficient to induce CHK1 phosphorylation in ATR-WT melanomas (WM983B, A375, MNT1, WM3211, WM3428) (Figure1A, left panel and Figure S1B), it did not induce the accumulation of phospho-CHK1 in ATR mt melanoma cell lines (JWCI-WGS18, JWCI-WGS22, MeWo, MB435S) as efficiently with the exception of JWCI-WGS01 and JWCI-WGS31 (Figure 1A).
Figure 1. Loss of function ATR mutations are present in human melanoma.

(A) ATR mts have a defective DNA damage checkpoints. ATR WT melanoma cell cultures were irradiated with UVB followed by western blotting with the indicated antibodies (Ab) (left panel). Relative protein accumulation was measured by densitometry (see values) relative to a GAPDH loading control. (B) ATR mutations do not accelerate the rate of proliferation of ATR mt human tumor cells. ATR WT or mts cells were labeled with EdU and the fraction of proliferating cells was determined. The graph represents the results of three independent experiments and error bars correspond to SEM. * p<0.05, **p<0.01; ***p<0.005 (C) ATR mts cells are more sensitive to UV-induced cell cycle arrest. ATR WT or mt cells were labeled with EdU for 1hr, irradiated with UVB, and the fraction of EdU+ cells was determined 0 and 6 hr post-UV as described. * p<0.05, **p<0.01 (D) Expression of ATR mts in A375 cells impaired the normal DNA damage response. A375 cells expressing either ATR FLAG tagged WT or mt constructs were lysed and immunoprecipitation with a FLAG antibody (M2) followed by western blotting with an ATR Ab to verify that each mt was expressed (left top panel). Total lysate from each culture expressing ATR WT or mt constructs was also immunoblotted with the indicated antibodies and relative accumulation of pChk1/Chk1 and pChk1/GAPDH was determined by densitometry. See also Figure S1 and Table S1A, B.
To assess whether ATR mt melanoma cell lines had defective cell cycle checkpoints, we examined whether UVB-irradiation induced cell cycle arrest in ATR WT (WM983B, A375) or mt melanomas. We excluded MNT-1 cells from this analysis as melanin in these cells interfered with the EdU assay. ATR mt cell lines incorporated less EdU after 1 hr of labeling as compared to ATR WT cells (Figure 1B) whether or not they exhibited defects in Chk1 phosphorylation, suggesting that all of these mts have some defects in the activation of ATR downstream targets. UVB-irradiation induced cell cycle arrest in ATR WT cells (A375), as similar percentages of EdU positive cells were observed in samples labeled for 1 hour followed by a 6 hr post UV chase as was observed in control cells labeled for 1 hr (Figure 1C, S1C). Several ATR-mt cell lines (JWCI-WGS18, MeWo, MB435S) had defects in UV-induced cell cycle arrest, as cells were able to proliferate after UV-irradiation, diluting out the population of cells that were labeled with EdU during the first hour (Figure 1B, S1C). The ability to overcome this replication block (Figure 1C) correlated with the magnitude of defects in UVB-induced Chk1 phosphorylation (Figure 1A). Taken together, these studies verify that subsets of melanoma tumors have ATR loss of function mutations.
Next, we verified that the ATR mutants in MB435S, MeWo, and JWCI-WGS18 cell lines, which exhibited altered UVB-induced checkpoints, interfered with the function of WT ATR. ATR mt constructs were generated and expressed at low levels in an A375 melanoma cell line that also express WT ATR. Initial studies verified that each WT or mt Flag-tagged ATR construct was expressed at a low level in A375 cells, and that these cell lines expressed similar levels of total ATR (Figure 1D, left panel). While UVB-irradiation induced Chk1 phosphorylation in cells that express WT ATR, UVB-irradiation was less efficient at inducing Chk1 phosphorylation in cells that express a kinase dead ATR mt (Figure 1D, D2475A) (Nghiem et al., 2001) or in cells that express the ATR mts that had defective DNA damage checkpoints as identified in Figure 1A and 1C (Figure 1D, right panel). These findings verify that the heterozygous ATR mutations observed in human tumors have functional consequences.
ATR mutations accelerate the growth and metastasis of melanomas in vivo
In order to determine whether ATR mutations contribute to tumor development and metastasis in vivo, we crossed Atrflox/flox mice in which the loxP sites flank the ATR kinase domain (Brown and Baltimore, 2003) (Figure 2A, 2B upper panel) with mice carrying a Tyrosinase::CreERT2 allele, a BrafCA allele, and zero, one or two copies of a Ptenlox4-5 allele (Dankort et al., 2009). The growth of nevi or tumors in this model could be modulated by altering the dosage of PTEN: melanocytes expressing mt BRAF and WT PTEN produce nevi but no melanoma, melanocytes expressing mt BRAF and one copy of PTEN form tumors that are visible after >75 days, while melanocytes that express mt BRAF and no PTEN rapidly develop melanomas that metastasize quickly (Dankort et al., 2009). Initial studies verified that: 1) mice containing BRAF mt melanocytes had a normal lifespan and didn’t develop tumors (Figure S2A); and 2) tumor development was influenced by the absence of one PTEN allele but not by ATR mt (Figure S2B).
Figure 2. ATR haploinsufficiency promotes the invasion and metastasis of BRAF mt melanomas in mice.

(A) Mice carrying various conditional alleles of Braf (BrafCA) , Pten (Ptenlox4-5) and/or ATR (ATRflox) were crossed to Tyr::CreER mice with melanocyte-specific expression Cre recombinase (CreERT2). Activation of CreER by 4-OHT leads to melanocyte-specific conversion of BrafCA to BrafV600E, Pten to null alleles and ATRflox to ATRmD. (B) Schematic of the ATRflox region (Brown and Baltimore, 2003). The kinase domain-encoding exons (KD1 and KD2) and primer locations were indicated (top panel). RT-PCR results are shown in the bottom panel. ATRmD/mD tumors expressed the floxed transcript. (C) ATRmD/mD melanoma cells have defects in ATR signaling. Lysates from mouse tumors were subjected to western blotting with the indicated specific antibodies. Relative densitometry values are shown below each blot. n.d. means non-detectable. (D) ATR haploinsufficiency promotes the growth of BRAFV600E PTEN+/− tumors. The mean tumor volume of ATR+/+, ATRmD/+, and ATRmD/mD tumors was 91.23+22.68 mm3 (n=28), 428.6+57.95 mm3 (n=28) (p<0.0001), and 495.4+145.8 mm3 (n=27) (p=0.0074), respectively. Error bars represent SEM. Representative photographs are shown (top panel). (E) ATR haploinsufficiency accelerates the demise of mice harboring BRAFV600E PTEN+/− tumors. Kaplan Meier survival curves for mice harboring BRAFV600E PTEN+/− with ATR+/+, ATRmD/+, and ATRmD/mD tumors with median lifespan 109 days (n=20), 95 days (n=25), and 97 days (n=11), respectively. (F) ATR haploinsufficiency does not accelerate the demise of mice harboring BRAFV600E PTEN−/− tumors. Kaplan Meier survival curves for mice harboring BRAFV600E PTEN−/− with ATR+/+, ATRmD/+, and ATRmD/mD tumors with median lifespan 39 days (n=13), 37 days (n=23), and 40.5 days (n=12), respectively. (G) ATR haploinsufficiency promotes the metastasis BRAFV600E PTEN−/− tumors. Mice bearing ATR+/+, ATRmD/+, and ATRmD/mD tumors averaged 1.22+0.43 (n=9), 6.60+0.75 (n=15) and 7.00+0.62 (n=7) metastases per mouse lung (p<0.0001), respectively. Error bars represent SEM. See also Figure S2 and Table S2.
In this set of experiments, we examined the consequences of ATR loss in nevi and melanoma using a published ATR flox model in which the excision of the ATR flox cassette is not 100% complete (Ruzankina et al., 2007), resulting in the generation of mice that have some melanocytes with no functional ATR and others with WT ATR. Over time, a mixed population of ATR−/− and ATR+/+ cells can then repopulate tissues of these animals. While this feature makes it difficult to measure the effect of complete ATR loss on tumor growth, it does generate tumors that have a mixture of different mutations as is observed in human melanoma. Induction of recombination with topical 4-OHT in these mice would result in the simultaneous BRAFV600E mutation, generation of some cells with mixed deletion of the ATR kinase domain (termed ATRmD), and PTEN deletion specifically in melanocytes (Figure 2A). The ATR protein is very large (300 kDa), yet the kinase domain of the protein is very small, making it impossible to distinguish truncated ATR from full length ATR by western blotting (Figure S2C). RT-PCR (reverse transcriptase PCR) of tumor RNA successfully demonstrated that ATR mD (mD/mD) tumors contained the truncated ATR transcript of the appropriate size (Figure 2B, bottom left panel) while also containing the WT transcript. Additional studies verified that mRNA corresponding to the floxed form of ATR was expressed in melanoma tumors (Figure 2B, bottom right panel). In order to verify that ATR mt melanomas had defects in cell cycle checkpoints, ATRmD/mD and ATR+/+ tumors were lysed, and subjected to western blotting with p-Chk1(S345) Ab. ATRmD/mD tumor cells exhibited decreased phosphorylation of CHK1 (Figure 2C), indicating that these tumors lacked normal cell cycle checkpoints. ATRmD/mD tumors also had less expression of ATR but no change in the expression of ATM (Figure 2C) even though the ATR flox allele migrates at the same size of the WT allele (Figure S2C). Taken together, these findings verify that the ATRmD/mD tumors had ATR singaling defects.
To examine whether ATR signaling influenced tumor progression, Tyrosinase::CreERT2; BrafCA/+; Ptenfl/+; Atrfl/+ or Atrfl/fl mice were generated and tumor formation was induced by topical administration of 4-OHT. PTEN+/− tumors were specifically selected for these experiments as these tumors develop more slowly, making it easier to identify an effect of ATR on tumor growth. BRAFV600E PTEN+/− ATRmD/+ tumors grew larger than BRAFV600E PTEN+/− ATR+/+ tumors (Figure 2D), ultimately resulting in the tumor growing so large that these mice had to be sacrificed prematurely for compassionate reasons (Figure 2E) (decrease in median survival of 14 days). While BRAFV600E PTEN+/− ATRmD/mD tumors grew to a larger size than ATR WT tumors (Figure 2D), the BRAFV600E PTEN+/− ATRmD/mD tumors did not reach a sufficient size that mice needed to be sacrificed sooner than mice carrying BRAFV600E PTEN+/− ATRmD/+ tumors (Figure 2E). These observations are consistent with other studies that have indicated that ATR can have differing effects on tumor growth dependent on gene dosage (Gilad et al., 2010).
Deletion of both copies of PTEN in mouse melanomas rapidly accelerates their growth, resulting in a high tumor burden that goes on to generate lung metastases (Dankort et al., 2009). Deletion of one or both copies of the ATR kinase domain in BRAFV600E PTEN null melanocytes did not result in an increased burden of tumors (Figure 2F), consistent with the published observation that BRAFV600E PTEN null tumors develop and metastasize rapidly. BRAFV600E PTEN−/− ATRmD/mD tumors did, however, have a higher propensity to metastasize to the lung as compared to BRAFV600E PTEN−/− tumors (Figure 2G, S2D). Taken together, these studies suggest that ATR mutations influence both the growth and metastasis of BRAF mt melanomas.
ATR mt promote the growth of BRAF mt nevi
As ATR mts modulate both tumor growth and metastasis, we next sought to examine the role of ATR mt in the growth of nascent tumors and nevi. First, we examined mice 75 days after birth when tumors are first readily visible. Both BRAFV600E PTEN+/− ATRmD/+ tumors and BRAFV600E PTEN+/− ATRmD/mD tumors (Figure 3A) were larger in size as compared to BRAFV600E PTEN+/− ATR+/+ tumors after 75 days. Moreover, a greater number of tumors were observed per mouse in mice carrying ATRmD/+ tumors and ATRmD/mD tumors (Figure 3A) when compared to ATR+/+ tumors. Tyrosinase::CreERT2;BrafCA/+ mice develop melanocytic nevi after 4-OHT administration that can progress to melanoma after a prolonged duration (Dhomen et al., 2009). To more accurately assess whether ATR deficiency affects tumor initiation, we generated Tyrosinase::CreERT2; BrafCA/+ Atrfl/fl mice and induced precancerous nevi formation using topical 4-OHT treatment. Initial experiments verified that Tyrosinase::CreERT2; BrafCA/+ Atrfl/fl and Tyrosinase::CreERT2; BrafCA/+ mice had no difference in overall survival, and validated that these mice had similar survival as WT mice as noted in earlier publications (Dankort et al., 2009) (Figure S2A, S2B). The number of nevi after tamoxifen topical administration in Tyrosinase::CreERT2; BrafCA/+ Atrfl/fl and Tyrosinase::CreERT2; BrafCA/+ mice was quantified visually and using multiphoton microscopy (MPM), a technique that utilizes only intrinsic fluorescent signals to generate a three-dimensional image of melanoma tumors (Balu et al., 2014). Tyrosinase::CreERT2; BrafCA/+ Atrfl/fl mice develop more nevi after 4-OHT treatment compared to Tyrosinase::CreERT2; BrafCA/+ mice (Figure 3B). By measuring the intrinsic fluorescent signals from melanin (red), keratin (green), and the second harmonic signals from collagen (blue) using MPM (Balu et al., 2014) (Figure 3C, Supplemental video 1–3), we were able to determine that the developing ATR mt nevi were larger in volume (Figure 3D) and occupied a larger volume of the skin (Figure 3E). There were also a larger number of nevi in Tyrosinase::CreERT2; BrafCA/+ Atrfl/fl mice although this number was just below statistical significance (p=0.0503) (Figure 3F). Taken together, these studies indicated that ATR deficiency affects tumor initiation.
Figure 3. ATR mt promotes the growth of BRAF mt nevi and melanomas.

(A) ATR mt promotes the growth of developing melanoma tumors. Tumors were induced in BrafCA/+ Ptenfl/+ Atrfl/+ or BrafCA/+ Ptenfl/+ Atrfl/fl mice and the size (bottom left panel) and number of tumors per mouse (bottom right panel) was determined after 75 days. Mice bearing ATR+/+ tumors had an average of 1.38+0.42 (n=8) tumors per mouse with a mean volume of 6.06+2.31 mm3 (n=13). Mice bearing ATRmD/+ tumors had an average of 3.9 +0.64 (n=10) tumors per mouse (p=0.0067) with a mean volume of volume of 70.69+19.42 mm3 (n=19), (p<0.0001). ATRmD/mD mice had an average of 3.33+0.88 (n=4), (p=0.048) with a mean volume of 74.69+22.77 mm3 (n=10), (p<0.0001). Error bars represent SEM. (B) ATR mutation promotes the growth of BRAF mt nevi. Nevi were induced in BrafCA/+ Atr+/+ and BrafCA/+ Atrfl/fl mice and visualized 50 days after induction on the underside of the skin by standard photography. Mice bearing ATRmD/mD and ATR+/+ nevi had an average of 259.8 +11.72 (n=4), and 74.75+27.69 (n=4) nevi per mouse, respectively. (p=0.0008). Error bars represent SEM. (C) ATR mt and ATR wt nevi visualized by label-free multiphoton microscopy of the mouse skin ex-vivo. MPM images from mice were obtained as described in methods, and a representative image from each genotype is shown. Top row (left to right): 3-D projections for normal skin, ATR wt and ATRmD/mD. Bottom row: orthogonal projection from the stacks of images. Colored lines indicate positions being displayed as xy (blue), xz (red) and yz (green) planes. FOV is 636μm x 636μm Cyan: SHG of collagen; Green: fluorescence of keratin; Yellow and Red – fluorescence of melanin. (D) ATR mt nevi are larger than ATR wt nevi. Average volume of melanocytic nevi within the upper 50 μm of the skin was measured (μm3) from 3-D skin reconstructions. (E) ATR mt nevi occupy a greater volume of the skin as compared to ATR wt nevi. Percentage of a volume occupied by pigmented lesions within the upper 50 μm of the skin compared to the total probed volume is reported and error bars represent S.D. (F) ATR mt promote the formation of BRAF mt nevi. Individual lesions were counted manually for all acquired stacks of images to the depth of 240 μm and then normalized to the volume of 10 stacks per each animal. A graph obtained from analyzing 5 mice in each group is shown.
ATR mt Melanomas Accumulate More Mutations
To investigate how ATR mutations affected mutation accumulation, the genomes of BRAFV600E PTEN+/− ATRmD/mD and BRAFV600E PTEN+/− ATR+/+ mouse tumors were sequenced and compared. Initial studies identified single nucleotide variants (SNVs) present in BRAFV600E PTEN+/− ATRmD/mD and BRAFV600E PTEN+/− ATR+/+ tumors and determined that ATR mt tumors accumulated more SNVs (Supplemental data file 1-sheet 4 and sheet 5). Comparison of the number of SNVs in these two tumors revealed that ATR mt tumors accumulated more single nucleotide variants (Figure 4A). ATR SNVs had no predilection for specific transitions or transversions (Figure 4B), and were randomly dispersed across the genome, including both coding and regulatory regions (Figure 4C). In contrast, there was not a drastic increase in the number of translocations in ATRmD/mD tumors (two inversions and one area of LOH was observed, data not shown), suggesting that the ATR mutation was not a complete loss of function, as has been described by others (Ruzankina et al., 2007), as it resulted in the accumulation of SNVs and not translocations as observed in ATR null cells (Chanoux et al., 2009). In addition, while ATR mt tumors accumulated more SNVs in chromosome 7 and 12 (Figure 4A), these SNVs were evenly distributed across the chromosome and did not localize to any particular hotspot (Figure S3), indicating that the altered growth properties of these tumors was unlikely to be driven by a specific mutation induced by ATR loss.
Figure 4. ATR mt Leads to the Generation of a Genetically Heterogeneous Tumor.

(A) ATR mt leads to the increased accumulation of single nucleotide variants in melanoma tumors. SNVs that were unique to ATRmD/mD tumors (not present in ATR+/+ tumors) were identified as described in methods. The number of ATR-dependent SNVs (as defined in the methods section) at each chromosomal location is reported in the graph. mD denotes ATR mt tumor and WT denotes ATR WT tumors. (B) ATR mt does not lead to the increased accumulation of specific transitions or transversions. The number of specific transitions and transversions that were unique to ATRmD/mD tumors was determined, and the relative proportion of each transition/transversion (proportion of total) is indicated. (C) Mutation frequencies in ATR mt Tumors. The frequencies of single nucleotide variants in ATR mt tumors were determined as described in methods. The number of coding and non-coding variants as well as the number of synonymous and non-synonymous variants was reported for each ATR mt tumor (mD1-mD4). See also Figure S3.
ATR mt Tumors Generate a Pro-Inflammatory Microenvironment that Supports Tumor Growth
Initial studies revealed that ATR mt melanoma cells do not proliferate more rapidly, as the number of Ki67 positive cells in ATR WT and mt tumors was similar (data not shown), consistent with published studies indicating that ATR function is required for cellular replication (Brown and Baltimore, 2003). In order to better understand how ATR deletion promotes the growth of tumors as a whole, RNA was collected from BRAFV600E ATRmD/mD nevi and BRAFV600E ATR+/+ nevi and subjected to RNA-seq and differential expression analysis (Figure S4A, Supplemental data file 1-sheet 6). ATR mt nevi had decreased expression of jun and fos (Figure 5A), serum response factors whose expression positively correlates with cellular proliferation (Verde et al., 2007), indicating that these tumors were not more proliferative (Figure S4A). Notably, ATR mt nevi had decreased expression of SkinT genes (Figure 5A), a class of genes known as butyrophilins (Abeler-Dorner et al., 2012) that promote T cell homing to epithelia (Barbee et al., 2011). ATR mt nevi also had decreased expression of CD4, a marker for T-cells and other immune cells (Figure 5A), indicating that ATR tumors downregulate T-cell homing mechanisms. Taken together, these studies suggested that ATR mt tumors do not proliferate more rapidly but instead promote tumor growth by modulating the immune response.
Figure 5. ATR mt tumors contain a greater number of infiltrating macrophages.

(A) ATR mt nevi modulate the immune response. RNA-sequencing and gene expression analysis was performed on ATR WT and ATR mt mouse nevi as described. Differentially expressed genes that regulate proliferation and the immune response identified in the dataset are shown here, while a larger heatmap (Figure S5A) and dataset is provided in the supplement (Supplemental data file 1 sheet3). Hierarchical clustering of RNA-seq normalized read counts obtained from EdgeR ranging from less frequently expressed (dark blue) to highly (dark red) genes is shown. (B) ATR mt tumors recruit macrophages to create a pro-inflammatory tumor microenvironment. ATR wt and mt tumor cells were labeled by CD3 (T cell marker), CD19 (B cell marker) and F4/80 (macrophage marker) antibodies and sorted by flow cytometry as described in the supplement. * p<0.05, ***p<0.001. 5 tumors were analyzed per group. Error bars represent SEM. (C) ATR mt tumors are enriched in M2 like macrophages. RNA samples from ATR wt or mt tumors were subjected to RT-qPCR. The top panel represents of M1 macrophage expression of iNOS, TNFα and IL-6. The bottom panel represents of M2 macrophage expression of ARG1, CD206 and PPARG. (D) ATR mt tumors express more PD-L1. RNA samples from ATR wt or ATR mt tumors were subjected to RT-qPCR using primers specific for PD-1 or PD-L1. ***p<0.001, ****p<0.0001, error bars represent SEM. See also Figure S4, S5, S6 and Table S2
To better characterize the effect of ATR mt on the immune response, flow cytometry was utilized to quantify the number of infiltrating immune cells in ATR mt and ATR WT tumors. ATRmD/mD melanoma tumors had decreased numbers of infiltrating T-cells (CD3+, pan T cell marker) and increased numbers of infiltrating macrophages (F4/80+) and B cells (CD19, B cell marker) as compared to ATRmD/+ and ATR+/+ tumors (Figure 5B). Interestingly, 40% of the cells in ATRmD tumors were macrophages. Consistent with this observation, RNA-seq analysis of BRAFV600E PTEN+/− ATRmD/mD tumors and BRAFV600E PTEN+/− ATR+/+ tumors did indicate that genes involved in immune activation were preferentially expressed in ATR mt tumors (Figure S5A, S5B, Supplemental data file 1-sheet 7). Immunohistochemical studies revealed that ATR mt tumors had increased numbers of infiltrating macrophages (Figure S4B) and decreased number of infiltrating T cells (Figure S4C), further verifying the flow cytometry results. Unfortunately, it was difficult to measure an effect on B cells histologically, as very few infiltrating B cells were present in either specimen (Figure S4D).
Blood monocytes extravagate into target tissues where they differentiate into mature macrophages and polarize into diverse subsets depending on environmental challenge (Murray and Wynn, 2011). While macrophage polarization is exceedingly complex, simplified in vitro models suggest that macrophages can polarize into “M1” subsets which are involved in generating an anti-tumor immune response or “M2” polarized subsets which can exert anti-inflammatory and pro-tumorigenic properties (Galdiero et al., 2013). Macrophages are detected in genetically heterogeneous tumors (Bauer et al., 2011) and can promote melanoma invasion and metastasis (Wang et al., 2015). Gene expression studies revealed that ATRmD/mD tumors expressed high levels of “M2” macrophage markers (Arg1, CD206, PPARG) (Martinez and Gordon, 2014), consistent with the contention that these infiltrating cells had pro-tumorigenic properties. In contrast, ATRmD/mD tumors exhibited the same level of expression of markers known to be associated with “M1” anti-tumor macrophages (iNOS, TNF-α, IL-6) (Martinez and Gordon, 2014) (Figure 5C, Supplementary Data File 1 Sheet5). Melanoma cells are known to avoid the immune response by activating the expression of PD-L1 (Tumeh et al., 2014). ATRmD/mD tumors expressed higher levels of PD-L1 and lower levels of PD-1 as compared to ATR+/+ tumors (Figure 5D, Supplemental data file 1-sheet 7), indicating that ATR deficient tumors also modulated the PD1 immune checkpoint as is observed in human melanomas.
Discussion
Interactions between melanoma cells and immune cells are critical in promoting tumor initiation, tumor angiotropism (Bald et al., 2014), and therapy resistance (Holzel et al., 2013). Cancer cells express PD-L1 and CTLA4, which prevents the immune system from recognizing and destroying tumor cells (Munn and Bronte, 2015), and PD-1 and CTLA4 blocking antibodies can activate the anti-tumor response, leading to tumor regression (Larkin et al., 2015; Yang, 2015). Existing mouse melanoma models either generate clonal tumors with little diversity or examine the immune response in syngeneic models that poorly mimic human disease (Merlino et al., 2013). The autochthonous mouse melanoma model established here has an intact immune system and generates tumors with mutations in tumor drivers, tumor suppressors, as well as defects in DNA repair. The observation that M2 macrophages promote tumor growth in this model are consistent with clinical observations that melanomas with more tumor-infiltrating, M2-like macrophages have a poorer prognosis (Bronkhorst et al., 2011), and other observations that macrophages promote melanoma metastasis (Wang et al., 2015). Interestingly, ATR mosaic, p53 null mice also had an increased number of macrophages localized around the hair follicle (Ruzankina et al., 2009), indicating that ATR deletion modulates macrophage function. Tumors from ATR mt mice also overexpress PD-L1, similar to what has been observed in human melanoma tumors that respond to PD1 inhibitors (Tumeh et al., 2014). In addition, ATR mt tumors downregulate the expression of butyrophilins (Abeler-Dorner et al., 2012), which normally promote T cell homing to epithelia (Barbee et al., 2011).
Recent studies have highlighted that tumors that have a higher mutation load are more responsive to immunotherapies (Snyder et al., 2014; Van Allen et al., 2015). While some studies have suggested that this is the result of generating more tumor neo-antigens, it is currently unclear why a tumor that expresses a high load of neoantigens would be resistant to immunotherapy in the first place. The studies presented here identify mutations within tumor cells themselves that allow them to suppress the T cell immune response and recruit macrophages known to promote tumor growth. The mouse model described here is an ideal system to elucidate how melanoma tumors modulate the immune response in order to develop better immunotherapies.
Experimental Procedures
Mouse breeding, activation of Tyrosinase::CreERT2 transgene, and experimental endpoints
Atrflox, Tyrosinase::CreERT2, BrafCa, and Ptenlox4-5 mice were genotyped using established protocols. 3μl of a 25 mg/ml solution of 4-OHT (98% Z-isomer, Sigma-Aldrich, St. Louis, MO, USA) in DMSO was applied to the right flank, back skin and tail of mice on postnatal days 2, 3 and 4. Institutional Animal Care and Use Committee (IACUC) of the University of California Irvine approved our study protocols. The decision to euthanize mice was determined by independent University Lab Animal Resource (ULAR) staffs that were blinded with respect to the mouse genotype. Mice were euthanized if the volume of their tumors exceeded 10% of total body volume, if tumors were significantly ulcerated, if mice were moribund, if they lost weight, if they were lethargic, or if they were unable to ambulate.
Multiphoton microscopy of mouse skin
Experimental mice were shave depilated at p50 (second telogen), euthanized, and immediately imaged ex-vivo (no labeling) with multiphoton microscopy (MPM) to capture the fluorescence signal from keratin and melanins and second harmonic generated (SHG) signal from collagen using LSM 510 NLO Zeiss system. Fluorescence and second harmonic generation was excited by femtosecond Titanium: Sapphire (Chameleon-Ultra, Coherent) laser at 900 nm. Emission was detected at 390–465 nm for SHG channel (blue), and 500–550 nm (green) and 565–650 (red) fluorescence channels. Each animal was imaged at 8 to 10 randomly chosen locations on depilated skin of the lower back. Stacks of optical sections of 636μmx636μm at different depths ranging from 0 to 240 μm (5 μm steps) were obtained to allow for 3-D volume reconstruction (LSM Image Browser, Carl Zeiss GMBH).
Cell Culture and UVB irradition
For details, see Supplemental Experimental Procedures.
Western blotting of cell lines and mouse tumors and antibodies
For details, see Supplemental Experimental Procedures.
Expression of ATR wt and mt constructs in A375 melanoma cells
pcDNA3-ATR WT expression construct was purchased form Addgene (plasmid #31611). The ATR mts were generated by site-specific mutagenesis. (Agilent Technologies, Santa Clara, CA). Plasmids were transfected into A375 cell line by Turbofect transfection reagent (Thermo Scientific, Waltham, MA). 48hrs after transfection, cells were selected by G418 selection for 7days. Selected cells were either exposed to UV irradiation as indicated or subjected to immunoprecipitation followed by western blotting as indicated.
EdU labeling and flow cytometry
Cells were labeled with 10 μM Edu for 1h, then were irradiated with UVB (250J/m2). At 0hr or 6hr post-UV cells were fixed and stained with Click-iT Plus EdU Alexa Fluor 647 Flow Cytometry assay kit (Life technology, Grand Island, NY, USA) according to the manufacture’s protocol. Cells were subjected to Flow Cytometry with an Attune Acoustic Focusing Cytometer (Life technology, Grand Island, NY, USA) to analyze the EdU positive cells. The resulting data were analyzed using Acoustic Focusing Cytometer software (Life technology, Grand Island, NY, USA).
RNA-Seq., Genomic DNA-Seq., and Tumor volume measurements
For details, see Supplemental Experimental Procedures.
CD3, CD19and F4/80 flow cytometry analysis
End stage of mouse tumors were obtained from BRAFV600E PTEN+/− ATRmD/mD, or BRAFV600E PTEN+/− ATR+/+. Tumors were surgically excised, washed with 70% ethanol and PBS. Tumors were minced with a scalpel and dissociated using a tumor dissociation kit (#130-096-730) and gentleMACs (Miltenyi Biotec, Auburn, CA) according to the manufacture’s protocol. Dissociated tumor cells were labeled by CD3 (17A2)-PE/Cy7, CD19(6D5)-APC and F4/80 (BM8)-APC/Cy7 (BioLegend, San Diego, CA). Cells were subjected to flow cytometry using an Attune Acoustic Focusing Cytometer (Life technology, Grand Island, NY) to analyze the CD3, CD19 and F4/80 positive cells. The resulting data were analyzed using Acoustic Focusing Cytometer software (Life technology, Grand Island, NY, USA).
RAW264.7 culture and cytokine stimulation. And mRNA preparation, reverse transcription, and real-time PCR
For details, see Supplemental Experimental Procedures.
Statistical analysis
Kaplan Meier survival curves were generated and significance was assessed using the log-rank test, an unpaired t-test, or a two way ANOVA test. Volume of pigmented lesions from MPM images were measured manually on orthogonal projections to access length, width and depth of a nevus as it is outlined by a bright luminescence from melanin. Four animals per group (wt vs mD/mD) were imaged. Other data was analyzed by GraphPad Prism6 statistical analysis software using an unpaired t-test or two way Anova test. Significances were as indicated.
Supplementary Material
HIGHLIGHTS.
Loss of function mutations in ATR are present in human melanoma tumors.
ATR mutant nevi and melanomas grow larger than tumors that have functional ATR.
ATR mutant tumors recruit pro-tumorigenic macrophages and block T cell recruitment.
ATR mutations accelerate tumor growth by modulating the tumor microenvironment.
Acknowledgments
We thank Marcus Bosenberg, Martin McMahon, and Eric Brown for providing us the BRAF mutant and ATR mutant mice necessary to generate our tumor model. We thank Raymond Zhou, Amy Hopkin, Katerina Yale, and Vikram Ganesan for technical assistance and Bogi Andersen, Marian Waterman, and Eric Pearlman for reviewing the manuscript. This work was supported by grants from NIH (1R01CA151513-01 to AKG) and (1R01AR063116 to AKG), NSF (DGE-1321846 to RRV), the Ford Foundation (RRV), and the Stanley Behrens Fellowship (RRV). The multiphoton microscopy studies were supported by award P41EB015890 from NIBIB (BJT and TBK), and the genomic studies by P30CA062203 from NCI (JW).
Footnotes
Author Contributions
Conceptualization, Validation, and Writing-Original Draft, C.C. and A.K.G.; Investigation, C.C., R.R., P.V., F.E., S.H., and T.B.K.; Validation, S.dF., B.J.T., and D.S.H.; Software and Data Curation , J.W. and R.R.; Formal Analysis, C.C., R.R., and C.P.G. Writing-Review & Editing, all authors.
Accession Numbers
The accession number for FACS analysis data reported in this article has been submitted in FlowRepository. Repository ID: FR-FCM-ZYZT and FR-FCM-ZYZU. RNA-seq data was deposited into GEO (Accession Number: GSE94265). SNVs were deposited at dbSNP and can be accessed at https://www.ncbi.nlm.nih.gov/SNP/snp_viewBatch.cgi?sbid=1062759.
Publisher's Disclaimer: This is a PDF file of an unedited manuscript that has been accepted for publication. As a service to our customers we are providing this early version of the manuscript. The manuscript will undergo copyediting, typesetting, and review of the resulting proof before it is published in its final citable form. Please note that during the production process errors may be discovered which could affect the content, and all legal disclaimers that apply to the journal pertain.
References
- Abeler-Dorner L, Swamy M, Williams G, Hayday AC, Bas A. Butyrophilins: an emerging family of immune regulators. Trends Immunol. 2012;33:34–41. doi: 10.1016/j.it.2011.09.007. [DOI] [PubMed] [Google Scholar]
- Bald T, Quast T, Landsberg J, Rogava M, Glodde N, Lopez-Ramos D, Kohlmeyer J, Riesenberg S, van den Boorn-Konijnenberg D, Homig-Holzel C, et al. Ultraviolet-radiation-induced inflammation promotes angiotropism and metastasis in melanoma. Nature. 2014;507:109–113. doi: 10.1038/nature13111. [DOI] [PubMed] [Google Scholar]
- Balu M, Kelly KM, Zachary CB, Harris RM, Krasieva TB, Konig K, Durkin AJ, Tromberg BJ. Distinguishing between benign and malignant melanocytic nevi by in vivo multiphoton microscopy. Cancer Res. 2014;74:2688–2697. doi: 10.1158/0008-5472.CAN-13-2582. [DOI] [PMC free article] [PubMed] [Google Scholar]
- Barbee SD, Woodward MJ, Turchinovich G, Mention JJ, Lewis JM, Boyden LM, Lifton RP, Tigelaar R, Hayday AC. Skint-1 is a highly specific, unique selecting component for epidermal T cells. Proc Natl Acad Sci U S A. 2011;108:3330–3335. doi: 10.1073/pnas.1010890108. [DOI] [PMC free article] [PubMed] [Google Scholar]
- Bauer K, Michel S, Reuschenbach M, Nelius N, von Knebel Doeberitz M, Kloor M. Dendritic cell and macrophage infiltration in microsatellite-unstable and microsatellite-stable colorectal cancer. Fam Cancer. 2011;10:557–565. doi: 10.1007/s10689-011-9449-7. [DOI] [PubMed] [Google Scholar]
- Box NF, Terzian T. The role of p53 in pigmentation, tanning and melanoma. Pigment Cell Melanoma Res. 2008;21:525–533. doi: 10.1111/j.1755-148X.2008.00495.x. [DOI] [PubMed] [Google Scholar]
- Bronkhorst IH, Ly LV, Jordanova ES, Vrolijk J, Versluis M, Luyten GP, Jager MJ. Detection of M2-macrophages in uveal melanoma and relation with survival. Invest Ophthalmol Vis Sci. 2011;52:643–650. doi: 10.1167/iovs.10-5979. [DOI] [PubMed] [Google Scholar]
- Brown EJ, Baltimore D. ATR disruption leads to chromosomal fragmentation and early embryonic lethality. Genes Dev. 2000;14:397–402. [PMC free article] [PubMed] [Google Scholar]
- Brown EJ, Baltimore D. Essential and dispensable roles of ATR in cell cycle arrest and genome maintenance. Genes Dev. 2003;17:615–628. doi: 10.1101/gad.1067403. [DOI] [PMC free article] [PubMed] [Google Scholar]
- Carson C, Omolo B, Chu H, Zhou Y, Sambade MJ, Peters EC, Tompkins P, Simpson DA, Thomas NE, Fan C, et al. A prognostic signature of defective p53-dependent G1 checkpoint function in melanoma cell lines. Pigment Cell Melanoma Res. 2012;25:514–526. doi: 10.1111/j.1755-148X.2012.01010.x. [DOI] [PMC free article] [PubMed] [Google Scholar]
- Cassidy PB, Abdel-Malek ZA, Leachman SA. Beyond Red Hair and Sunburns: Uncovering the Molecular Mechanisms of MC1R Signaling and Repair of UV-Induced DNA Damage. J Invest Dermatol. 2015;135:2918–2921. doi: 10.1038/jid.2015.349. [DOI] [PMC free article] [PubMed] [Google Scholar]
- Chanoux RA, Yin B, Urtishak KA, Asare A, Bassing CH, Brown EJ. ATR and H2AX cooperate in maintaining genome stability under replication stress. J Biol Chem. 2009;284:5994–6003. doi: 10.1074/jbc.M806739200. [DOI] [PMC free article] [PubMed] [Google Scholar]
- Cimprich KA, Cortez D. ATR: an essential regulator of genome integrity. Nat Rev Mol Cell Biol. 2008;9:616–627. doi: 10.1038/nrm2450. [DOI] [PMC free article] [PubMed] [Google Scholar]
- Cortez D, Guntuku S, Qin J, Elledge SJ. ATR and ATRIP: partners in checkpoint signaling. Science. 2001;294:1713–1716. doi: 10.1126/science.1065521. [DOI] [PubMed] [Google Scholar]
- Dankort D, Curley DP, Cartlidge RA, Nelson B, Karnezis AN, Damsky WE, Jr, You MJ, DePinho RA, McMahon M, Bosenberg M. Braf(V600E) cooperates with Pten loss to induce metastatic melanoma. Nat Genet. 2009;41:544–552. doi: 10.1038/ng.356. [DOI] [PMC free article] [PubMed] [Google Scholar]
- Dhomen N, Reis-Filho JS, da Rocha Dias S, Hayward R, Savage K, Delmas V, Larue L, Pritchard C, Marais R. Oncogenic Braf induces melanocyte senescence and melanoma in mice. Cancer Cell. 2009;15:294–303. doi: 10.1016/j.ccr.2009.02.022. [DOI] [PubMed] [Google Scholar]
- Galdiero MR, Bonavita E, Barajon I, Garlanda C, Mantovani A, Jaillon S. Tumor associated macrophages and neutrophils in cancer. Immunobiology. 2013;218:1402–1410. doi: 10.1016/j.imbio.2013.06.003. [DOI] [PubMed] [Google Scholar]
- Gilad O, Nabet BY, Ragland RL, Schoppy DW, Smith KD, Durham AC, Brown EJ. Combining ATR suppression with oncogenic Ras synergistically increases genomic instability, causing synthetic lethality or tumorigenesis in a dosage-dependent manner. Cancer Res. 2010;70:9693–9702. doi: 10.1158/0008-5472.CAN-10-2286. [DOI] [PMC free article] [PubMed] [Google Scholar]
- Hayward NK. Genetics of melanoma predisposition. Oncogene. 2003;22:3053–3062. doi: 10.1038/sj.onc.1206445. [DOI] [PubMed] [Google Scholar]
- Hodis E, Watson IR, Kryukov GV, Arold ST, Imielinski M, Theurillat JP, Nickerson E, Auclair D, Li L, Place C, et al. A landscape of driver mutations in melanoma. Cell. 2012;150:251–263. doi: 10.1016/j.cell.2012.06.024. [DOI] [PMC free article] [PubMed] [Google Scholar]
- Holzel M, Bovier A, Tuting T. Plasticity of tumour and immune cells: a source of heterogeneity and a cause for therapy resistance? Nat Rev Cancer. 2013;13:365–376. doi: 10.1038/nrc3498. [DOI] [PubMed] [Google Scholar]
- Jarrett SG, Wolf Horrell EM, Boulanger MC, D’Orazio JA. Defining the Contribution of MC1R Physiological Ligands to ATR Phosphorylation at Ser435, a Predictor of DNA Repair in Melanocytes. J Invest Dermatol. 2015;135:3086–3095. doi: 10.1038/jid.2015.280. [DOI] [PMC free article] [PubMed] [Google Scholar]
- Jarrett SG, Wolf Horrell EM, Christian PA, Vanover JC, Boulanger MC, Zou Y, D’Orazio JA. PKA-mediated phosphorylation of ATR promotes recruitment of XPA to UV-induced DNA damage. Mol Cell. 2014;54:999–1011. doi: 10.1016/j.molcel.2014.05.030. [DOI] [PMC free article] [PubMed] [Google Scholar] [Retracted]
- Kuzu OF, Nguyen FD, Noory MA, Sharma A. Current State of Animal (Mouse) Modeling in Melanoma Research. Cancer Growth Metastasis. 2015;8:81–94. doi: 10.4137/CGM.S21214. [DOI] [PMC free article] [PubMed] [Google Scholar]
- Larkin J, Lao CD, Urba WJ, McDermott DF, Horak C, Jiang J, Wolchok JD. Efficacy and Safety of Nivolumab in Patients With BRAF V600 Mutant and BRAF Wild-Type Advanced Melanoma: A Pooled Analysis of 4 Clinical Trials. JAMA Oncol. 2015;1:433–440. doi: 10.1001/jamaoncol.2015.1184. [DOI] [PubMed] [Google Scholar]
- Marechal A, Zou L. DNA damage sensing by the ATM and ATR kinases. Cold Spring Harb Perspect Biol. 2013;5 doi: 10.1101/cshperspect.a012716. [DOI] [PMC free article] [PubMed] [Google Scholar]
- Martincorena I, Roshan A, Gerstung M, Ellis P, Van Loo P, McLaren S, Wedge DC, Fullam A, Alexandrov LB, Tubio JM, et al. Tumor evolution. High burden and pervasive positive selection of somatic mutations in normal human skin. Science. 2015;348:880–886. doi: 10.1126/science.aaa6806. [DOI] [PMC free article] [PubMed] [Google Scholar]
- Martinez FO, Gordon S. The M1 and M2 paradigm of macrophage activation: time for reassessment. F1000Prime Rep. 2014;6:13. doi: 10.12703/P6-13. [DOI] [PMC free article] [PubMed] [Google Scholar]
- Masaki T, Wang Y, DiGiovanna JJ, Khan SG, Raffeld M, Beltaifa S, Hornyak TJ, Darling TN, Lee CC, Kraemer KH. High frequency of PTEN mutations in nevi and melanomas from xeroderma pigmentosum patients. Pigment Cell Melanoma Res. 2014;27:454–464. doi: 10.1111/pcmr.12226. [DOI] [PMC free article] [PubMed] [Google Scholar]
- Merlino G, Flaherty K, Acquavella N, Day CP, Aplin A, Holmen S, Topalian S, Van Dyke T, Herlyn M. Meeting report: The future of preclinical mouse models in melanoma treatment is now. Pigment Cell Melanoma Res. 2013;26:E8–E14. doi: 10.1111/pcmr.12099. [DOI] [PMC free article] [PubMed] [Google Scholar]
- Munn DH, Bronte V. Immune suppressive mechanisms in the tumor microenvironment. Curr Opin Immunol. 2015;39:1–6. doi: 10.1016/j.coi.2015.10.009. [DOI] [PMC free article] [PubMed] [Google Scholar]
- Murray PJ, Wynn TA. Protective and pathogenic functions of macrophage subsets. Nat Rev Immunol. 2011;11:723–737. doi: 10.1038/nri3073. [DOI] [PMC free article] [PubMed] [Google Scholar]
- Nghiem P, Park PK, Kim Y, Vaziri C, Schreiber SL. ATR inhibition selectively sensitizes G1 checkpoint-deficient cells to lethal premature chromatin condensation. Proc Natl Acad Sci U S A. 2001;98:9092–9097. doi: 10.1073/pnas.161281798. [DOI] [PMC free article] [PubMed] [Google Scholar]
- O’Driscoll M, Ruiz-Perez VL, Woods CG, Jeggo PA, Goodship JA. A splicing mutation affecting expression of ataxia-telangiectasia and Rad3-related protein (ATR) results in Seckel syndrome. Nat Genet. 2003;33:497–501. doi: 10.1038/ng1129. [DOI] [PubMed] [Google Scholar]
- Potrony M, Badenas C, Aguilera P, Puig-Butille JA, Carrera C, Malvehy J, Puig S. Update in genetic susceptibility in melanoma. Ann Transl Med. 2015;3:210. doi: 10.3978/j.issn.2305-5839.2015.08.11. [DOI] [PMC free article] [PubMed] [Google Scholar]
- Ruzankina Y, Pinzon-Guzman C, Asare A, Ong T, Pontano L, Cotsarelis G, Zediak VP, Velez M, Bhandoola A, Brown EJ. Deletion of the developmentally essential gene ATR in adult mice leads to age-related phenotypes and stem cell loss. Cell Stem Cell. 2007;1:113–126. doi: 10.1016/j.stem.2007.03.002. [DOI] [PMC free article] [PubMed] [Google Scholar]
- Ruzankina Y, Schoppy DW, Asare A, Clark CE, Vonderheide RH, Brown EJ. Tissue regenerative delays and synthetic lethality in adult mice after combined deletion of Atr and Trp53. Nat Genet. 2009;41:1144–1149. doi: 10.1038/ng.441. [DOI] [PMC free article] [PubMed] [Google Scholar]
- Smith J, Larue L, Gillespie DA. Chk1 is essential for the development of murine epidermal melanocytes. Pigment Cell Melanoma Res. 2013;26:580–585. doi: 10.1111/pcmr.12100. [DOI] [PubMed] [Google Scholar]
- Smits VA, Gillespie DA. DNA damage control: regulation and functions of checkpoint kinase 1. FEBS J. 2015;282:3681–3692. doi: 10.1111/febs.13387. [DOI] [PubMed] [Google Scholar]
- Snyder A, Makarov V, Merghoub T, Yuan J, Zaretsky JM, Desrichard A, Walsh LA, Postow MA, Wong P, Ho TS, et al. Genetic basis for clinical response to CTLA-4 blockade in melanoma. N Engl J Med. 2014;371:2189–2199. doi: 10.1056/NEJMoa1406498. [DOI] [PMC free article] [PubMed] [Google Scholar]
- Tanaka A, Weinel S, Nagy N, O’Driscoll M, Lai-Cheong JE, Kulp-Shorten CL, Knable A, Carpenter G, Fisher SA, Hiragun M, et al. Germline mutation in ATR in autosomal-dominant oropharyngeal cancer syndrome. Am J Hum Genet. 2012;90:511–517. doi: 10.1016/j.ajhg.2012.01.007. [DOI] [PMC free article] [PubMed] [Google Scholar]
- Tumeh PC, Harview CL, Yearley JH, Shintaku IP, Taylor EJ, Robert L, Chmielowski B, Spasic M, Henry G, Ciobanu V, et al. PD-1 blockade induces responses by inhibiting adaptive immune resistance. Nature. 2014;515:568–571. doi: 10.1038/nature13954. [DOI] [PMC free article] [PubMed] [Google Scholar]
- Van Allen EM, Miao D, Schilling B, Shukla SA, Blank C, Zimmer L, Sucker A, Hillen U, Foppen MH, Goldinger SM, et al. Genomic correlates of response to CTLA-4 blockade in metastatic melanoma. Science. 2015;350:207–211. doi: 10.1126/science.aad0095. [DOI] [PMC free article] [PubMed] [Google Scholar]
- Verde P, Casalino L, Talotta F, Yaniv M, Weitzman JB. Deciphering AP-1 function in tumorigenesis: fra-ternizing on target promoters. Cell Cycle. 2007;6:2633–2639. doi: 10.4161/cc.6.21.4850. [DOI] [PubMed] [Google Scholar]
- Wang T, Xiao M, Ge Y, Krepler C, Belser E, Lopez-Coral A, Xu X, Zhang G, Azuma R, Liu Q, et al. BRAF Inhibition Stimulates Melanoma-Associated Macrophages to Drive Tumor Growth. Clin Cancer Res. 2015;21:1652–1664. doi: 10.1158/1078-0432.CCR-14-1554. [DOI] [PMC free article] [PubMed] [Google Scholar]
- Wellbrock C, Arozarena I. The Complexity of the ERK/MAP-Kinase Pathway and the Treatment of Melanoma Skin Cancer. Front Cell Dev Biol. 2016;4:33. doi: 10.3389/fcell.2016.00033. [DOI] [PMC free article] [PubMed] [Google Scholar]
- Yang Y. Cancer immunotherapy: harnessing the immune system to battle cancer. J Clin Invest. 2015;125:3335–3337. doi: 10.1172/JCI83871. [DOI] [PMC free article] [PubMed] [Google Scholar]
Associated Data
This section collects any data citations, data availability statements, or supplementary materials included in this article.