

Abstract
Background: In clinical practice, bone mineral density (BMD) determined by dual-energy x-ray absorptiometry is used to monitor response to osteoporosis therapy. However, 1 to 2 yr are usually required to assess patients’ BMD responses. The possibility of earlier indicators of a response or nonresponse to treatment, such as changes in bone turnover markers (BTMs), is of interest to physicians and patients.
Methods: In this post hoc analysis of women treated with once-weekly bisphosphonates, we examined the association of tertile percentage change from baseline in BTMs at 3 or 6 months and association of several baseline clinical characteristics with 24-month percentage change from baseline in BMD and with percentage of patients showing BMD nonresponse (defined as BMD loss at two or more of four sites) at 24 months. Multivariable analysis was performed to determine which factors were independently associated with BMD nonresponse.
Results: Patients in the tertile with the greatest decrease in each of the BTMs had the greatest mean increase in BMD and the lowest percentage of BMD nonresponders at 24 months. Several characteristics were independently associated with BMD nonresponse, including smaller 3-month reductions from baseline in serum C-terminal telopeptide of type 1 collagen, bone-specific alkaline phosphatase, and N-terminal propeptide of type 1 procollagen; younger age of menopause; a family history of osteoporosis; and higher baseline trochanteric BMD. Baseline BTMs were not predictive of 24-month BMD response to therapy. The strongest associations were for changes in BTMs with treatment.
Conclusion: In groups of patients, short-term changes in markers of bone turnover appear to be predictors of longer term BMD response and nonresponse to bisphosphonate therapy.
In groups of patients, short-term changes in bone turnover markers were predictive of longer term bone mineral density response and non-response to bisphosphonate therapy.
Osteoporosis affects approximately 8 million postmenopausal women in the United States (1). Treatment with antiresorptive medications, such as bisphosphonates, hormone replacement therapy, or selective estrogen receptor modulators, has been associated with increases in bone mineral density (BMD), reduction of bone turnover markers (BTMs), and decreased risk of fragility fractures (2, 3, 4, 5, 6, 7, 8, 9, 10). Furthermore, reduction of bone turnover has been shown to decrease significantly the risk of fracture, independent of the change in BMD (11, 12, 13).
Of interest to physicians and patients is a means of predicting whether a patient will or will not respond to osteoporosis therapy. Measurement of areal BMD by dual-energy x-ray absorptiometry (DXA) is the clinical tool used to monitor response to osteoporosis therapy. In general, patients are considered to have a positive response to therapy if BMD remains stable or increases on therapy, whereas BMD loss (nonresponse) has been shown to correlate with greater risk of fracture (12, 14, 15, 16). Hence, early identification of BMD response to therapy is of clinical interest (16, 17, 18). One of the main limitations to BMD testing in clinical practice is the need to wait 1 to 2 yr to assess a patient’s response to antiresorptive therapy (19). On the other hand, several studies have shown significant decreases in biochemical markers of bone formation or resorption within days to months of initiating therapy (20). Prior studies have also shown that early changes in BTMs during treatment are associated with longer term changes in BMD in postmenopausal women (8, 21, 22, 23, 24, 25, 26, 27). Thus, assuming that BTMs can be measured reliably and validly for an individual patient, short-term changes in these markers might be used to provide a more rapid assessment of patients’ response to therapy than is possible with BMD measurements. In addition, baseline levels of BTMs or other clinical factors that are associated with osteoporosis might be predictive of response to therapy.
The 1-yr randomized U.S. Fosamax Actonel Comparison Trial (FACT) (28) and its 1-yr extension (29) examined the effects of once-weekly bisphosphonate treatment of postmenopausal women with low baseline BMD. Both alendronate and risedronate significantly increased mean BMD and reduced levels of BTMs, with similar rates of adverse experiences.
In this post hoc analysis of combined treatment groups in the trial, we examined whether short-term changes in BTMs were associated with long-term changes in BMD. We analyzed the relationship between 3- and 6-month changes from baseline in bone formation and resorption markers and 2-yr changes in BMD measured at four sites. Additionally, we assessed whether changes from baseline in BTMs or baseline clinical characteristics relevant to osteoporosis could predict the percentage of BMD nonresponders.
Subjects and Methods
As previously described (29), the 833 participants enrolled in the 1-yr FACT extension were maintained on their original blinded treatment. Among them, 750 took study medication and had BMD measured during the trial extension. BMD was measured at the hip trochanter, lumbar spine, femoral neck, and total hip at 24 months by DXA using Hologic (Bedford, MA) or Lunar (Madison, WI) densitometers. Measurement of BMD phantoms by each DXA detected no significant machine drifts during the 2-yr study as determined by a central analysis facility. Bone turnover markers [urinary N-telopeptide of type 1 collagen (NTX), serum C-terminal telopeptide of type 1 collagen (CTX), serum bone-specific alkaline phosphatase (bone ALP), and serum N-terminal propeptide of type 1 procollagen (PINP)] were determined from fasting second-morning void urine or serum. Stored samples were analyzed by a central laboratory (Quest Diagnostics, Collegeville, PA). The interassay coefficients of variation for the BTMs were as follow: urinary NTX (Ortho-Clinical Diagnostics, Raritan, NJ), 5.5–8.2%; serum CTX (Elecsys 2010, Roche Diagnostics, Branchburg, NJ), 4.1–5.3%; serum bone ALP (Beckman Coulter, Fullerton, CA), 6.4–7.9%; and serum PINP (Orion Diagnostica, Espoo, Finland), 4.6% (30).
This post hoc analysis was performed in the pooled treatment groups from the 12-month FACT extension. For the percentage change from baseline in BMD, the data were carried forward for the missing values. Patients, who had taken at least one dose of study medication during the FACT extension (n = 750), were categorized according to apparent BMD response. For the purpose of this analysis, BMD “nonresponse” was defined as having any measured BMD loss (i.e. change from baseline <0%) at two or more of the four measured sites at 24 months, including the hip trochanter, total hip, femoral neck, and posterior-anterior spine skeletal sites. Conversely, BMD “response” was defined as having either no change or any measured gain in BMD (i.e. change from baseline ≥ 0%) at three or more measured sites at 24 months. The definitions of BMD nonresponse and response for this analysis were chosen after several definitions were considered (31). These definitions were selected because of their clinical acceptability and to maximize the number of nonresponders available for analysis. As a sensitivity analysis, we also defined “nonresponse” as a decrease in BMD by more than 3% at one of the four BMD sites at 24 months. Baseline characteristics were summarized for nonresponders and responders. Differences between baseline characteristics in the two groups were analyzed using t tests for continuous variables and χ2 tests for categorical variables. For the percentage change from baseline in BTMs, no data were carried forward. The analysis of the BTMs was performed in the per protocol population given the effect of medication noncompliance on BTMs. Per protocol subjects were not protocol violators and were 85% compliant (n = 337 alendronate, n = 333 risedronate).
We examined the relationships between 3- or 6-month percentage change from baseline in BTMs and 24-month percentage change from baseline in BMD (n = 670). The 24-month BMD change was summarized for each of the 3- or 6-month BTM tertile groups. To explore whether BMD percentage change from baseline was different among BTM-tertile groups, ANOVA with terms for treatment and tertile percentage change in BTM was applied. Furthermore, Tukey’s trend test was used to assess any trend in BMD change by the three tertiles of BTM change. Pearson correlation coefficients were calculated between the percentage change in BTM at 3 or 6 months and the percentage change in BMD at 24 months. The association of percentage BMD nonresponders at 24 months with tertile BTM change at 3 or 6 months was examined by the Cochran-Maentel-Haenszel test. As a secondary analysis, we assessed the relationship between change in BTMs and change in BMD and change in BTMs and BMD nonresponse rate in the subjects treated with alendronate and risedronate separately.
Logistic regression analysis was used to determine which factors might be independently associated with apparent BMD nonresponse at 24 months (n = 670). The factors included baseline characteristics and 3-month biomarker changes. Factors showing significant differences at the P ≤ 0.10 level in univariate analysis were candidate variables for stepwise multivariate logistic regression analysis. P ≤ 0.05 was the criterion for independent variables remaining in the model. The assessment of fit of the final logistic regression model was done by Hosmer-Lemeshow Goodness-of-Fit test and C statistics (C statistics ranging from 1 to 0, with 1 meaning perfect prediction of the model). All analyses were performed using SAS 8.2 software package (SAS Institute Inc., Cary NC).
Results
Patients
Overall, the women were a mean age of 64 yr, 95% Caucasian, and an average of 18 yr postmenopausal. Duration of bisphosphonate treatment was 23.8 ± 1.3 months (mean ± sd). Detailed descriptions of these patients have been published previously (28, 29).
2-yr BMD nonresponse and response to bisphosphonate therapy
A majority of the patients in the FACT trial had a positive BMD response to therapy. After 24 months of treatment, 85% of alendronate patients and 62% of risedronate patients were responders, and 15% of alendronate patients and 38% of risedronate patients were nonresponders. Among patients in the combined treatment group, 74% were responders and 26% were nonresponders. Importantly, adherence to therapy was similar between responders and nonresponders (98% for each). In addition, when “nonresponse” was defined as a decrease in 24-month BMD by more than 3% at one of the four measured sites, qualitatively similar results were found, where 88% of alendronate patients and 73% of risedronate patients were responders, and 12% of alendronate patients and 27% of risedronate patients were nonresponders.
Patient characteristics associated with BMD response or nonresponse
Baseline characteristics likely to be associated with bone health were compared between responders and nonresponders to explore their predictive value (Table 1). Age at menopause, family history of osteoporosis, baseline BMD at trochanter and lumbar spine, and baseline serum PINP were each found to differ significantly between the two groups, although, for the most part, the magnitude of difference tended to be quite small.
TABLE 1.
Baseline characteristics
| Baseline characteristics1 | Responders (n = 552) | Nonresponders (n = 198) | P value2 |
|---|---|---|---|
| Age (yr) | 64 (9) | 64 (10) | NS3 |
| Race (%) | |||
| Asian | 1.8 | 1.5 | NS |
| Black | 0.9 | 1.0 | |
| Hispanic American | 1.3 | 0 | |
| Native American | 0.7 | 0 | |
| Other | 0.4 | 0.5 | |
| White | 94.9 | 97.0 | |
| Body mass index (kg/m2) | 25 (5) | 25 (5) | NS |
| Age at menopause (yr) | 47 (7) | 45 (8) | 0.013 |
| Years since menopause | 17 (11) | 19 (12) | NS |
| Osteoporosis (%)4 | 61 | 58 | NS |
| Family history of osteoporosis (%) | 38 | 50 | 0.002 |
| Fracture history after age 45 (%) | 29 | 33 | NS |
| BMD (g/cm2) | |||
| Hip trochanter | 0.565 (0.08) | 0.588 (0.09) | 0.001 |
| Femoral neck | 0.648 (0.10) | 0.663 (0.10) | 0.06 |
| Total hip | 0.748 (0.09) | 0.757 (0.08) | NS |
| Lumbar spine | 0.824 (0.11) | 0.859 (0.14) | 0.002 |
| Bone turnover markers | |||
| Urine NTX/Cr (nmol/mmol) | 45 (21) | 44 (22) | NS |
| Serum CTX (pg/ml) | 412 (199) | 387 (184) | NS |
| Serum bone ALP (μg/liter) | 16 (6) | 15 (6) | NS |
| Serum PINP (μg/liter) | 56 (23) | 52 (21) | 0.04 |
| 25(OH) vitamin D (ng/ml) | 43 (14) | 45 (14) | 0.08 |
| Alcohol use (%) | |||
| ≤7 drinks/wk | 98 | 95 | NS |
| >7 drinks/wk | 2 | 5 | |
| Tobacco use (%) | |||
| Current users | 10 | 15 | NS |
| Ex-users | 33 | 35 | |
| Never | 57 | 50 |
Data represent mean (sd) unless otherwise indicated. Cr, Creatinine.
Combined treatment groups.
P values were generated from the t test for continuous variables and from χ2 test for categorical variables.
NS, Not significant (P < 0.10).
Osteoporosis defined as T-score ≤−2.5 at any site or fracture history of hip, spine, or wrist after age 45.
We next examined whether early BTM responses (measured as 3- or 6-month change from baseline and divided into tertiles) were related to BMD responses (measured as 24-month percentage change from baseline) in the combined treatment group. Significant associations were found between tertile reductions for each of the BTMs examined at 3 months and 24-month increases in BMD at each of the four sites measured (Fig. 1). The 3-month associations were examined further by calculation of Pearson correlation coefficients. Correlation coefficients ranged from −0.10 to −0.25 and were strongest for CTX (−0.19 to −0.25). Similar results were found at 6 months (data not shown).
Fig. 1.

Percentage change in BMD at 24 months over the 3-month tertiles of bone turnover markers in the combined treatment group. A, NTX; B, CTX; C, bone ALP; D, PINP.
To see whether early changes in BTMs were also related to BMD nonresponse, we examined the association between the reduction in BTMs (as measured in tertiles) and the percentage of BMD nonresponders at each measured site. For each of the BTMs, the smallest reduction in bone turnover (lowest tertile) at 3 months was associated with the greatest percentage of nonresponders. This association was statistically significant for CTX, bone ALP, and PINP; NTX trended in the same direction (Fig. 2A). At 6 months, the associations between tertile reduction in BTM and percentage of BMD nonresponders were significant (P < 0.001) for each BTM, including NTX (data not shown).
Fig. 2.
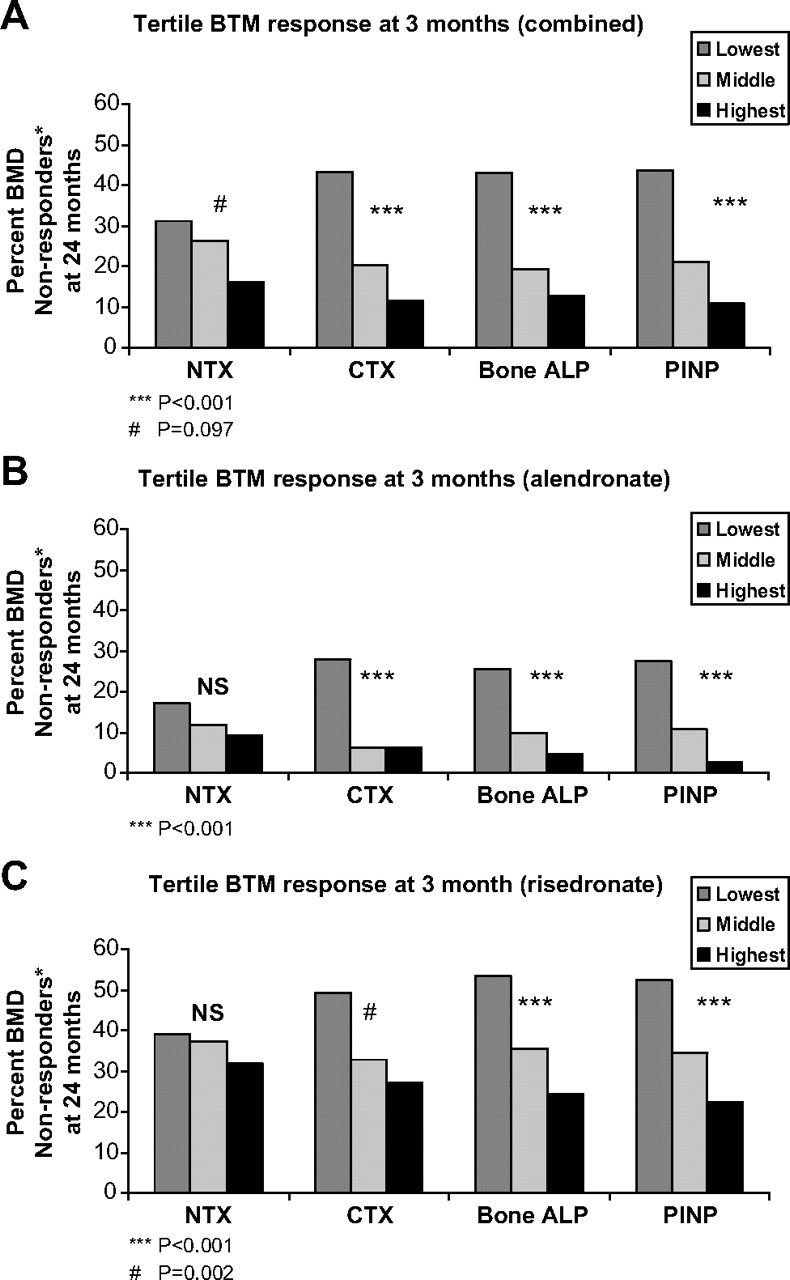
Percentage of BMD nonresponders at 24 months over the 3-month tertiles of bone turnover markers. A, Combined group; B, alendronate group; C, risedronate group. *, BMD nonresponders had BMD loss (change from baseline <0%) in at least two of the four measured sites.
We examined the associations between changes in BTMs and BMD for subjects treated with alendronate and risedronate separately. For both alendronate- and risedronate-treated subjects, greater BTM suppression was associated with increased BMD, although the changes observed with alendronate were somewhat greater than those observed with risedronate (data not shown). Similar to the combined group, the smallest reductions in CTX, bone ALP, and PINP were associated with the greatest percentage of nonresponders in both the alendronate and risedronate groups (Fig. 2, B and C, respectively). With respect to change in NTX predicting BMD nonresponse, the changes seen in the alendronate and risedronate groups were qualitatively similar to the other BTMs, although they did not reach statistical significance (Fig. 2, B and C, respectively).
Multivariable analysis
Multivariable analysis was performed to determine which of the baseline characteristics or 3-month BTM responses were independently associated with BMD nonresponse. Characteristics that showed a significant difference between the nonresponders and responders (P ≤ 0.1), in a univariable logistic regression analysis were further analyzed by stepwise multivariable logistic regression analysis. Clinical factors associated with a higher nonresponse rate (significant at the P ≤ 0.05 level) included: younger age at menopause, a positive family history of osteoporosis, higher baseline trochanteric BMD, and being in the lowest tertile for 3-month percentage reduction from baseline in PINP, bone ALP, and CTX (Fig. 3). With odds ratios of 2, 2.2, and 2.7, respectively, smaller decrements in PINP, bone ALP, and CTX at 3 months were the factors most strongly associated with BMD nonresponse at 24 months. Qualitatively similar results were found when “nonresponse” was defined as a decrease in 24-month BMD by more than 3% at one of the four measured sites. Multicollinearity among the three biomarkers in the final model was examined and found not to be a major issue.
Fig. 3.

The adjusted odds ratios and 95% confidence intervals for the factors independently associated with BMD nonresponse at 24 months. [BMD nonresponse equals any BMD loss (change from baseline <0%) in at least two of four measured sites.]
Discussion
Change in BMD is associated with fracture risk (12, 14, 15) and is used to measure the response to antiresorptive therapy in clinical practice. This post hoc analysis of a large clinical trial of once-weekly bisphosphonates evaluated possible surrogate markers that, early in treatment, would suggest nonresponse or response to antiresorptive therapy, as measured by BMD change. Of the postmenopausal women treated with either alendronate or risedronate once-weekly for 24 months, 24% of the subjects were “nonresponders” with evidence of BMD loss (<0% change in BMD) at two or more of the four measured sites, and 76% of the subjects were “responders” with stable or increased BMD (≥0% change in BMD) at in at least three of four sites. These definitions were chosen from several examined because they were consistent with clinical practice and provided a larger sample size of the nonresponder pool, allowing for statistical analysis (31).
Changes in BTMs at both 3 and 6 months were associated with changes in BMD at 24 months. The greatest reductions in BTMs, measured in tertiles, were associated with the greatest increases in BMD. For example, for tertile reductions from baseline in NTX at 3 months of more than 55%, 55 to 31%, and less than 31%, the mean increases from baseline in BMD at the lumbar spine after 2 yr were 5.4, 4.2, and 3.5%. Changes in BTMs were also associated with BMD nonresponse, such that there were fewer BMD nonresponders when there was greater reduction in BTMs. Three-month reduction in CTX, bone ALP, and PINP, as well as some baseline characteristics (family history of osteoporosis, younger age at the onset of menopause, and higher baseline trochanteric BMD) were the clinical factors found to be independently associated with 24-month BMD nonresponse in this analysis. However, the differences between responders and nonresponders in age of menopause and trochanteric BMD were small, and therefore these differences are of unclear clinical utility. The percentage of patients with a family history of osteoporosis did differ substantially between nonresponders and responders, although it is not known why women who might be genetically prone to osteoporosis would respond less well to antiresorptive therapy.
The association of bone turnover with changes in BMD is well documented (8, 21, 22, 23, 24, 25, 26, 27, 32). Many investigators have found baseline levels of BTMs to be associated with BMD change in both treated and untreated individuals with osteoporosis (24, 26, 27, 32, 33). However, the finding in the current analysis that baseline levels of BTMs were not independently associated with BMD response is in agreement with findings of others who did not detect an association between baseline BTM levels and fracture risk (34, 35, 36, 37).
This study has notable similarities and differences from prior reports of the relationship between change in BTMs and BMD with treatment. Although the findings of this study are consistent with those of Greenspan et al. (22, 23), it differs in the clinical characteristics of the study participants and the BTMs studied. The 120 postmenopausal women studied by Greenspan et al. were older (with mean age 70 ± 5 yr, vs. 64 ± 10 yr in this study); were not selected based on low BMD; and had higher mean urinary NTX at baseline. Thus, the women enrolled in this study are more representative of the typical postmenopausal woman with low BMD detected with DXA testing, who is then treated for osteoporosis. Additionally, we studied the bone formation marker PINP, which has been shown to be a strong predictor of posterior-anterior spine BMD response and decrease in fracture risk in other antiosteoporosis trials, both for the antiresorptive drug raloxifene (38) and the anabolic drug teriparatide (39). Notably, however, CTX appeared to be as predictive of BMD response as PINP. This study assessed the change in BTMs and BMD in postmenopausal women treated with alendronate and risedronate in a head-to-head trial and found that early changes in BTMs predicted 24-month change in BMD for both medications. Finally, this study describes those baseline characteristics that might predict whether a postmenopausal woman will be a BMD nonresponder to weekly bisphosphonate treatment.
Regarding factors that predicted BMD nonresponse, it was surprising that younger age of menopause and a positive family history of osteoporosis were associated with lack of BMD response with therapy on multivariate analysis. A priori, we would have assumed that a family history of osteoporosis would have been associated with lower BMD, possibly due to low peak bone mass, and that earlier age of menopause would be associated with lower BMD or increased bone resorption (40, 41, 42); thus patients with these risk factors would be anticipated to have a greater likelihood of responding to treatment with bisphosphonate therapy. It is possible that having a positive family history of osteoporosis confers a microarchitectural defect or some other alteration in bone quality that results in lack of BMD change with weekly bisphosphonate treatment. However, further investigation of this hypothesis is needed.
This analysis has some limitations. This is a post hoc analysis, and as such, the results from the analyses should be interpreted with caution. Additionally, the duration of the study was short, and the sample size was too small to assess the relationship between change in BTMs and fractures, the main endpoint of interest for clinicians. As reflected in the multivariable analysis, family history of osteoporosis, age at menopause, and initial BMD also predict BMD nonresponse with bisphosphonate therapy. Thus, change in BTMs alone may not be the sole predictor of BMD response to therapy. Some investigators question the value of BMD as a surrogate marker, suggesting that the magnitude of gain in BMD is not directly related to the magnitude of reduction in fracture risk (16). However, there is general consensus that BMD gain or maintenance is preferable to BMD loss or nonresponse (16, 17). Furthermore, when the definition of nonresponse was changed in the sensitivity analysis to a measure recommended by the International Society of Clinical Densitometry (a change of >3%, exceeding the least significant change), qualitatively similar results were found. Finally, it is important to note that the associations of changes in BTMs with changes in BMD in the current analysis are for groups of women and may not be applicable to an individual patient. In the clinic, the acquisition of accurate, reproducible measurements of BTMs is not foolproof, although the analytic precision of the assays is good (43).
In summary, we found that approximately one fourth of the women examined in this 2-yr trial were BMD nonresponders after 24 months of bisphosphonate therapy. The best predictor of BMD nonresponse was a smaller reduction in bone turnover markers after 3 months of therapy. Some baseline factors were also associated with BMD nonresponse: baseline hip trochanteric BMD, family history of osteoporosis, and earlier age of menopause, although the associations were less strong than those of the early changes in BTMs. Future directions may include genomic testing to identify nonresponders. At present, patients who do not demonstrate either an increase in BMD or a decrease in BTMs when treated with once-weekly oral bisphosphonates should be monitored closely because they may be at greater risk of fracture. Enhanced knowledge of the relationship between BTMs, BMD, and fracture risk reduction is essential for both clinical trials and clinical care of patients with osteoporosis.
Footnotes
This paper was funded by a grant from Merck & Co., Inc.
Clinical trial registration no. NCT00092014.
Disclosure Summary: S.M.B. and S.L.G. have nothing to declare. K.S. has received research grants, honoraria, and consulting fees from Merck & Co., Inc. A.S. has received honoraria and consulting fees from Merck & Co., Inc. A.E.d.P., E.C., and E.R. are employees of Merck & Co., Inc, the sponsor of the study.
First Published Online January 13, 2009
Abbreviations: BMD, Bone mineral density; bone ALP, bone-specific alkaline phosphatase; BTM, bone turnover marker; CTX, serum C-terminal telopeptide of type 1 collagen; DXA, dual-energy x-ray absorptiometry; NTX, urinary N-telopeptide of type 1 collagen; PINP, N-terminal propeptide of type 1 procollagen.
References
- 1.2007 National Osteoporosis Foundation web site. http://www.nof.org/advocacy/prevalence/indication
- 2.Bjarnason NH, Christiansen C 2000. Early response in biochemical markers predicts long-term response in bone mass during hormone replacement therapy in early postmenopausal women. Bone 26:561–569 [DOI] [PubMed] [Google Scholar]
- 3.Black DM, Cummings SR, Karpf DB, Cauley JA, Thompson DE, Nevitt MC, Bauer DC, Genant HK, Haskell WL, Marcus R, Ott SM, Torner JC, Quandt SA, Reiss TF, Ensrud KE 1996. Randomised trial of effect of alendronate on risk of fracture in women with existing vertebral fractures. Fracture Intervention Trial Research Group. Lancet 348:1535–1541 [DOI] [PubMed] [Google Scholar]
- 4.Delmas PD, Hardy P, Garnero P, Dain M 2000. Monitoring individual response to hormone replacement therapy with bone markers. Bone 26:553–560 [DOI] [PubMed] [Google Scholar]
- 5.Ettinger B, Black DM, Mitlak BH, Knickerbocker RK, Nickelsen T, Genant HK, Christiansen C, Delmas PD, Zanchetta JR, Stakkestad J, Gluer CC, Krueger K, Cohen FJ, Eckert S, Ensrud KE, Avioli LV, Lips P, Cummings SR 1999. Reduction of vertebral fracture risk in postmenopausal women with osteoporosis treated with raloxifene: results from a 3-year randomized clinical trial. Multiple Outcomes of Raloxifene Evaluation (MORE) Investigators. JAMA 282:637–645 [DOI] [PubMed] [Google Scholar]
- 6.Harris ST, Watts NB, Genant HK, McKeever CD, Hangartner T, Keller M, Chesnut III CH, Brown J, Eriksen EF, Hoseyni MS, Axelrod DW, Miller PD 1999. Effects of risedronate treatment on vertebral and nonvertebral fractures in women with postmenopausal osteoporosis: a randomized controlled trial. Vertebral Efficacy With Risedronate Therapy (VERT) Study Group. JAMA 282:1344–1352 [DOI] [PubMed] [Google Scholar]
- 7.Liberman UA, Weiss SR, Broll J, Minne HW, Quan H, Bell NH, Rodriguez-Portales J, Downs Jr RW, Dequeker J, Favus M 1995. Effect of oral alendronate on bone mineral density and the incidence of fractures in postmenopausal osteoporosis. The Alendronate Phase III Osteoporosis Treatment Study Group. N Engl J Med 333:1437–1443 [DOI] [PubMed] [Google Scholar]
- 8.Ravn P, Clemmesen B, Christiansen C 1999. Biochemical markers can predict the response in bone mass during alendronate treatment in early postmenopausal women. Alendronate Osteoporosis Prevention Study Group. Bone 24:237–244 [DOI] [PubMed] [Google Scholar]
- 9.Reginster J, Minne HW, Sorensen OH, Hooper M, Roux C, Brandi ML, Lund B, Ethgen D, Pack S, Roumagnac I, Eastell R 2000. Randomized trial of the effects of risedronate on vertebral fractures in women with established postmenopausal osteoporosis. Vertebral Efficacy with Risedronate Therapy (VERT) Study Group. Osteoporos Int 11:83–91 [DOI] [PubMed] [Google Scholar]
- 10.Hochberg MC, Greenspan S, Wasnich RD, Miller P, Thompson DE, Ross PD 2002. Changes in bone density and turnover explain the reductions in incidence of nonvertebral fractures that occur during treatment with antiresorptive agents. J Clin Endocrinol Metab 87:1586–1592 [DOI] [PubMed] [Google Scholar]
- 11.Bjarnason NH, Sarkar S, Duong T, Mitlak B, Delmas PD, Christiansen C 2001. Six and twelve-month changes in bone turnover are related to reduction in vertebral fracture risk during 3 years of raloxifene treatment in postmenopausal osteoporosis. Osteoporos Int 12:922–930 [DOI] [PubMed] [Google Scholar]
- 12.Eastell R, Barton I, Hannon RA, Chines A, Garnero P, Delmas PD 2003. Relationship of early changes in bone resorption to the reduction in fracture risk with risedronate. J Bone Miner Res 18:1051–1056 [DOI] [PubMed] [Google Scholar]
- 13.Sarkar S, Reginster JY, Crans GG, Diez-Perez A, Pinette KV, Delmas PD 2004. Relationship between changes in biochemical markers of bone turnover and BMD to predict vertebral fracture risk. J Bone Miner Res 19:394–401 [DOI] [PubMed] [Google Scholar]
- 14.Hochberg MC, Ross PD, Black D, Cummings SR, Genant HK, Nevitt MC, Barrett-Connor E, Musliner T, Thompson D 1999. Larger increases in bone mineral density during alendronate therapy are associated with a lower risk of new vertebral fractures in women with postmenopausal osteoporosis. Fracture Intervention Trial Research Group. Arthritis Rheum 42:1246–1254 [DOI] [PubMed] [Google Scholar]
- 15.Wasnich RD, Miller PD 2000. Antifracture efficacy of antiresorptive agents are related to changes in bone density. J Clin Endocrinol Metab 85:231–236 [DOI] [PubMed] [Google Scholar]
- 16.Watts NB, Cooper C, Lindsay R, Eastell R, Manhart MD, Barton IP, van Staa TP, Adachi JD 2004. Relationship between changes in bone mineral density and vertebral fracture risk associated with risedronate: greater increases in bone mineral density do not relate to greater decreases in fracture risk. J Clin Densitom 7:255–261 [DOI] [PubMed] [Google Scholar]
- 17.Sebba AI, Bonnick SL, Kagan R, Thompson DE, Skalky CS, Chen E, de Papp AE 2004. Response to therapy with once-weekly alendronate 70 mg compared to once-weekly risedronate 35 mg in the treatment of postmenopausal osteoporosis. Curr Med Res Opin 20:2031–2041 [DOI] [PubMed] [Google Scholar]
- 18.2007 International Society of Clinical Densitometry web site. http://www.iscd.org
- 19.Cummings SR, Palermo L, Browner W, Marcus R, Wallace R, Pearson J, Blackwell T, Eckert S, Black D 2000. Monitoring osteoporosis therapy with bone densitometry: misleading changes and regression to the mean. Fracture Intervention Trial Research Group. JAMA 283:1318–1321 [DOI] [PubMed] [Google Scholar]
- 20.Delmas PD, Eastell R, Garnero P, Seibel MJ, Stepan J 2000. The use of biochemical markers of bone turnover in osteoporosis. Committee of Scientific Advisors of the International Osteoporosis Foundation. Osteoporos Int 11(Suppl 6):S2–S17 [DOI] [PubMed]
- 21.Greenspan SL, Resnick NM, Parker RA 2005. Early changes in biochemical markers of bone turnover are associated with long-term changes in bone mineral density in elderly women on alendronate, hormone replacement therapy, or combination therapy: a three-year, double-blind, placebo-controlled, randomized clinical trial. J Clin Endocrinol Metab 90:2762–2767 [DOI] [PubMed] [Google Scholar]
- 22.Greenspan SL, Parker RA, Ferguson L, Rosen HN, Maitland-Ramsey L, Karpf DB 1998. Early changes in biochemical markers of bone turnover predict the long-term response to alendronate therapy in representative elderly women: a randomized clinical trial. J Bone Miner Res 13:1431–1438 [DOI] [PubMed] [Google Scholar]
- 23.Greenspan SL, Rosen HN, Parker RA 2000. Early changes in serum N-telopeptide and C-telopeptide cross-linked collagen type 1 predict long-term response to alendronate therapy in elderly women. J Clin Endocrinol Metab 85:3537–3540 [DOI] [PubMed] [Google Scholar]
- 24.Chesnut III CH, Bell NH, Clark GS, Drinkwater BL, English SC, Johnson Jr CC, Notelovitz M, Rosen C, Cain DF, Flessland KA, Mallinak NJ 1997. Hormone replacement therapy in postmenopausal women: urinary N-telopeptide of type I collagen monitors therapeutic effect and predicts response of bone mineral density. Am J Med 102:29–37 [DOI] [PubMed] [Google Scholar]
- 25.Ravn P, Christensen JO, Baumann M, Clemmesen B 1998. Changes in biochemical markers and bone mass after withdrawal of ibandronate treatment: prediction of bone mass changes during treatment. Bone 22:559–564 [DOI] [PubMed] [Google Scholar]
- 26.Rosen CJ, Chesnut III CH, Mallinak NJ 1997. The predictive value of biochemical markers of bone turnover for bone mineral density in early postmenopausal women treated with hormone replacement or calcium supplementation. J Clin Endocrinol Metab 82:1904–1910 [DOI] [PubMed] [Google Scholar]
- 27.Bauer DC, Garnero P, Bilezikian JP, Greenspan SL, Ensrud KE, Rosen CJ, Palermo L, Black DM 2006. Short-term changes in bone turnover markers and bone mineral density response to parathyroid hormone in postmenopausal women with osteoporosis. J Clin Endocrinol Metab 91:1370–1375 [DOI] [PubMed] [Google Scholar]
- 28.Rosen CJ, Hochberg MC, Bonnick SL, McClung M, Miller P, Broy S, Kagan R, Chen E, Petruschke RA, Thompson DE, de Papp AE 2005. Treatment with once-weekly alendronate 70 mg compared with once-weekly risedronate 35 mg in women with postmenopausal osteoporosis: a randomized double-blind study. J Bone Miner Res 20:141–151 [DOI] [PubMed] [Google Scholar]
- 29.Bonnick S, Saag KG, Kiel DP, McClung M, Hochberg M, Burnett SA, Sebba A, Kagan R, Chen E, Thompson DE, de Papp AE 2006. Comparison of weekly treatment of postmenopausal osteoporosis with alendronate versus risedronate over two years. J Clin Endocrinol Metab 91:2631–2637 [DOI] [PubMed] [Google Scholar]
- 30.de Papp AE, Bone HG, Caulfield MP, Kagan R, Buinewicz A, Chen E, Rosenberg E, Reitz RE 2007. A cross-sectional study of bone turnover markers in healthy premenopausal women. Bone 40:1222–1230 [DOI] [PubMed] [Google Scholar]
- 31.Saag K, Sebba A, Bonnick S, Rosenberg E, Chen E, de Papp AE, Baseline characteristics of non-responders to bisphosphonate therapy in the FACT Study. Proc of the Annual Conference of the International Society of Clinical Densitometry, Pueblo, CO, February 1, 2006. (Abstract 212) Available at: http://www.iscd.org/Visitors/pdfs/SecB-06Poster_000.pdf
- 32.Garnero P, Hausherr E, Chapuy MC, Marcelli C, Grandjean H, Muller C, Cormier C, Breart G, Meunier PJ, Delmas PD 1996. Markers of bone resorption predict hip fracture in elderly women: the EPIDOS Prospective Study. J Bone Miner Res 11:1531–1538 [DOI] [PubMed] [Google Scholar]
- 33.Bauer DC, Garnero P, Hochberg MC, Santora A, Delmas P, Ewing SK, Black DM 2006. Pretreatment levels of bone turnover and the antifracture efficacy of alendronate: the fracture intervention trial. J Bone Miner Res 21:292–299 [DOI] [PubMed] [Google Scholar]
- 34.Adachi JD 1996. The correlation of bone mineral density and biochemical markers to fracture risk. Calcif Tissue Int 59(Suppl 1):16–19 [DOI] [PubMed]
- 35.Akesson K, Ljunghall S, Jonsson B, Sernbo I, Johnell O, Gardsell P, Obrant KJ 1995. Assessment of biochemical markers of bone metabolism in relation to the occurrence of fracture: a retrospective and prospective population-based study of women. J Bone Miner Res 10:1823–1829 [DOI] [PubMed] [Google Scholar]
- 36.Melton III LJ, Crowson CS, O'Fallon WM, Wahner HW, Riggs BL 2003. Relative contributions of bone density, bone turnover, and clinical risk factors to long-term fracture prediction. J Bone Miner Res 18:312–318 [DOI] [PubMed] [Google Scholar]
- 37.Bauer DC, Sklarin PM, Stone KL, Black DM, Nevitt MC, Ensrud KE, Arnaud CD, Genant HK, Garnero P, Delmas PD, Lawaetz H, Cummings SR 1999. Biochemical markers of bone turnover and prediction of hip bone loss in older women: the study of osteoporotic fractures. J Bone Miner Res 14:1404–1410 [DOI] [PubMed] [Google Scholar]
- 38.Reginster JY, Sarkar S, Zegels B, Henrotin Y, Bruyere O, Agnusdei D, Collette J 2004. Reduction in PINP, a marker of bone metabolism, with raloxifene treatment and its relationship with vertebral fracture risk. Bone 34:344–351 [DOI] [PubMed] [Google Scholar]
- 39.Chen P, Satterwhite JH, Licata AA, Lewiecki EM, Sipos AA, Misurski DM, Wagman RB 2005. Early changes in biochemical markers of bone formation predict BMD response to teriparatide in postmenopausal women with osteoporosis. J Bone Miner Res 20:962–970 [DOI] [PubMed] [Google Scholar]
- 40.Armamento-Villareal R, Villareal DT, Avioli LV, Civitelli R 1992. Estrogen status and heredity are major determinants of premenopausal bone mass. J Clin Invest 90:2464–2471 [DOI] [PMC free article] [PubMed] [Google Scholar]
- 41.Seeman E, Hopper JL, Bach LA, Cooper ME, Parkinson E, McKay J, Jerums G 1989. Reduced bone mass in daughters of women with osteoporosis. N Engl J Med 320:554–558 [DOI] [PubMed] [Google Scholar]
- 42.Pouilles JM, Tremollieres F, Bonneu M, Ribot C 1994. Influence of early age at menopause on vertebral bone mass. J Bone Miner Res 9:311–315 [DOI] [PubMed] [Google Scholar]
- 43.Hannon R, Eastell R 2000. Preanalytical variability of biochemical markers of bone turnover. Osteoporos Int 11(Suppl 6):S30–S44 [DOI] [PubMed]