Abstract
Context: There has not been a comprehensive compilation of data regarding the epidemiology of all endocrine and metabolic disorders in the United States.
Evidence Acquisition: We included 54 disorders with clinical and public health significance. We identified population-based studies that provided U.S. prevalence and/or incidence data by searching PubMed in December 2007 for English-language reports, hand-searching reference lists of six textbooks of endocrinology, obtaining additional resources from identified experts in each subspecialty, and searching epidemiological databases and web sites of relevant organizations. When available, we selected articles with data from 1998 or later. Otherwise, we selected the article with the most recent data, broadest geographical coverage, and most stratifications by sex, ethnicity, and/or age. Ultimately, we abstracted data from 70 articles and 40 cohorts.
Evidence Synthesis: Endocrine disorders with U.S. prevalence estimates of at least 5% in adults included diabetes mellitus, impaired fasting glucose, impaired glucose tolerance, obesity, metabolic syndrome, osteoporosis, osteopenia, mild-moderate hypovitaminosis D, erectile dysfunction, dyslipidemia, and thyroiditis. Erectile dysfunction and osteopenia/osteoporosis had the highest incidence in males and females, respectively. The least prevalent conditions, affecting less than 1% of the U.S. population, were diabetes mellitus in children and pituitary adenoma. Conditions with the lowest incidence were adrenocortical carcinoma, pheochromocytoma, and pituitary adenomas. Certain disorders, such as hyperparathyroidism and thyroid disorders, were more common in females. As expected, the prevalence of diabetes mellitus was highest among ethnic minorities. Sparse data were available on pituitary, adrenal, and gonadal disorders.
Conclusions: The current review shows high prevalence and incidence of common endocrine and metabolic disorders. Defining the epidemiology of these conditions will provide clues to risk factors and identify areas to allocate public health and research resources.
The Endocrinology and Metabolism Epidemiology Database provides epidemiological trends to show clues to environmental predispositions and the underlying causes of diseases in the United States.
Endocrine and metabolic diseases are among the most common contemporary human afflictions, particularly in the United States and other countries with generous nutrition and screening programs for high-risk individuals. The prevalence and incidence of certain disorders, such as diabetes and obesity, have been well defined in large population-based studies (1, 2, 3, 4). There has, however, been no comprehensive survey and compilation of data regarding the epidemiology of endocrine and metabolic disorders to serve as a unified source of information about these conditions. The same is true of most other subspecialties of medicine, with the exception of oncological diseases (5).
It is crucial to define the epidemiology of both common and unusual endocrine and metabolic diseases for several reasons. Documenting the overall disease burden (prevalence) and risk of disease development (incidence) and the distribution of endocrine and metabolic disorders in population subgroups should 1) provide critical information for the appreciation of the societal burden of these conditions; 2) guide public health interventions; 3) establish research priorities; and 4) aid in the appropriate allocation of health care dollars. Furthermore, detailed information regarding the burden and distribution of endocrine disorders should help define current and future endocrine workforce requirements and shape strategies for their effective use (6).
Recognizing the need for a comprehensive epidemiological review of endocrine and metabolic disorders, The Endocrine Society provided support for this survey and summary of the medical literature describing U.S. population-based data on the prevalence and incidence of these conditions.
Materials and Methods
Selection of conditions
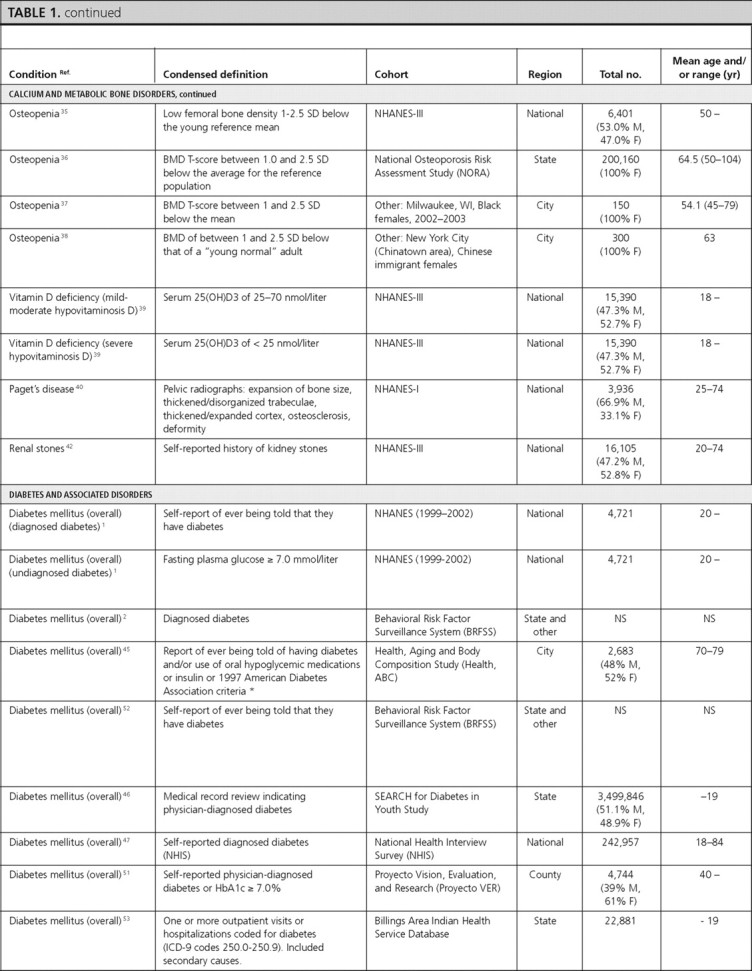
Initially, 72 disorders and conditions were enumerated, from which we selected key conditions representing classical hormonal disorders cared for by endocrinologists (i.e. adrenal, thyroid, and pituitary disorders), conditions with clinical and public health importance cared for by endocrinologists and primary care providers (i.e. diabetes mellitus, obesity, osteoporosis, erectile dysfunction), and conditions with available diagnostic testing and/or therapy. We selected 54 disorders to include in this review (supplemental Table 1, published as supplemental data on The Endocrine Society’s Journals Online web site at http://jcem.endojournals.org).
Identification of evidence
Existing databases
We first identified existing epidemiological databases with potentially relevant prevalence and/or incidence data to avoid retrieval of duplicate data sets. We generated a list of online databases and web sites of relevant organizations (n = 20) and reviewed each of these sources for existing data (supplemental Table 2). Although many web sites reported prevalence and/or incidence data for endocrine disorders, the sources from which data were generated were not indicated. We therefore chose to identify original articles to allow a complete description of the populations used to generate data.
Systematic review—pilot test
We developed a comprehensive literature search strategy for each of the 54 selected conditions. Given the large number of conditions and the expected large volume of information to screen and abstract, we developed a pilot test of the systematic review process. Through searches of PubMed (December 4, 2007), we sought English-language reports of population-based studies that provided prevalence and/or incidence data for a U.S. population. The strategy combined controlled vocabulary terms and text words for the individual conditions and for “prevalence” and “incidence.” We selected four conditions for the pilot study: growth hormone (GH) deficiency, hypercortisolism, polycystic ovarian disease/syndrome, and osteopenia. The search for these conditions yielded fewer than 1000 PubMed entries each. The 1453 unique citations were imported into a database maintained in reference management software (ProCite; Thomson Corporation, Stamford, CT). Each article was independently screened for eligibility by two reviewers, first using title and abstract, and subsequently using full text. Disagreements concerning eligibility were resolved by consensus. Five reviewers were involved in the abstract-screening process. Inter-reviewer agreement was 95%, with κ statistic = 0.42 [95% confidence interval (CI) 0.31–0.53] (where 0.41–0.60 = “moderate agreement,” 0.61–0.80 = “substantial agreement,” and 0.81–1.0 = “almost perfect agreement”). We excluded citations from further consideration if they met any of the following criteria: 1) were presented solely in abstract form; 2) provided no original data (e.g. review, commentary); 3) did not contain information about prevalence or incidence; 4) did not study a U.S. population; 5) did not address endocrine or metabolic disorders; 6) addressed endocrine or metabolic disorder not in our list; 7) were not population-based studies or population-based screening studies; or 8) used symptomatic or clinic populations.
Articles that were deemed either eligible or had unclear eligibility at the abstract screening stage were selected for full-text screening (n = 41). Overall, of 1453 abstracts screened, 10 (0.7% yield) articles were determined to be eligible. Using this pilot data, we projected that this strategy would result in 19,600 potentially relevant titles, requiring approximately 135 wk to complete systematic reviews for all 54 conditions with a low yield of eligible citations. Consequently, we abandoned the systematic review strategy and developed a targeted strategy involving expert informers and handsearching.
Expert informers and handsearching
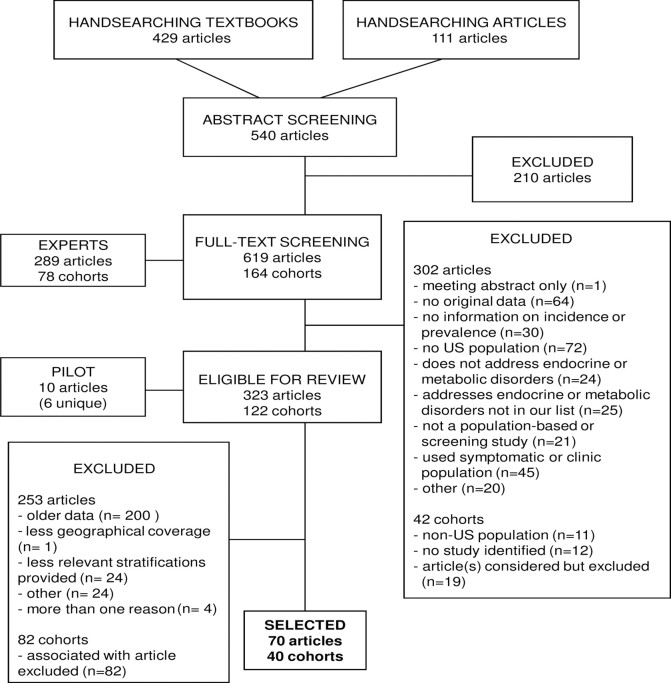
We initially identified and contacted 38 domain experts. These individuals were asked to provide a list of relevant articles and were also asked to provide names of other experts who could offer additional leads. We were directed to an additional 75 experts, for a total 113 experts (see Acknowledgments). Fifty percent of contacted experts contributed. A total of 289 articles and 78 cohorts were suggested. All articles identified by the experts were screened at the full-text level using the same eligibility criteria as outlined for the pilot systematic review (Fig. 1).
Fig. 1.
Summary of searching, screening, and selection process.
We also completed handsearching of six textbooks in endocrinology (7, 8, 9, 10, 11, 12), identifying 429 citations whose abstracts were screened to determine eligibility. Additional citations (n = 111) identified from the reference lists of selected articles were also screened at the abstract level. Finally, for each condition where no eligible articles had been identified by the experts or through handsearching (n = 15), we completed specific searches in PubMed and identified 682 citations.
To avoid double counting of multiple published studies from the same cohort, we developed a cohort-based system for identifying and abstracting information. If there were multiple articles for a condition, we selected articles with the most recent data, defined as reporting data from 1998 or after. If no article reported data from 1998 or after, we selected the article with the most recent data, broadest geographical coverage, and most relevant stratifications (i.e. sex, ethnicity, and age). We did not, however, select older articles that reported stratified data if a more recent article reported nonstratified estimates. Articles were not selected based on how the conditions were defined. Our goal was to select at least one article describing prevalence and/or incidence for each condition on our list.
From all sources, we identified a total of 2268 citations describing data from 164 separate study populations. At the full-text level, we excluded 302 of 619 articles. The primary reason for excluding articles from further consideration was that they addressed non-U.S. populations (n = 72), they contained no original data (n = 64), or they were based on symptomatic or clinic populations (n = 45). After the screening process, there were 323 eligible articles describing data from 122 cohorts. After linking these articles with their cohorts, we applied the selection criteria specified above. The most frequent reasons for exclusion of articles were because they contained older data (n = 200) and because they provided less relevant stratifications (n = 24) compared with articles that were included. Eighty-two cohorts were automatically excluded because their associated article was excluded. Finally, we completed data abstraction for 70 articles reporting data on 39 conditions from 40 separate cohorts (supplemental Table 3).
Results
Search results
Because we selected studies with the most current data, 54 of the 70 articles summarized in this review were published in 2000 or later. Of the 70 articles reviewed, 51% (36 articles) reported data from eight major U.S. population-based studies: the Rochester Epidemiology Project (Olmsted County, MN; n = 9), the Third National Health and Nutrition Examination Survey III (NHANES-III; n = 6), later NHANES surveys (continuous NHANES 1999+; n = 8), the Behavior Risk Factor Surveillance System (BRFSS; n = 4), the Surveillance, Epidemiology, and End Results Program (SEER; n = 3), the Pittsburgh Diabetes Mellitus Study (n = 2), the SEARCH for Diabetes in Youth Study (n = 2), and the Nurses’ Health Study (n = 2).
Of the 70 articles meeting our inclusion criteria, 42 contained recent prevalence data for the following categories of endocrine disorders: hypothalamic-pituitary disorders (n = 2), thyroid disorders (n = 3), female and male endocrine disorders (n = 4), calcium and metabolic bone disorders (n = 7), diabetes mellitus and associated conditions (n = 22), dyslipidemias (n = 3), and obesity (n = 3). Some articles provided data on multiple conditions. We did not identify any articles summarizing the prevalence of adrenal disorders and other endocrine tumors (islet cell and carcinoid tumors).
Thirty-one of our 70 articles contained incidence (risk) data for the following categories of endocrine disorders: hypothalamic-pituitary disorders (n = 1), thyroid disorders (n = 7), adrenal disorders (n = 2), female and male endocrine disorders (n = 2), calcium and metabolic bone disorders (n = 5), carcinoid tumors (n = 1), and diabetes mellitus and associated conditions (n = 13). We did not identify articles that contained incidence data for dyslipidemias and obesity.
Article characteristics
Among the 70 articles, U.S. data were primarily presented at the national level (n = 22), followed by state (n = 9), county (n = 10), city (n = 13), multiple levels (n = 10), and other/not specified (n = 6). Fifty-three percent of articles reported receiving study funding through the National Institutes of Health or the Centers for Disease Control; however, the source of funding was unspecified for 31% of the articles.
Summary of prevalence and incidence by category of endocrine disorders
Wherever available, we report prevalence and incidence estimates for the overall population, as well as estimates stratified by sex, ethnicity [non-Hispanic whites (Whites), non-Hispanic Blacks (Blacks), Hispanics, Native Americans, and Asian Americans (Asians)], and/or age. Unless otherwise stated, we have reported crude estimates. Where possible, we have provided 95% CI for estimates and P values for differences in estimates.
Hypothalamic-pituitary disorders
We found one article reporting the prevalence of GH deficiency and one reporting the prevalence and incidence of all pituitary tumors. We did not find articles with estimates of prevalence or incidence data for diabetes insipidus, hypogonadotropic hypogonadism, or specific subcategories of pituitary tumors (i.e. nonsecretory and secretory).
GH deficiency.
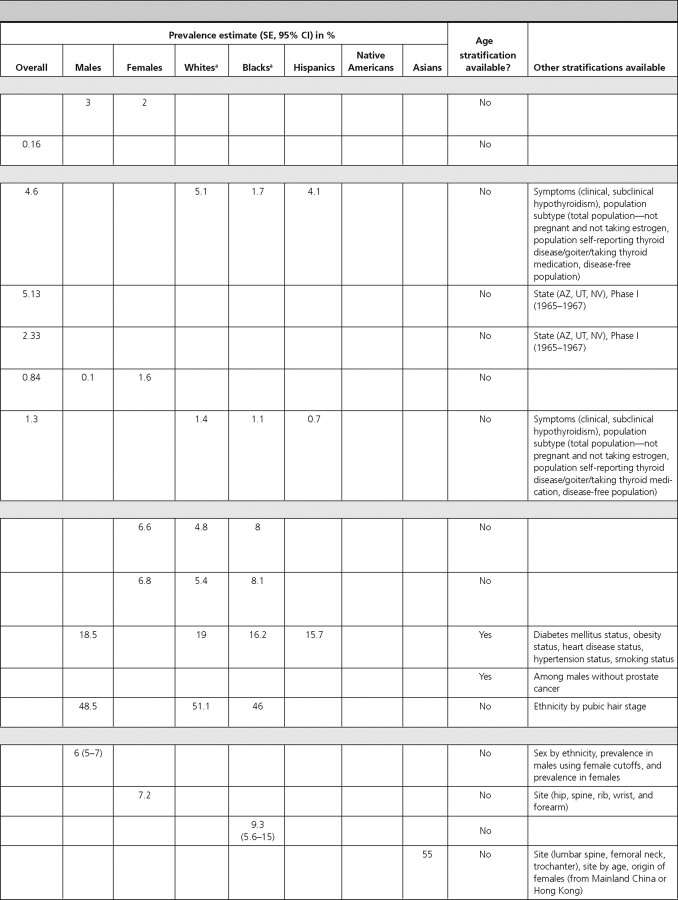
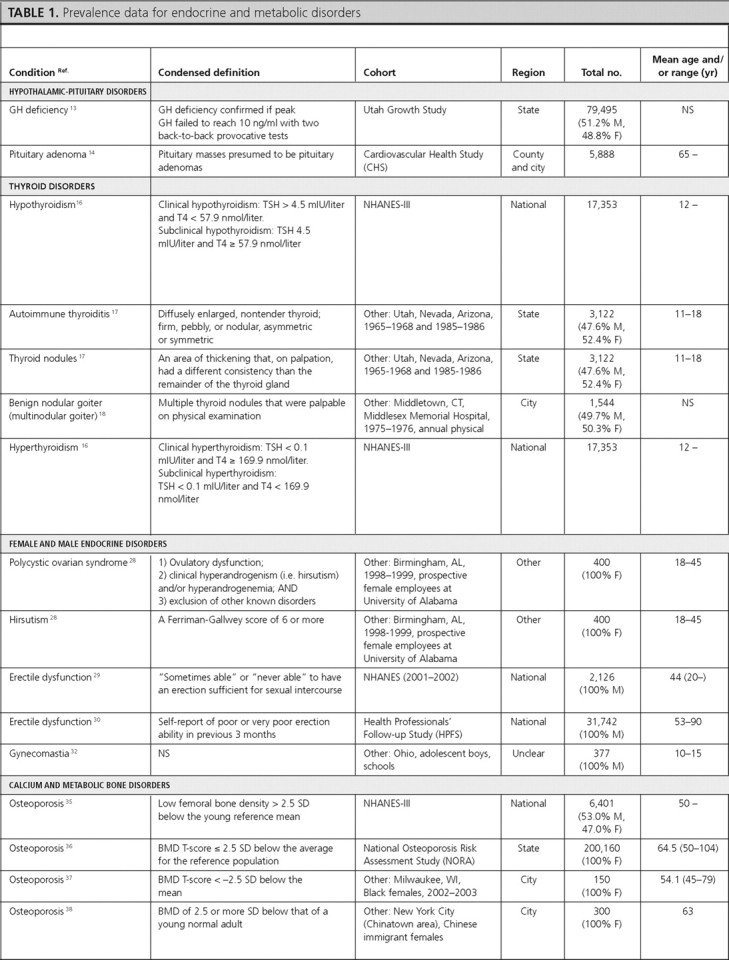
The prevalence of GH deficiency was 2% in females and 3% in males in the Utah Growth Study (13) (Table 1). We did not identify articles reporting the incidence of GH deficiency.
Fig. 2.
Pituitary tumors.
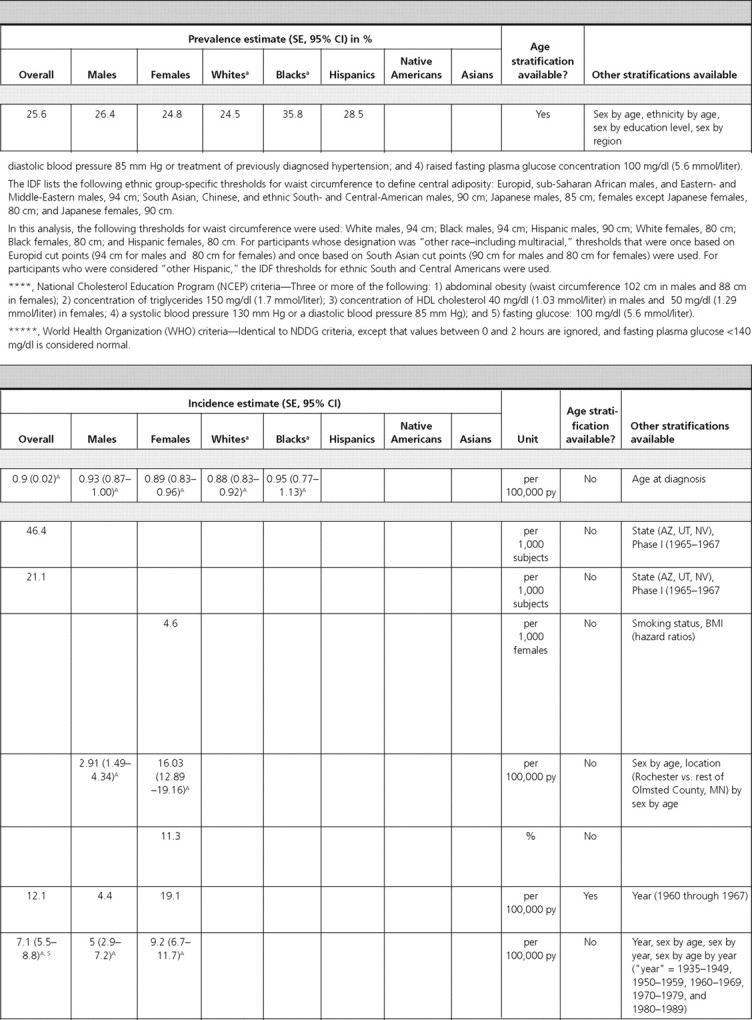
In the Cardiovascular Health Study, the prevalence of pituitary tumors in elderly adults (≥65 yr of age) was 0.16% (14). Data from the Central Brain Tumor Registry of the United States found the overall age-adjusted incidence of pituitary tumors to be 0.9 per 100,000 person-years (py). Incidence rates were similar for Blacks, Whites, and both sexes (15) (Table 2).
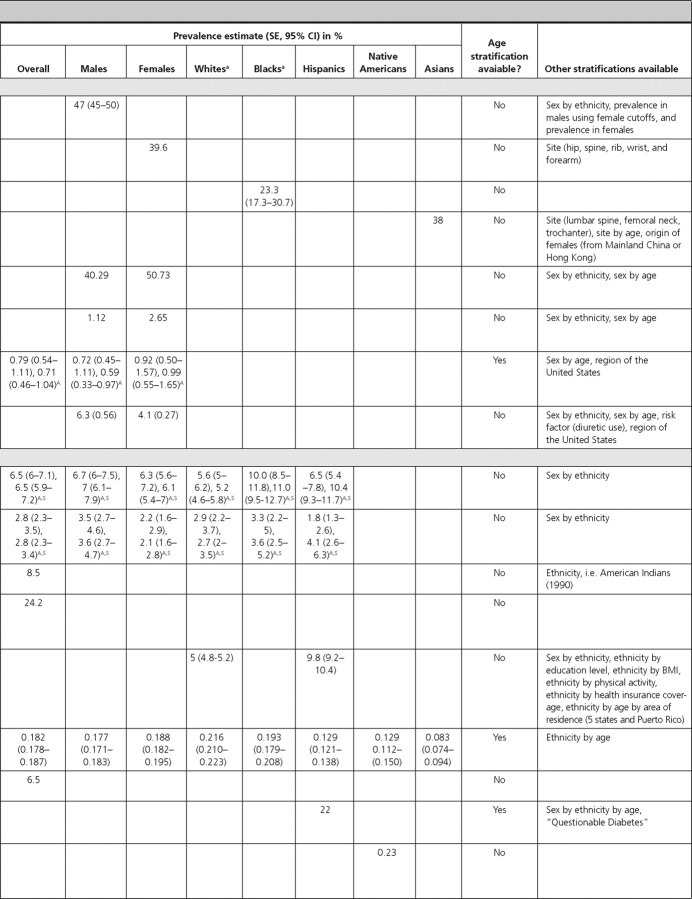
Fig. 3.
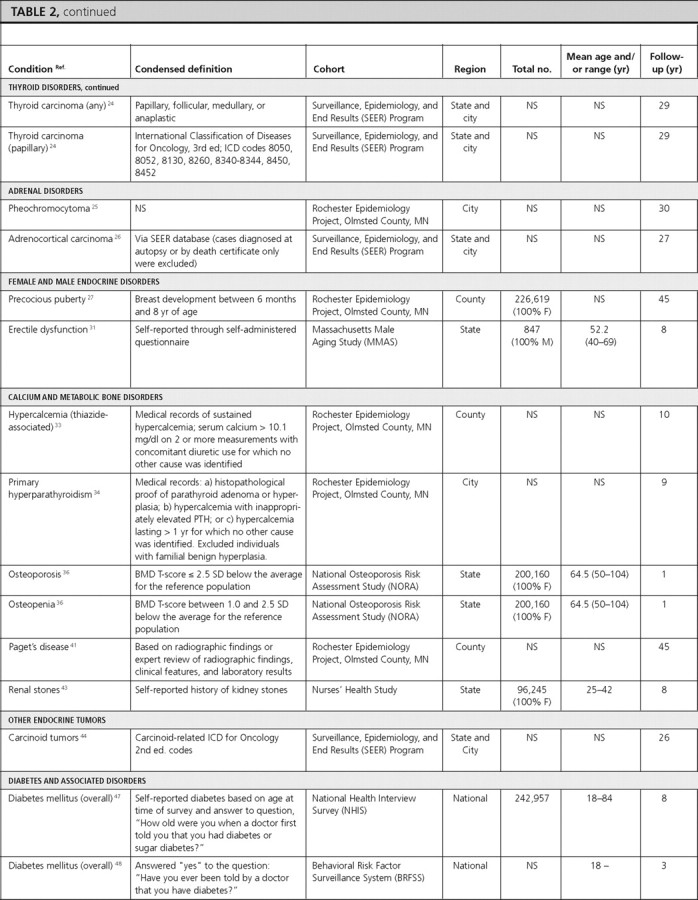
Thyroid disorders
There were three articles reporting the prevalence of thyroid disorders (hypothyroidism, autoimmune thyroiditis, thyroid nodules, benign nodular goiter, and hyperthyroidism) and seven articles reporting the incidence of various thyroid disorders (autoimmune thyroiditis, thyroid nodules, hypothyroidism, Graves’ ophthalmopathy, lymphocytic/postpartum thyroiditis, granulomatous/subacute thyroiditis, and thyroid cancer).
Hypothyroidism.
In NHANES-III individuals (≥12 yr of age), the overall prevalence of hypothyroidism was 4.6%. Although the prevalence in Whites, Hispanics, and other ethnicities was similar to the overall prevalence, the prevalence in Blacks was lower at 1.7% (16). We did not find population-based data on hypothyroidism incidence.
Autoimmune thyroiditis.
In a population-based study including participants from Utah, Nevada, and Arizona, the overall prevalence of thyroiditis was 5.13%; and in that same study, the overall incidence of thyroiditis was 46.4 per 1000 subjects during 20 yr (17).
Thyroid nodules.
The above article also reported a prevalence of palpable thyroid nodularity of 2.33% and an incidence of 21.1 per 1000 subjects during 20 yr (17).
Benign nodular goiter.
In a population-based study in Connecticut, the overall prevalence of multinodular goiter was 0.84%, with a higher prevalence in females (1.6%) compared with males (0.1%) (18). We did not find data on the incidence of benign nodular goiter.
Hyperthyroidism.
In NHANES-III individuals (≥12 yr of age), the overall prevalence of hyperthyroidism was 1.3%, with the lowest prevalence among Hispanics and other ethnicities (0.7% each) and highest among Whites (1.4%) (16). In the Nurses’ Health Study, the overall incidence of hyperthyroid Graves’ disease was 4.6 per 1000 females during 12 yr (19). We did not find comparable incidence data for males.
Graves’ ophthalmopathy.
In the Rochester Epidemiology Project, the age-adjusted incidence of Graves’ ophthalmopathy was more than five times greater in White females (16 per 100,000 py) than males (2.9 per 100,000 py) (standardized rate ratio = 5.5; 95% CI, 3.3–9.3) (20). This article also included data stratified by age-sex subgroups. We did not find prevalence data for this condition.
Lymphocytic (postpartum) thyroiditis.
In a group of women in the immediate postpartum stage in a Marshfield, Wisconsin, clinic, the incidence of postpartum thyroiditis was reported to be 11.3% during 1.5 months (21).
Subacute (granulomatous) thyroiditis.
The Rochester Epidemiology Project also reported data on the incidence of subacute thyroiditis, which was 12.1 per 100,000 py, and higher in females (19.1 per 100,000 py) than in males (4.4 per 100,000 py) (22). The incidence of subacute thyroiditis was highest in young adulthood (24 per 100,000 py for ages 30–40 yr) and middle age (35 per 100,000 py for ages 40–50 yr), declining with increasing age (22).
Thyroid cancer.
Two articles reported the overall incidence of thyroid cancer, which was 7.1 per 100,000 py during 10 yr in the Rochester Epidemiology Project (23) and 8.7 per 100,000 py during 29 yr in SEER, a population-based study that included participants from Connecticut, Hawaii, Iowa, New Mexico, and Utah (24). In the Rochester Epidemiology Project, there was a higher incidence in females (9.2 per 100,000 py) compared with males (5 per 100,000 py) during 10 yr from 1990 to 1999 (23).
Adrenal disorders
We found one article each that reported the incidence of pheochromocytoma and adrenocortical carcinoma; however, there were no articles that reported the prevalence of these conditions. We did not identify U.S. population-based studies reporting the prevalence of aldosteronoma, hypercortisolism, adrenal insufficiency, or adrenal mass.
Pheochromocytoma.
In the Rochester Epidemiology Project, the overall incidence of pheochromocytoma was 0.8 per 100,000 py during 30 yr in Whites (25).
Adrenocortical carcinoma.
The overall age-adjusted incidence of adrenocortical carcinoma using data from the SEER Program was reported as 0.72 per million individuals during 27 yr (26).
Female and male endocrine disorders
There were four articles that reported the prevalence of female and male endocrine disorders (polycystic ovarian disease, hirsutism, erectile dysfunction, gynecomastia) and two articles reporting the incidence of these disorders (precocious puberty and erectile dysfunction). We were unable to identify U.S. population-based data on the prevalence and incidence of delayed puberty, hypogonadism, or infertility for either sex.
Precocious puberty.
In the Rochester Epidemiology Project, the incidence of precocious puberty in females was reported as 3.5 per 100,000 py during 45 yr (27). We did not identify comparable information for males or data on the prevalence of this disorder.
Polycystic ovarian disease/syndrome (PCOS).
In a study of prospective employees of the University of Alabama, the overall prevalence of PCOS was 6.6%, being higher in Black (8.0%) compared with White (4.8%) females (difference not statistically significant, P > 0.05) (28). We did not identify data on the incidence of PCOS.
Hirsutism.
The above article reporting the prevalence of PCOS also determined the prevalence of hirsutism, which was 6.8%, being higher in Blacks (8.1%) compared with Whites (5.4%) (P > 0.05) (28).
Erectile dysfunction.
Two articles reported prevalence and one article reported incidence of erectile dysfunction. Among NHANES (2001–2002) males, the overall prevalence of erectile dysfunction was 18.5% (29). Prevalence was higher in Whites (19.0%) compared with Blacks (16.2%) and Hispanics (15.7%) (differences not statistically significant, P > 0.05). The prevalence increased with age, peaking at 77.6% among males 75 yr of age or older (29). In the Health Professionals’ Follow-Up Study, the age-adjusted prevalence of erectile dysfunction in males without prostate cancer was 33% (30). The prevalence increased with age, from 10% in males 53–59 yr of age to 60% in males 80–90 yr of age (30). In the Massachusetts Male Aging Study, the incidence of erectile dysfunction was reported as 2,590 per 100,000 py during 8 yr, and as expected, it increased with age, being 1,240 per 100,000 py in males ages 40–50 yr and 4,640 per 100,000 py in males ages 60–70 yr (31).
Gynecomastia.
In a study of adolescent males in Ohio schools, the overall prevalence of gynecomastia was 48.5% and was slightly higher in Whites (51.1%) compared with Blacks (46.0%) (statistical information not provided) (32). We did not find data on the incidence of gynecomastia.
Calcium and metabolic bone disorders
There were seven articles reporting prevalence data for calcium and metabolic bone disorders (osteoporosis, osteopenia, vitamin D deficiency, Paget’s disease, renal stones) and five articles reporting incidence of calcium and metabolic bone disorders (hypercalcemia, primary hyperparathyroidism, osteoporosis, osteopenia, Paget’s disease, renal stones). We did not find U.S. population-based studies that reported prevalence or incidence data for hypoparathyroidism.
Hypercalcemia.
In the Rochester Epidemiology Project, the age- and sex-adjusted incidence of thiazide-induced hypercalcemia was 7.7 per 100,000 py during 10 yr, with a statistically significantly higher incidence among females (13.5 per 100,000 py; 95% CI, 10.3–16.8) compared with males (0.9 per 100,000 py; 95% CI, 0.0–1.8; P < 0.001) (33). The incidence increased with age, reaching a peak of 33.8 per 100,000 py at ages 70–80 yr (33).
Primary hyperparathyroidism.
Also in the Rochester Epidemiology Project, the age- and sex-adjusted incidence of primary hyperparathyroidism was 21.6 per 100,000 py during 9 yr in Whites, with a twice higher incidence in females (28.4 per 100,000 py) compared with males (13.8 per 100,000 py) (34). The incidence increased with age, reaching a peak of 63.2 per 100,000 py at ages 65–74 yr (34).
Osteoporosis and osteopenia.
Four articles reported the prevalence of osteoporosis and osteopenia and one article reported their incidence. Among males (≥50 yr old) in NHANES-III, the prevalence (using male cutoffs) of osteoporosis and osteopenia was 6 and 47%, respectively (35). For both osteoporosis and osteopenia, White males had the highest prevalence (7 and 48%, respectively). In the National Osteoporosis Risk Assessment Study, the prevalence of osteoporosis and osteopenia in females (≥50 yr old), was 7.2 and 39.6%, respectively (36). Among Black females (≥45 yr old) in Milwaukee, Wisconsin, the prevalence of osteoporosis and osteopenia was 9.3 and 23.3%, respectively (37). Prevalence estimates were highest in Chinese immigrant females (mean age = 63 yr) in New York, which reported an osteoporosis prevalence of 55% and osteopenia prevalence of 38% (38).
The incidence of osteoporosis and osteopenia was reported from the National Osteoporosis Risk Assessment Study (females ≥50 yr old) as 3,470 per 100,000 py and 1,550 per 100,000 py during 1 yr, respectively (36).
Vitamin D deficiency.
Among adults from NHANES-III, the prevalence of mild-moderate vitamin D deficiency (serum 25-hydroxy-vitamin D of 25–70 nmol/liter or 10–28 ng/ml) was 40.3% in males and 50.7% in females, and the prevalence of severe vitamin D deficiency (serum 25-hydroxy-vitamin D of <25 nmol/liter or <10 ng/ml) was 1.12% in males and 2.65% in females (39). In both sexes and for both degrees of severity of vitamin D deficiency, Whites had the lowest prevalence and Blacks had the highest (39). We did not identify any population-based study on the incidence of vitamin D deficiency.
Paget’s disease.
One article reported the prevalence and one reported the incidence of Paget’s disease. In NHANES-I, the overall prevalence of Paget’s disease in adults was 0.79%. The prevalence was similar in males (0.72%) and females (0.92%) and increased with age, reaching a peak prevalence of 1.9% in individuals 65–74 yr of age (40). In the Rochester Epidemiology Project, the age- and sex-adjusted incidence of Paget’s disease was 9.2 per 100,000 py during 45 yr in Whites, with a significantly higher incidence in males (12.7 per 100,000 py; 95% CI, 10.4–14.9) compared with females (7.0 per 100,000 py; 95% CI, 5.6–8.3; P < 0.001) (41). The incidence increased with age and was highest, at 71.7 per 100,000 py, in those of age 85 yr or older (41).
Renal stones.
One article each reported the prevalence and incidence of renal stones. In adults from NHANES-III, the prevalence of renal stones was reported as 6.3% in males and 4.1% in females (42). In the Nurses’ Health Study, the incidence of renal stones was 206, 170, 156, and 198 per 100,000 py during 8 yr in individuals 27–34, 35–39, 40–44, and 44 yr of age or older, respectively (43).
Other endocrine tumors
We did not identify articles reporting the prevalence or incidence of islet cell tumors (i.e. gastrinomas, insulinomas, VIPomas, nonfunctioning neuroendocrine tumors). There was one article from the SEER Program database that reported the incidence of carcinoid tumors by sex-ethnicity subgroups, which was slightly higher among Blacks—3.98, 4.48, 2.58, and 2.47 per 100,000 py during 26 yr among Black females, Black males, White females, and White males, respectively [statistical information not provided (44)].
Diabetes and associated conditions
There were 22 articles reporting prevalence estimates for diabetes and its associated conditions (diabetes overall, type 1 diabetes only, type 2 diabetes only, diabetic retinopathy, diabetic nephropathy, diabetic neuropathy, gestational diabetes, impaired fasting glucose, impaired glucose tolerance, and metabolic syndrome) and 13 articles reporting incidence data (diabetes overall, type 1 diabetes only, type 2 diabetes only, diabetic retinopathy, diabetic nephropathy, diabetic neuropathy, and impaired glucose tolerance).
Diabetes overall.
There were eight articles that reported diabetes prevalence and three articles that reported diabetes incidence in U.S. population-based studies but did not specify type 1 or type 2 diabetes.
Prevalence and incidence in total U.S. population.
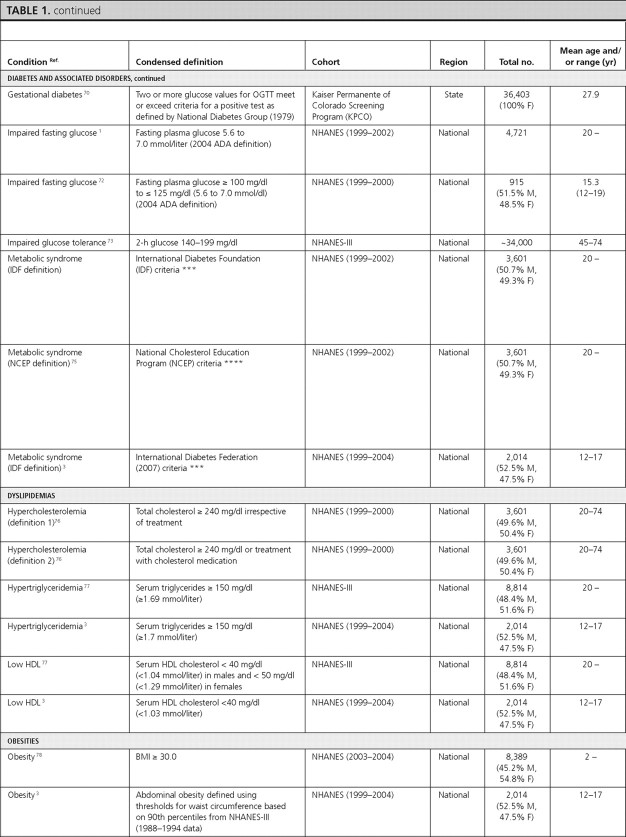
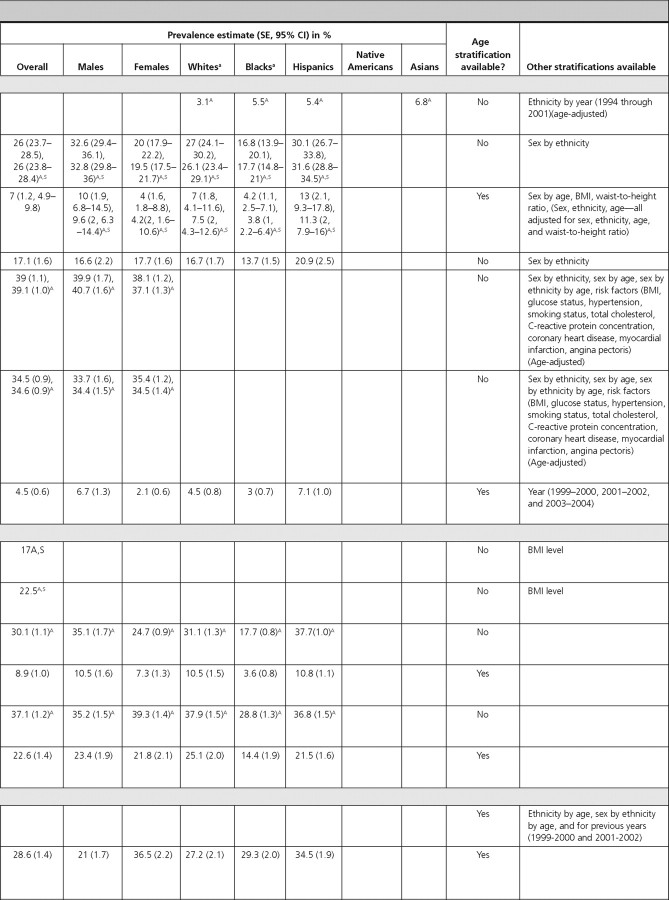
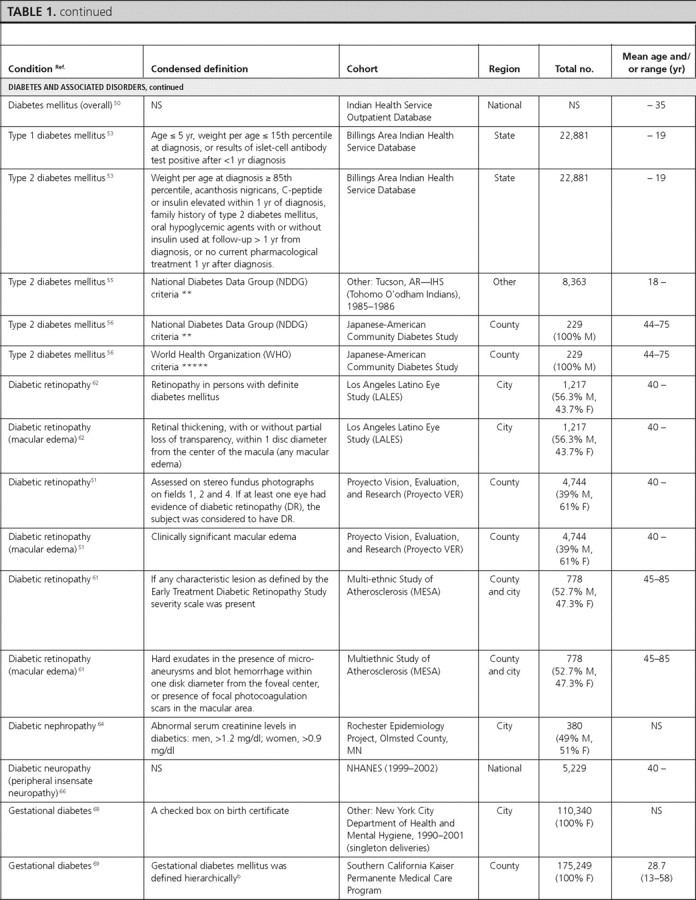
In NHANES (1999–2002), the overall prevalence of diagnosed and undiagnosed diabetes mellitus in adults over 20 yr of age was 6.5 and 2.8%, respectively (1). Similar estimates were obtained from the BRFSS, where the overall prevalence of self-reported diagnosed diabetes was 8.5% (2). In the Health, Aging, and Body Composition Study, a cohort study of elderly individuals at least 70 yr of age, the prevalence of diagnosed diabetes was 24.2% (45). In the SEARCH for Diabetes In Youth Study, the prevalence estimate among children 19 yr of age or younger was 0.18% (46).
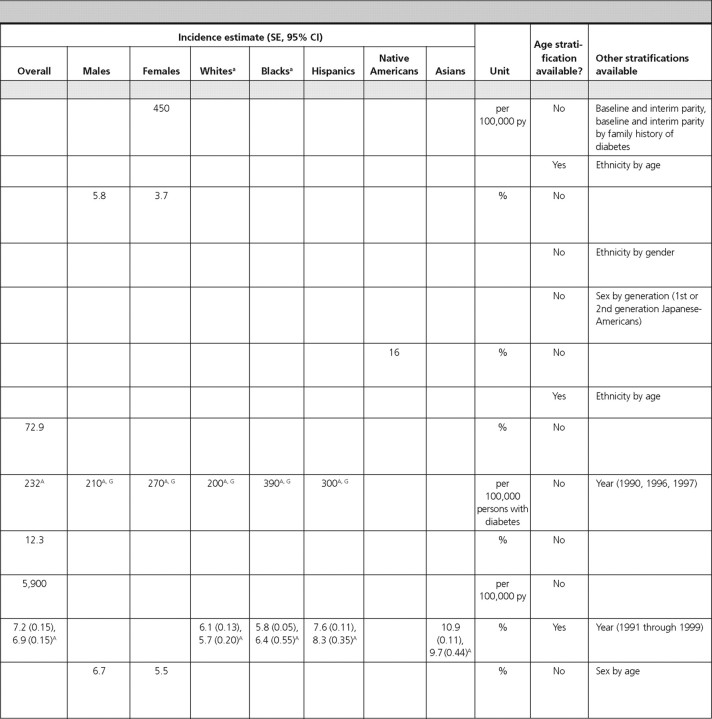
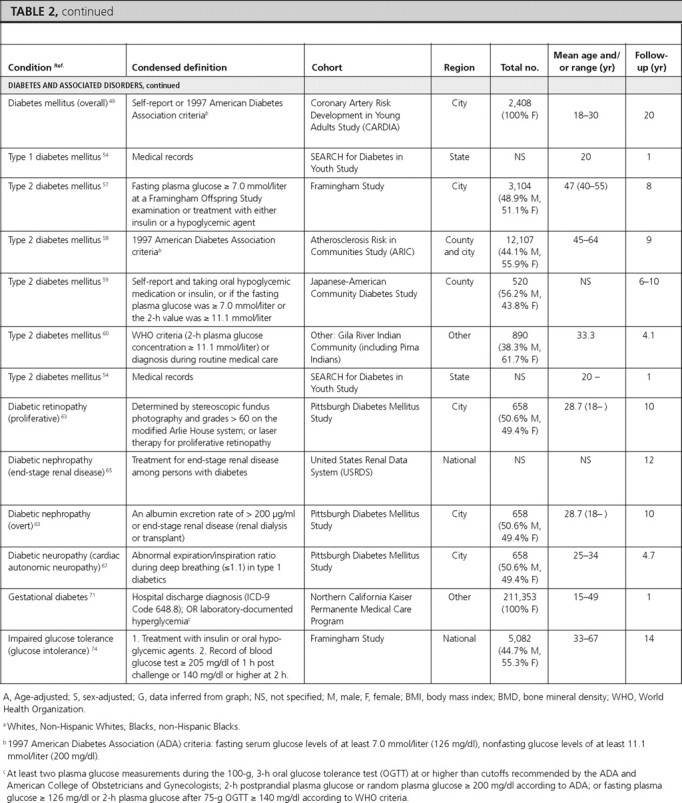
The incidence of diabetes among adults was 6.6 per 1000 participants during 8 yr using data from the National Health Interview Survey (47) and 9.0 per 1000 participants during 3 yr using data from the BRFSS (48). In the Coronary Artery Risk Development in Young Adults (CARDIA) Study, the incidence of diabetes among young adult females was 450 per 100,000 py during 20 yr (49).
Prevalence by sex.
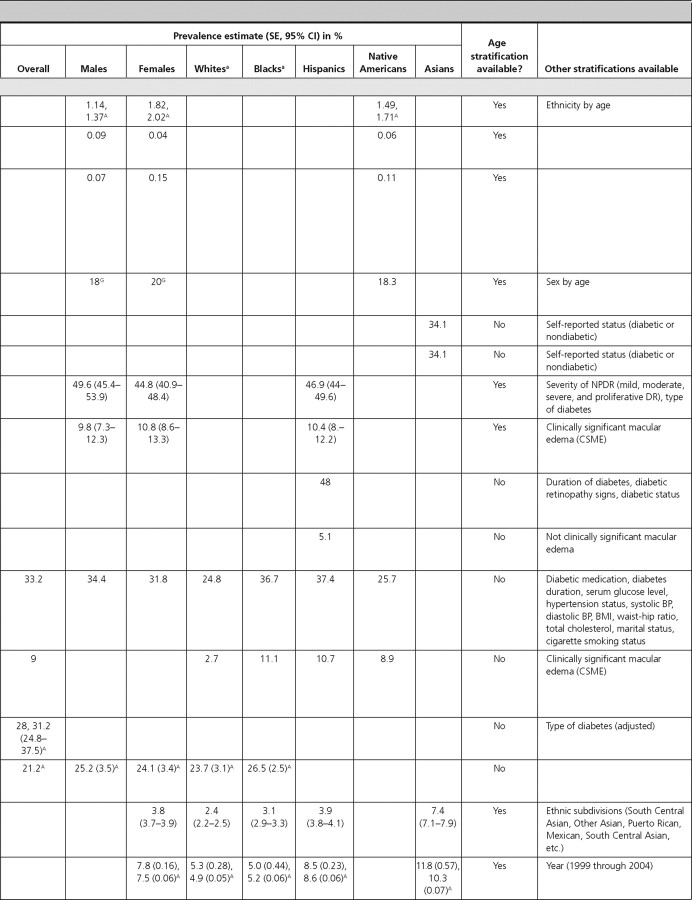
Three articles included data on diabetes prevalence by sex, which was similar for males and females (1, 46, 50). In NHANES (1999–2002), the prevalence of diagnosed diabetes in adults over 20 yr of age was 6.3% for females and 6.7% for males, and the prevalence of undiagnosed diabetes was 2.2% for females and 3.5% for males (1). In the SEARCH Study, the prevalence of diabetes in females and males under the age of 19 yr was 0.19 and 0.18%, respectively (46). In a population-based study that only included Native Americans up to 35 yr of age, the prevalence of diabetes was 1.82% in females and 1.14% in males (50).
Prevalence by age.
Three articles reported data on the prevalence of diabetes, which increased with age in children (46), young adult Native Americans (50), and middle and older age Hispanic adults (51).
Prevalence in Whites.
Three articles reported the prevalence of diabetes in Whites in the United States. In adults from NHANES (1999–2002) (1) and from the BRFSS (52), the prevalence of diagnosed diabetes was approximately 5%, and the prevalence of undiagnosed diabetes was 2.9% (1). The prevalence was similar after adjustment for the age and sex distribution of the population. In White children from the SEARCH study, the prevalence of diabetes was 0.22% (46).
Prevalence in Black Americans.
Among Black adults, the prevalence of diagnosed and undiagnosed diabetes was 10.0 and 3.3%, respectively (NHANES 1999–2002) (1). Among Black children, the prevalence of diabetes was 0.19% in the SEARCH Study (46).
Prevalence in Hispanic-Americans.
Among Hispanic adults in the United States, the prevalence of diagnosed diabetes was estimated to range from 6.5 to 22% in three population-based studies (1, 51, 52). In NHANES (1999–2002), the prevalence of undiagnosed diabetes was 1.8% (1). The prevalence among Hispanic children in the SEARCH Study was 0.13% (46).
Prevalence in Native Americans.
Prevalence estimates of diabetes in Native Americans was reported from two articles using data from the Indian Health Service (IHS) as 0.23% for children under age 19 (Billings Area IHS Database) (53) and 1.49% for individuals under age 35 (IHS Outpatient Database) (50). The latter estimate was similar after age adjustment. Among Native American children in the SEARCH study, the prevalence of diabetes was estimated to be 0.13% (46).
Prevalence in Asian Americans.
In the SEARCH Study, the prevalence of diabetes in Asian children was reported to be 0.08% (46).
Type 1 diabetes mellitus.
We identified one article that reported the overall prevalence of type 1 diabetes in Native American children in the Billings Area IHS Database, which was estimated to be 0.06% (53). In that article, the prevalence was slightly higher in males (0.09%) compared with females (0.04%) (statistical information not provided) (53). The incidence estimates of type 1 diabetes, reported by age in the SEARCH Study, were 14.3, 22.1, 25.9, and 13.1 per 100,000 py during 1 yr for children aged 4 yr or younger, 5–9, 10–14, and 15–19 yr, respectively, indicating a peak in mid-to-late childhood and early adolescence (54).
Type 2 diabetes mellitus.
Two articles reported the prevalence of type 2 diabetes in Native Americans, and one article reported its prevalence in Japanese-Americans. One article reported its prevalence in Native American adults (among Tohomo O'odham Indians) to be 18.3%, with a slightly higher prevalence in females (20%) compared with males (18%) (statistical information not provided). The prevalence was reported to increase with age in both males and females, peaking in the age-group of 60–79 yr in both sexes (55). The prevalence of type 2 diabetes in Native American children in the Billings Area IHS Database was 0.11%, also with a slightly higher prevalence in females (0.15%) compared with males (0.07%) (statistical information not provided) (53). Among Japanese-American adults aged 44–75 yr, the prevalence of type 2 diabetes was reported to be 34.1% when using either the World Health Organization definition or the National Diabetes Data Group definition (56).
Five articles reported incidence of type 2 diabetes mellitus. Among adults (40–55 yr old) from the Framingham study, the incidence of type 2 diabetes mellitus was reported to be 5.8% in males and 3.7% in females during 8 yr (57). In the Atherosclerosis Risk in Communities Study, Black females had the highest incidence of type 2 diabetes mellitus [2,510 per 100,000 py during 9 yr (58)]. Among second (Nisei) and third (Sansei)-generation Japanese-Americans in King County, Washington, Nisei females had the highest incidence of type 2 diabetes mellitus (19.2% during 6 yr) (59). In Native American adults from the Gila River Indian Community, the incidence of type 2 diabetes was 16% during 4.1 yr (60). Among children, the SEARCH Study reported incidence of type 2 diabetes of 0, 0.8, 8.1, and 11.8 per 100,000 py during 1 yr for children aged 4 yr or younger, 5–9, 10–14, and 15–19 yr, respectively, showing an increasing incidence with age (54).
Diabetic retinopathy.
There were three articles reporting the prevalence of diabetic retinopathy. The overall prevalence of retinopathy among persons with diabetes in the Multi-Ethnic Study of Atherosclerosis (MESA) was 33.2%, with males having a slightly higher prevalence (34.4%) than females (31.8%) (P = 0.42). Hispanics (37.4%) and Blacks (36.7%) had the highest prevalence, whereas Whites had the lowest prevalence (24.8%) (statistical information not provided) (61). The other two studies reported even higher prevalence estimates in Hispanics: 46.9% in the Los Angeles Latino Eye Study (62), and 48% in the Proyecto Vision, Evaluation, and Research Study (51). The prevalence of diabetic retinopathy was similar among males and females and was highest in individuals aged 70–80 yr in the Los Angeles Latino Eye Study (51). These three articles also reported the prevalence of macular edema, which was 9.0% in the overall population, and 10.4% and 5.1% among Hispanics in the Los Angeles Latino Eye Study (62) and the Proyecto Vision, Evaluation, and Research Study (51), respectively. The prevalence was similar among males and females, highest (10.8 to 11.8%) in middle-age individuals, and lowest (3.3%) in individuals more than 80 yr of age (62).
One article (from the Pittsburgh Diabetes Mellitus Study) reported incidence of proliferative diabetic retinopathy of 72.9% during 10 yr among individuals with type 1 diabetes (63).
Diabetic nephropathy.
We found one article (from the Rochester Epidemiology Project) that estimated the prevalence of diabetic nephropathy as 28.0% (64). Two articles reported the incidence of diabetic nephropathy. The United States Renal Data System article reported an age-adjusted incidence of 232 per 100,000 persons with diabetes during 12 yr, with a higher incidence in females (270 per 100,000 persons with diabetes) compared with males (210 per 100,000 persons with diabetes) (65). Blacks, followed by Hispanics, and Whites had the highest incidence (390, 300, and 200 per 100,000 persons with diabetes, respectively). The rate was reported to increase with age, with the highest incidence reported among 65–74 yr olds (405 per 100,000 persons with diabetes) (65). In the Pittsburgh Diabetes Mellitus Study, the incidence of diabetic nephropathy among individuals with type 2 diabetes was 12.3% during 10 yr (63).
Diabetic neuropathy.
In NHANES (1999–2002) adults at least 40 yr of age, the age-adjusted prevalence of peripheral insensate neuropathy was 21.2%, with similar prevalence by sex (25.2% in males and 24.1% in females) and ethnicity (23.7% in Whites and 26.5% in Blacks) (66). In the Pittsburgh Diabetes Mellitus Study, the incidence of cardiac autonomic neuropathy in type 1 diabetic individuals was estimated as 5,900 per 100,000 py during 4.7 yr (67).
Gestational diabetes.
Three articles reported the prevalence of gestational diabetes, and one article reported its incidence. The overall prevalence of gestational diabetes was estimated as 3.8% among pregnant females in the New York City Department of Health and Mental Hygiene database (68) and as 7.8% among pregnant females enrolled in the South California Kaiser Permanente Medical Care Program (69). In both of these studies, the prevalence of gestational diabetes increased with increasing age. All three articles reported the prevalence by ethnicity and found that the prevalence was consistently highest among Asian females (68, 69, 70).
Among females enrolled in the Northern California Kaiser Permanente Medical Care Program, the incidence of gestational diabetes was reported as 7.2% during 1 yr. The incidence over 1 yr was highest among Asian females (10.9%) and lowest among Black (5.8%) and White females (6.1%) and increased with increasing age (2.7% among ages 15–24 vs. 13.3% among ages 35–49) (71).
Impaired fasting glucose.
Two articles reported the prevalence of impaired fasting glucose using recent NHANES data. Among adults, the overall prevalence of impaired fasting glucose was 26% and was higher among males (32.6%) compared with females (20.0%) (statistical information not provided) (NHANES 1999–2002) (1). Hispanic individuals had a similar prevalence (30.1%; 95% CI, 26.7–33.8) to Whites (27.0%; 95% CI, 24.1–30.2) and higher prevalence than Blacks (16.8%; 95% CI, 13.9–20.1) (1). Among adolescents, the prevalence of impaired fasting glucose was reported as 7%, and similar to adults, was higher among males (10%) compared with females (4%), although this did not achieve statistical significance (P > 0.05) (72). Prevalence was highest among Hispanic children (13%) (NHANES 1999–2000) (72). We did not identify articles that reported the incidence of impaired fasting glucose.
Impaired glucose tolerance.
One article reported the prevalence and one reported the incidence of impaired glucose tolerance. In NHANES-III adults between 45 and 74 yr of age, the overall prevalence was reported as 17.1% and was similar among males (16.6%) and females (17.7%). Hispanics had the highest prevalence of impaired glucose tolerance (20.9%) (73). The incidence of glucose intolerance was reported among participants 33–67 yr of age from the Framingham Study as 6.7% among males and 5.5% among females during 14 yr (74).
Metabolic syndrome.
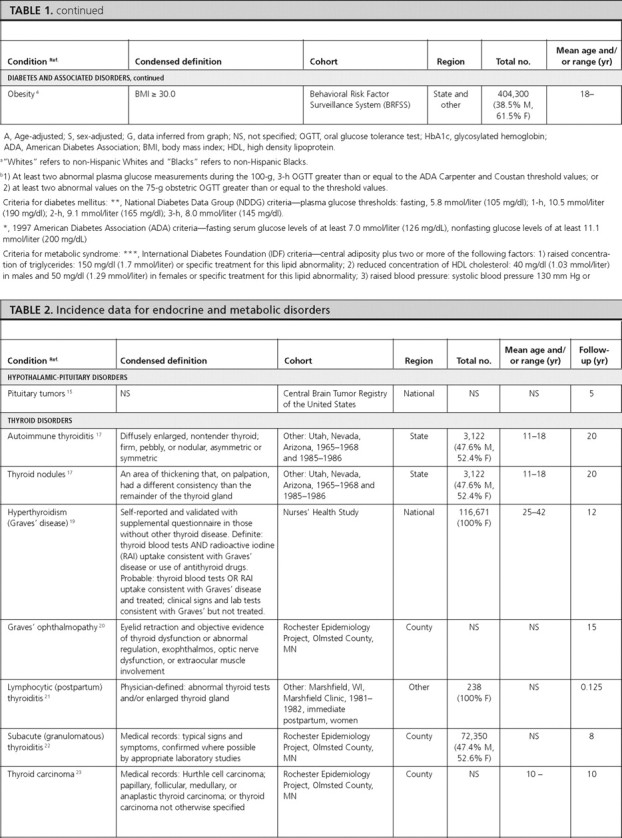
Two articles reported the prevalence of metabolic syndrome using recent NHANES data. The overall prevalence in adults was 39% using the International Diabetes Federation (IDF) criteria and 34.5% using the National Cholesterol Education Panel (NCEP) criteria, respectively (NHANES 1999–2002) (75). Using both definitions, estimates were similar for males and females. Using the IDF criteria among children from NHANES (1999–2004), the overall prevalence was 4.5%, with a significantly higher prevalence in males (6.7%) compared with females (2.1%) (P = 0.006) (3). The prevalence was highest among Hispanic children (7.1%) and increased with age (3).
Dyslipidemias
Two articles reported the prevalence of dyslipidemias using recent NHANES data. We did not find data reporting the incidence of dyslipidemias.
Hypercholesterolemia.
Among adults, the age- and sex-adjusted prevalence of hypercholesterolemia was 17% when defined as total cholesterol of at least 240 mg/dl irrespective of treatment and 22.5% when defined as total cholesterol of at least 240 mg/dl or treatment with cholesterol medication (NHANES 1999–2000) (76).
Hypertriglyceridemia.
Among adults in NHANES-III, the overall prevalence of hypertriglyceridemia was 30.1%, with a higher prevalence in males (35.1%) compared with females (24.7%) (77). Hispanics had the highest prevalence of hypertriglyceridemia (37.7%), whereas it was lowest in Blacks (17.7%) (77). Similar patterns were observed among children in NHANES (1999–2004), where the overall prevalence of hypertriglyceridemia was 8.9%. There was a somewhat higher prevalence in male children (10.5%) compared with female children (7.3%) (P = 0.131) (3). Although the prevalence of hypertriglyceridemia was similar in White and Hispanic children (∼10%), it was lowest in Black children (3.6%) (P < 0.001), and the prevalence increased with age (3).
Low high-density lipoprotein (HDL)-cholesterol.
Among adults in NHANES-III, the overall prevalence of low HDL-cholesterol was 37.1%, and it was similar in males (35.2%) and females (39.3%) (77). Among children, the overall prevalence of low HDL-cholesterol was 22.6%, and it was similar in males (23.4%) and females (21.8%) (NHANES 1999–2004) (3). The prevalence was highest among older children (3). As with hypertriglyceridemia, the prevalence of low HDL-cholesterol was lowest among Black adults (28.8%) (77) and Black children (14.4%) (3).
Obesity
Three articles reported prevalence estimates for obesity. Among NHANES (2003–2004) adults, the prevalence of obesity was 32.2% (78). The most obese age group was 40–59 yr olds (36.8%). Overall, 45.0% of Blacks and 38.6% of Hispanics were obese. Although obesity estimates in males of all ethnicities were not significantly different from each other, Black (53.9%) and Hispanic (42.3%) females had higher obesity rates compared with White females (30.2%). This trend was reported in each age group (78). Among adults, the overall prevalence of obesity in the BRFSS was 25.6%, with similar prevalence in males and females (4). Whites had the lowest prevalence (24.5%), whereas Blacks had the highest prevalence (35.8%). The prevalence of obesity increased with age, reaching a peak (30.9%) at ages 50–59 yr; however, prevalence was lower (19.4%) in individuals at least 70 yr of age (4).
Among children in NHANES (1999–2004), the prevalence of obesity was 28.6%, with a significantly higher prevalence in female children (36.5%) compared with male children (21.0%) (P < 0.001). There was also an increase in the prevalence of obesity with age (3). Among all ethnicities, the obesity prevalence was greater than 25%, with Hispanic children having the highest prevalence (34.5%) (3). We did not identify U.S. population-based data on the incidence of obesity.
Discussion
Summary of findings
To our knowledge, this is the first comprehensive review of the epidemiology of all endocrine and metabolic disorders with data derived from population-based studies in the United States. Our review highlights the high prevalence estimates of several endocrine disorders posing significant public health burdens, each of which affects more than 5% of the overall U.S. adult population (supplemental Table 4). Depending on the specific population studied, the most highly prevalent conditions among adults (non-ethnic-specific) were diabetes mellitus (6–22%), impaired fasting glucose (7–26%), impaired glucose tolerance (17%), obesity (19–32%), metabolic syndrome (34–39%), osteoporosis (7.2%) and osteopenia (39.6%) in women, osteoporosis (6%) and osteopenia (47%) in men, erectile dysfunction in males (18.5%), hypercholesterolemia (17%), low HDL-cholesterol (37%), hypertriglyceridemia (30%), and thyroiditis (5%). The endocrine disorders with the highest documented incidence estimates in the U.S. adult population were erectile dysfunction in men and osteopenia and osteoporosis in women, reflecting the aging of our population. Based on the articles included in our review, the least prevalent endocrine conditions, affecting less than 1% of the populations studied, were diabetes mellitus in children and pituitary adenomas. The conditions with the lowest recorded incidence were adrenocortical carcinoma, pheochromocytoma, and pituitary adenomas.
In population-based studies of individuals with self-reported diagnosed diabetes mellitus, secondary complications were also highly prevalent, with diabetic nephropathy occurring in 28%, diabetic retinopathy occurring in 47–48%, and peripheral neuropathy occurring in 21% of affected adults. Data from populations of young adult and middle-aged females indicated that gestational diabetes, hirsutism, and PCOS affect 4–8% of females in the United States. However, the most prevalent endocrine conditions among females in the United States were osteoporosis and osteopenia.
The prevalence and incidence of several metabolic and endocrine conditions differed by sex. Impaired fasting glucose was more prevalent among males in two studies, whereas the prevalence of impaired glucose tolerance and diabetes mellitus did not differ by sex. Although the prevalence of metabolic syndrome and obesity in adults was similar by sex, the prevalence of metabolic syndrome was higher in male children compared with female children, and obesity was more prevalent in female children compared with male children. Primary hyperparathyroidism, thiazide-induced hypercalcemia, and vitamin D deficiency were also more common in females. The incidence of Paget’s disease was higher in males compared with females, although the prevalence was similar. For thyroid diseases, the incidences of Graves’ ophthalmopathy, thyroid carcinoma, and subacute thyroiditis were all higher in females.
Obesity affected 28% of U.S. children ages 12 to 17 yr. The most prevalent endocrine disorder in boys was gynecomastia, which affected nearly 50% of male adolescents. The prevalence of diabetes mellitus was quite low among children, estimated at less than 1%; however, with the current high prevalence of obesity, the incidence and prevalence of type 2 diabetes in children and young adults are expected to rise.
The prevalence of type 2 diabetes increased with age in both adults and children. On the other hand, the incidence of type 1 diabetes reached a peak in mid-to-late childhood and early adolescence. Certain endocrine disorders affected young to middle-aged individuals, for example, with the prevalence of obesity reaching a peak prevalence in middle age (50–60 yr) and the incidence of subacute thyroiditis being highest in young adulthood and middle age.
Several endocrine disorders affected certain ethnic groups more than others. The prevalence estimates of diabetes mellitus and obesity were highest among Black and Hispanic individuals. Hispanics had the highest prevalence of impaired fasting glucose and impaired glucose tolerance. Metabolic syndrome prevalence was lowest among Black children and highest among Hispanic children. Asian females had the highest prevalence and incidence of gestational diabetes. Blacks were least likely to have hypertriglyceridemia, low HDL-cholesterol, and hypothyroidism.
Limitations to the current literature
Our review highlights several limitations to the current literature regarding the epidemiology of endocrine and metabolic disorders. We identified a number of conditions for which there were no prevalence and incidence estimates from population-based data in the United States. For example, whereas the prevalence of GH deficiency has been estimated for children, there have been no comparable estimates from an adult population. Particularly as the population ages, it will be important to know the prevalence of GH deficiency in adults given its association with an adverse cardiometabolic profile (79). Hypogonadism in males is associated with erectile dysfunction as well as adverse cardiovascular and metabolic outcomes, including coronary heart disease and diabetes (80, 81). However, we were unable to identify articles reporting the epidemiology of primary and secondary hypogonadism in the U.S. population. Hypogonadism is also associated with osteopenia and osteoporosis, which are significant public health burdens in U.S. females. Given that osteopenia, osteoporosis, and erectile dysfunction are highly prevalent among U.S. adults and have very high incidence rates, it will be important in the future to quantify the contribution of hypogonadism to these conditions by incorporating the measurement of sex hormones into population-based studies.
Other endocrine conditions for which we did not identify articles describing their epidemiology in the population-based setting were rare gastrointestinal endocrine tumors. Reported data on the epidemiology of adrenal disorders were essentially limited to the incidence of pheochromocytoma and adrenocortical carcinoma. Therefore, future studies are needed to help determine the prevalence and incidence of adrenal insufficiency, as well as hypercortisolism and hyperaldosteronism, both of which are causes of secondary hypertension, with the former also being a secondary cause of type 2 diabetes and obesity.
Overall, ethnic group-specific data were available in 60% of our articles reporting prevalence data and 23% of our articles reporting incidence. Furthermore, only 19% of prevalence articles and 10% of incidence articles reported data that included Native Americans and/or Asians. Future population-based studies of endocrine disorders should continue to be multiethnic, with a particular emphasis on recruiting Native Americans and Asians.
Some of the gaps in our knowledge of the epidemiology of endocrine and metabolic diseases may seem surprising, particularly in light of confidently quoted statistics in other reviews and book chapters. It is important to remember that estimates considered in this rigorous comprehensive literature review were limited to U.S. population-based studies that did not include clinic-based or symptomatic populations. Consequently, reports of the prevalence of certain conditions among individuals with a particular clinical phenotype, e.g. aldosteronoma in hypertensive patients, or a particular subset of a broader endocrine disease, e.g. acromegaly among pituitary tumor patients, were not included because these data were not based on nonclinical populations. Another limitation of available study data arises from the fact that some endocrine disorders have been rather arbitrarily defined as simply the extremes of hormone-related phenotypes in the populations, e.g. decreased bone mineral density and precocious and delayed puberty.
Limitations to our review
Several limitations should be kept in mind when interpreting our data. First, we conducted a comprehensive review, as opposed to a systematic review of the literature and may have missed key references. However, we compiled a comprehensive list of references from our content experts and handsearching relevant texts and articles, during which key references were repeatedly identified. Second, most of our data are restricted to the past 10 yr, which does not enable us to comment on secular trends in the prevalence and incidence of endocrine disorders. In an attempt to report the most current data, we may have selected studies with less rigorous definitions of the endocrine disorder or excluded data from certain population-based cohort studies. The advantage to summarizing the most current literature is to present the most up-to-date statistics to inform current clinical care, research, and workforce requirements in the field of endocrinology and metabolism. Third, by limiting our search to U.S. population-based studies, our data may not be generalizable to other parts of the world. Also, by excluding studies based on clinical populations, we were unable to report the epidemiology of certain disorders, such as hypercortisolism, hyperaldosteronism, or hypogonadism, which might be detected when individuals with certain clinical phenotypes are evaluated in a clinical setting. We restricted our data to those derived from nonclinical population-based studies to provide prevalence and incidence estimates most closely reflecting the true burden and risk of conditions in the general population.
Future directions and conclusions
It is important that there be a more complete definition of the prevalence and incidence of endocrine and metabolic diseases. To accomplish this goal, future epidemiological studies should incorporate hormonal measures that can be accurately determined in the population setting. Measures such as intact PTH, IGF-I, and pituitary hormones (i.e. TSH, FSH, and LH) should be incorporated. Sex hormones (i.e. testosterone, estradiol), which have been measured in prior studies, can now be more accurately determined using liquid chromatography tandem-mass spectrometry, a newer laboratory technique (82, 83, 84). This will enable us to determine the prevalence and incidence of endocrine disorders such as hyperparathyroidism, primary and secondary hypogonadism, GH deficiency, and hypothyroidism, all of which contribute to other disorders, such as metabolic bone disease and diabetes mellitus. Endocrinologists cross-trained as epidemiologists will also be needed in the future to contribute to the design of longitudinal cohort studies, to inform steering committees regarding incorporation of appropriate endocrine measures, and to exploit existing data sets to generate additional population estimates for endocrine disorders. It is imperative that future cohort studies continue to be multiethnic so that we can obtain up-to-date epidemiological data for endocrine and metabolic disorders in all populations.
Defining the epidemiology of endocrine and metabolic disorders will provide clues to risk factors and identify areas to allocate public health and research resources. It is also important that more accurate epidemiological data be acquired to estimate the workforce needed to prevent, diagnose, and treat endocrine and metabolic diseases. In 2003, a model developed to determine workforce requirements for endocrinologists in the United States until 2020 concluded that, “the current national supply of endocrinologists is estimated to be 12% lower than demand” and that demand would exceed supply through 2020 (6). It further predicted that the deficit of endocrine subspecialists would widen after 2008 due to the aging population and a projected decline in the number of endocrinologists, as an older generation of clinicians retire. Several of the most common endocrine disorders, such as diabetes mellitus, osteoporosis, and hyperlipidemia, are cared for by primary care physicians due to the shortage of endocrinologists. In fact, a recent Centers for Disease Control fact sheet estimated a higher diabetes prevalence of 7.8% in adults in 2007 (85). The current review, showing high prevalence and incidence of common endocrine and metabolic disorders, validates that concern.
Acknowledgments
The authors thank Drs. Frederick L. Brancati and Elizabeth Selvin for their critical review of our manuscript. The authors also gratefully acknowledge the contributions of the following experts: Roy Altman, University of California, Los Angeles School of Medicine; David Aron, Case Western Reserve University School of Medicine; Brad Astor, Johns Hopkins University Bloomberg School of Public Health; Diana Benn, University of Sydney, Australia; Shalender Bhasin, Boston University; Diane Bild, National Heart, Lung, and Blood Institute; John Bilezikian, Columbia University; Frederick Brancati, Johns Hopkins School of Medicine; Glenn Braunstein, University of California, Los Angeles School of Medicine; Thomas Buchanan, University of Southern California Keck School of Medicine; Jeanne Clark, Johns Hopkins School of Medicine; Fredric Coe, University of Chicago Medical Center; John Connell, Glasgow Cardiovascular Research Centre; Josef Coresh, Johns Hopkins Bloomberg School of Public Health; Gary Curhan, Harvard School of Public Health; Marc Drezner, University of Wisconsin; Andrea Dunaif, Northwestern University Feinberg School of Medicine; Mark Eberhardt, National Center for Health Statistics; Martin Fassnacht, University of Wuerzburg, Germany; Murray Favus, University of Chicago Medical Center; Aaron Folsom, University of Minnesota; Linda Geiss, Centers for Disease Control and Prevention; Ashley Grossman, St. Bartholomew’s Hospital, London, UK; Giuseppina Imperatore, Centers for Disease Control and Prevention; Ronald Klein, University of Wisconsin; Lewis Kuller, University of Pittsburgh; Andre Lacroix, Centre Hospitalier de l’Université de Montréal, Canada; Stephen LaFranchi, Oregon Health & Science University; Barbara Lippe, Genentech, Inc.; Shlomo Melmed, Cedars-Sinai Medical Center; Joseph Melton, Mayo Clinic; Paolo Mulatero, San Vito Hospital, Torino, Italy; Primus Mullis, University Children’s Hospital, Bern, Switzerland; Hartmut Neumann, University of Freiburg, Hugstetterstr, Germany; Maria New, Mount Sinai School of Medicine; Thomas O'Dorisio, University of Iowa Holden Cancer Center; Trevor Orchard, University of Pittsburgh; Leslie Plotnick, Johns Hopkins School of Medicine; Charmian Quigley, Eli Lilly & Co.; Martin Reincke, Albert-Ludwigs University, Germany; Edward Reiter, Baystate Medical Center; Alan Rogol, University of Virginia; Janet Schlecte, University of Iowa; Elizabeth Selvin, Johns Hopkins School of Medicine; A. Richey Sharrett, Johns Hopkins Bloomberg School of Public Health; Dolores Shoback, University of California, San Francisco Medical Center; Frederick Singer, University of California, Los Angeles School of Medicine; Ethel Siris, Columbia University College of Physicians and Surgeons; June Stevens, University of North Carolina; Moyses Szklo, Johns Hopkins Bloomberg School of Public Health; Massimo Terzolo, University of Turin, Italy; Robert Utiger, Brigham and Women’s Hospital, Harvard University; Charlene Waldman, Paget Foundation; Nelson Watts, University of Cincinnati Bone Health and Osteoporosis Center; Gilbert Welch, Dartmouth Medical School; Patrick Wilton, Pfizer; and William Young, Mayo Clinic.
Footnotes
For reprint orders over 100 copies, please contact Cadmus Communications at reprints2@cadmus.com.
This review was funded by The Endocrine Society.
Disclosure Summary: The authors have nothing to disclose.
Abbreviations: CI, Confidence interval; HDL, high-density lipoprotein; py, person-years.
References
- 1.Cowie CC, Rust KF, Byrd-Holt DD, Eberhardt MS, Flegal KM, Engelgau MM, Saydah SH, Williams DE, Geiss LS, Gregg EW 2006. Prevalence of diabetes and impaired fasting glucose in adults in the U.S. population: National Health and Nutrition Examination Survey 1999–2002. Diabetes Care 29:1263–1268 [DOI] [PubMed] [Google Scholar]
- 2.Mokdad AH, Bowman BA, Engelgau MM, Vinicor F 2001. Diabetes trends among American Indians and Alaska natives: 1990–1998. Diabetes Care 24:1508–1509 [DOI] [PubMed] [Google Scholar]
- 3.Ford ES, Li C, Zhao G, Pearson WS, Mokdad AH 2008. Prevalence of the metabolic syndrome among U.S. adolescents using the definition from the International Diabetes Federation. Diabetes Care 31:587–589 [DOI] [PubMed] [Google Scholar]
- 4.2008 State-specific prevalence of obesity among adults—United States, 2007. MMWR Morb Mortal Wkly Rep 57:765–768 [PubMed] [Google Scholar]
- 5.Jemal A, Siegel R, Ward E, Hao Y, Xu J, Murray T, Thun MJ 2008. Cancer statistics, 2008. CA Cancer J Clin 58:71–96 [DOI] [PubMed] [Google Scholar]
- 6.Rizza RA, Vigersky RA, Rodbard HW, Ladenson PW, Young Jr WF, Surks MI, Kahn R, Hogan PF 2003. A model to determine workforce needs for endocrinologists in the United States until 2020. J Clin Endocrinol Metab 88:1979–1987 [DOI] [PubMed] [Google Scholar]
- 7.Gardner DG, Shoback D 2007. Greenspan’s basic and clinical endocrinology. 8th ed. New York: McGraw-Hill
- 8.Larsen PR, Kronenberg HM, Melmed S, Polonsky KS 2003. Williams textbook of endocrinology. 10th ed. Philadelphia: Saunders, An Imprint of Elsevier
- 9.DeGroot LJ, Jameson, JL 2005. Endocrinology. 5th ed. Philadelphia: Saunders, An Imprint of Elsevier
- 10.Nussey SS, Whitehead SA 2001. Endocrinology: an integrated approach. London: Taylor and Francis Group. Available online at http://www.ncbi.nlm.nih.gov/books/bv.fcgi?call=bv.View.ShowTOC&rid=endocrin.TOC&depth=1. Last accessed 12/17/2007
- 11.www.endotext.org website, published by MDTEXT.COM, INC, S. Dartmouth, MA. Last accessed 12/17/2007
- 12.National Diabetes Data Group 1995. Diabetes in America. 2nd ed. Bethesda, MD: National Institutes of Health Publications
- 13.Lindsay R, Feldkamp M, Harris D, Robertson J, Rallison M 1994. Utah Growth Study: growth standards and the prevalence of growth hormone deficiency. J Pediatr 125:29–35 [DOI] [PubMed] [Google Scholar]
- 14.Yue NC, Longstreth Jr WT, Elster AD, Jungreis CA, O'Leary DH, Poirier VC 1997. Clinically serious abnormalities found incidentally at MR imaging of the brain: data from the Cardiovascular Health Study. Radiology 202:41–46 [DOI] [PubMed] [Google Scholar]
- 15.Surawicz TS, McCarthy BJ, Kupelian V, Jukich PJ, Bruner JM, Davis FG 1999. Descriptive epidemiology of primary brain and CNS tumors: results from the Central Brain Tumor Registry of the United States, 1990–1994. Neuro Oncol 1:14–25 [DOI] [PMC free article] [PubMed] [Google Scholar]
- 16.Hollowell JG, Staehling NW, Flanders WD, Hannon WH, Gunter EW, Spencer CA, Braverman LE 2002. Serum TSH, T(4), and thyroid antibodies in the United States population (1988 to 1994): National Health and Nutrition Examination Survey (NHANES III). J Clin Endocrinol Metab 87:489–499 [DOI] [PubMed] [Google Scholar]
- 17.Rallison ML, Dobyns BM, Meikle AW, Bishop M, Lyon JL, Stevens W 1991. Natural history of thyroid abnormalities: prevalence, incidence, and regression of thyroid diseases in adolescents and young adults. Am J Med 91:363–370 [DOI] [PubMed] [Google Scholar]
- 18.Baldwin DB, Rowett D 1978. Incidence of thyroid disorders in Connecticut. JAMA 239:742–744 [PubMed] [Google Scholar]
- 19.Holm IA, Manson JE, Michels KB, Alexander EK, Willett WC, Utiger RD 2005. Smoking and other lifestyle factors and the risk of Graves’ hyperthyroidism. Arch Intern Med 165:1606–1611 [DOI] [PubMed] [Google Scholar]
- 20.Bartley GB, Fatourechi V, Kadrmas EF, Jacobsen SJ, Ilstrup DM, Garrity JA, Gorman CA 1995. The incidence of Graves’ ophthalmopathy in Olmsted County, Minnesota. Am J Ophthalmol 120:511–517 [DOI] [PubMed] [Google Scholar]
- 21.Nikolai TF, Turney SL, Roberts RC 1987. Postpartum lymphocytic thyroiditis. Prevalence, clinical course, and long-term follow-up. Arch Intern Med 147:221–224 [DOI] [PubMed] [Google Scholar]
- 22.Furszyfer J, McConahey WM, Wahner HW, Kurland LT 1970. Subacute (granulomatous) thyroiditis in Olmsted County, Minnesota. Mayo Clin Proc 45:396–404 [PubMed] [Google Scholar]
- 23.Burke JP, Hay ID, Dignan F, Goellner JR, Achenbach SJ, Oberg AL, Melton 3rd LJ 2005. Long-term trends in thyroid carcinoma: a population-based study in Olmsted County, Minnesota, 1935–1999. Mayo Clin Proc 80:753–758 [DOI] [PubMed] [Google Scholar]
- 24.Davies L, Welch HG 2006. Increasing incidence of thyroid cancer in the United States, 1973–2002. JAMA 295:2164–2167 [DOI] [PubMed] [Google Scholar]
- 25.Beard CM, Sheps SG, Kurland LT, Carney JA, Lie JT 1983. Occurrence of pheochromocytoma in Rochester, Minnesota, 1950 through 1979. Mayo Clin Proc 58:802–804 [PubMed] [Google Scholar]
- 26.Kebebew E, Reiff E, Duh QY, Clark OH, McMillan A 2006. Extent of disease at presentation and outcome for adrenocortical carcinoma: have we made progress? World J Surg 30:872–878 [DOI] [PubMed] [Google Scholar]
- 27.Van Winter JT, Noller KL, Zimmerman D, Melton 3rd LJ 1990. Natural history of premature thelarche in Olmsted County, Minnesota, 1940 to 1984. J Pediatr 116:278–280 [DOI] [PubMed] [Google Scholar]
- 28.Azziz R, Woods KS, Reyna R, Key TJ, Knochenhauer ES, Yildiz BO 2004. The prevalence and features of the polycystic ovary syndrome in an unselected population. J Clin Endocrinol Metab 89:2745–2749 [DOI] [PubMed] [Google Scholar]
- 29.Saigal CS, Wessells H, Pace J, Schonlau M, Wilt TJ 2006. Predictors and prevalence of erectile dysfunction in a racially diverse population. Arch Intern Med 166:207–212 [DOI] [PubMed] [Google Scholar]
- 30.Bacon CG, Mittleman MA, Kawachi I, Giovannucci E, Glasser DB, Rimm EB 2003. Sexual function in men older than 50 years of age: results from the health professionals follow-up study. Ann Intern Med 139:161–168 [DOI] [PubMed] [Google Scholar]
- 31.Johannes CB, Araujo AB, Feldman HA, Derby CA, Kleinman KP, McKinlay JB 2000. Incidence of erectile dysfunction in men 40 to 69 years old: longitudinal results from the Massachusetts male aging study. J Urol 163:460–463 [PubMed] [Google Scholar]
- 32.Biro FM, Lucky AW, Huster GA, Morrison JA 1990. Hormonal studies and physical maturation in adolescent gynecomastia. J Pediatr 116:450–455 [DOI] [PubMed] [Google Scholar]
- 33.Wermers RA, Kearns AE, Jenkins GD, Melton 3rd LJ 2007. Incidence and clinical spectrum of thiazide-associated hypercalcemia. Am J Med 120:911.e9–e15 [DOI] [PMC free article] [PubMed]
- 34.Wermers RA, Khosla S, Atkinson EJ, Achenbach SJ, Oberg AL, Grant CS, Melton 3rd LJ 2006. Incidence of primary hyperparathyroidism in Rochester, Minnesota, 1993–2001: an update on the changing epidemiology of the disease. J Bone Miner Res 21:171–177 [DOI] [PubMed] [Google Scholar]
- 35.Looker AC, Orwoll ES, Johnston Jr CC, Lindsay RL, Wahner HW, Dunn WL, Calvo MS, Harris TB, Heyse SP 1997. Prevalence of low femoral bone density in older U.S. adults from NHANES III. J Bone Miner Res 12:1761–1768 [DOI] [PubMed] [Google Scholar]
- 36.Siris ES, Miller PD, Barrett-Connor E, Faulkner KG, Wehren LE, Abbott TA, Berger ML, Santora AC, Sherwood LM 2001. Identification and fracture outcomes of undiagnosed low bone mineral density in postmenopausal women: results from the National Osteoporosis Risk Assessment. JAMA 286:2815–2822 [DOI] [PubMed] [Google Scholar]
- 37.Kidambi S, Partington S, Binkley N 2005. Low bone mass prevalence and osteoporosis risk factor assessment in African American Wisconsin women. WMJ 104:59–65 [PubMed] [Google Scholar]
- 38.Babbar RK, Handa AB, Lo CM, Guttmacher SJ, Shindledecker R, Chung W, Fong C, Ho-Asjoe H, Chan-Ting R, Dixon LB 2006. Bone health of immigrant Chinese women living in New York City. J Community Health 31:7–23 [DOI] [PubMed] [Google Scholar]
- 39.Zadshir A, Tareen N, Pan D, Norris K, Martins D 2005. The prevalence of hypovitaminosis D among US adults: data from the NHANES III. Ethn Dis 15:S5–97-101 [PubMed]
- 40.Altman RD, Bloch DA, Hochberg MC, Murphy WA 2000. Prevalence of pelvic Paget’s disease of bone in the United States. J Bone Miner Res 15:461–465 [DOI] [PubMed] [Google Scholar]
- 41.Tiegs RD, Lohse CM, Wollan PC, Melton LJ 2000. Long-term trends in the incidence of Paget’s disease of bone. Bone 27:423–427 [DOI] [PubMed] [Google Scholar]
- 42.Stamatelou KK, Francis ME, Jones CA, Nyberg LM, Curhan GC 2003. Time trends in reported prevalence of kidney stones in the United States: 1976–1994. Kidney Int 63:1817–1823 [DOI] [PubMed] [Google Scholar]
- 43.Curhan GC, Willett WC, Knight EL, Stampfer MJ 2004. Dietary factors and the risk of incident kidney stones in younger women: Nurses’ Health Study II. Arch Intern Med 164:885–891 [DOI] [PubMed] [Google Scholar]
- 44.Modlin IM, Lye KD, Kidd M 2003. A 5-decade analysis of 13,715 carcinoid tumors. Cancer 97:934–959 [DOI] [PubMed] [Google Scholar]
- 45.de Rekeneire N, Peila R, Ding J, Colbert LH, Visser M, Shorr RI, Kritchevsky SB, Kuller LH, Strotmeyer ES, Schwartz AV, Vellas B, Harris TB 2006. Diabetes, hyperglycemia, and inflammation in older individuals: the health, aging and body composition study. Diabetes Care 29:1902–1908 [DOI] [PubMed] [Google Scholar]
- 46.Liese AD, D'Agostino Jr RB, Hamman RF, Kilgo PD, Lawrence JM, Liu LL, Loots B, Linder B, Marcovina S, Rodriguez B, Standiford D, Williams DE 2006. The burden of diabetes mellitus among US youth: prevalence estimates from the SEARCH for Diabetes in Youth Study. Pediatrics 118:1510–1518 [DOI] [PubMed] [Google Scholar]
- 47.Narayan KM, Boyle JP, Thompson TJ, Gregg EW, Williamson DF 2007. Effect of BMI on lifetime risk for diabetes in the U.S. Diabetes Care 30:1562–1566 [DOI] [PubMed] [Google Scholar]
- 48.2008 State-specific incidence of diabetes among adults–participating states, 1995–1997 and 2005–2007. MMWR Morb Mortal Wkly Rep 57:1169–1173 [PubMed] [Google Scholar]
- 49.Gunderson EP, Lewis CE, Tsai AL, Chiang V, Carnethon M, Quesenberry Jr CP, Sidney S 2007. A 20-year prospective study of childbearing and incidence of diabetes in young women, controlling for glycemia before conception: the Coronary Artery Risk Development in Young Adults (CARDIA) Study. Diabetes 56:2990–2996 [DOI] [PMC free article] [PubMed] [Google Scholar]
- 50.Acton KJ, Burrows NR, Wang J, Thompson T 2006. Diagnosed diabetes among American Indians and Alaska Natives aged <35 years–United States, 1994–2004. MMWR Morb Mortal Wkly Rep 55:1201–1203 [PubMed] [Google Scholar]
- 51.West SK, Klein R, Rodriguez J, Muñoz B, Broman AT, Sanchez R, Snyder R; Proyecto VER 2001. Diabetes and diabetic retinopathy in a Mexican-American population: Proyecto VER. Diabetes Care 24:1204–1209 [DOI] [PubMed] [Google Scholar]
- 52.Burrows NR, Valdez R, Geiss LS, Engelgau ME 2004. Prevalence of diabetes among Hispanics–selected areas, 1998–2002. MMWR Morb Mortal Wkly Rep 53:941–944 [PubMed] [Google Scholar]
- 53.Harwell TS, McDowall JM, Moore K, Fagot-Campagna A, Helgerson SD, Gohdes D 2001. Establishing surveillance for diabetes in American Indian youth. Diabetes Care 24:1029–1032 [DOI] [PubMed] [Google Scholar]
- 54.Dabelea D, Bell RA, D'Agostino Jr RB, Imperatore G, Johansen JM, Linder B, Liu LL, Loots B, Marcovina S, Mayer-Davis EJ, Pettitt DJ, Waitzfelder B 2007. Incidence of diabetes in youth in the United States. JAMA 297:2716–2724 [DOI] [PubMed] [Google Scholar]
- 55.Wirth RB, Marfin AA, Grau DW, Helgerson SD 1993. Prevalence and risk factors for diabetes and diabetes-related amputations in American Indians in southern Arizona. Diabetes Care 16:354–356 [DOI] [PubMed] [Google Scholar]
- 56.Fujimoto WY, Leonetti DL, Kinyoun JL, Newell-Morris L, Shuman WP, Stolov WC, Wahl PW 1987. Prevalence of diabetes mellitus and impaired glucose tolerance among second-generation Japanese-American men. Diabetes 36:721–729 [DOI] [PubMed] [Google Scholar]
- 57.Fox CS, Pencina MJ, Meigs JB, Vasan RS, Levitzky YS, D'Agostino Sr RB 2006. Trends in the incidence of type 2 diabetes mellitus from the 1970s to the 1990s: the Framingham Heart Study. Circulation 113:2914–2918 [DOI] [PubMed] [Google Scholar]
- 58.Brancati FL, Kao WH, Folsom AR, Watson RL, Szklo M 2000. Incident type 2 diabetes mellitus in African American and white adults: the Atherosclerosis Risk in Communities Study. JAMA 283:2253–2259 [DOI] [PubMed] [Google Scholar]
- 59.Boyko EJ, Fujimoto WY, Leonetti DL, Newell-Morris L 2000. Visceral adiposity and risk of type 2 diabetes: a prospective study among Japanese Americans. Diabetes Care 23:465–471 [DOI] [PubMed] [Google Scholar]
- 60.Hanson RL, Imperatore G, Bennett PH, Knowler WC 2002. Components of the “metabolic syndrome” and incidence of type 2 diabetes. Diabetes 51:3120–3127 [DOI] [PubMed] [Google Scholar]
- 61.Wong TY, Klein R, Islam FM, Cotch MF, Folsom AR, Klein BE, Sharrett AR, Shea S 2006. Diabetic retinopathy in a multi-ethnic cohort in the United States. Am J Ophthalmol 141:446–455 [DOI] [PMC free article] [PubMed] [Google Scholar]
- 62.Varma R, Torres M, Peña F, Klein R, Azen SP 2004. Prevalence of diabetic retinopathy in adult Latinos: the Los Angeles Latino eye study. Ophthalmology 111:1298–1306 [DOI] [PubMed] [Google Scholar]
- 63.Orchard TJ, Forrest KY, Kuller LH, Becker DJ 2001. Lipid and blood pressure treatment goals for type 1 diabetes: 10-year incidence data from the Pittsburgh Epidemiology of Diabetes Complications Study. Diabetes Care 24:1053–1059 [DOI] [PubMed] [Google Scholar]
- 64.Dyck PJ, Kratz KM, Karnes JL, Litchy WJ, Klein R, Pach JM, Wilson DM, O'Brien PC, Melton 3rd LJ, Service FJ 1993. The prevalence by staged severity of various types of diabetic neuropathy, retinopathy, and nephropathy in a population-based cohort: the Rochester Diabetic Neuropathy Study. Neurology 43:817–824 [DOI] [PubMed] [Google Scholar]
- 65.Burrows NR, Wang J, Geiss LS, Venkatnarayan KM, Engelgau MM 2005. Incidence of end-stage renal disease among persons with diabetes—United States, 1990–2002. MMWR Morb Mortal Wkly Rep 54:1097–1100 [PubMed] [Google Scholar]
- 66.Cheng YJ, Gregg EW, Kahn HS, Williams DE, De Rekeneire N, Narayan KM 2006. Peripheral insensate neuropathy–a tall problem for US adults? Am J Epidemiol 164:873–880 [DOI] [PubMed] [Google Scholar]
- 67.Stella P, Ellis D, Maser RE, Orchard TJ 2000. Cardiovascular autonomic neuropathy (expiration and inspiration ratio) in type 1 diabetes. Incidence and predictors. J Diabetes Complications 14:1–6 [DOI] [PubMed] [Google Scholar]
- 68.Thorpe LE, Berger D, Ellis JA, Bettegowda VR, Brown G, Matte T, Bassett M, Frieden TR 2005. Trends and racial/ethnic disparities in gestational diabetes among pregnant women in New York City, 1990–2001. Am J Public Health 95:1536–1539 [DOI] [PMC free article] [PubMed] [Google Scholar]
- 69.Lawrence JM, Contreras R, Chen W, Sacks DA 2008. Trends in the prevalence of preexisting diabetes and gestational diabetes mellitus among a racially/ethnically diverse population of pregnant women, 1999–2005. Diabetes Care 31:899–904 [DOI] [PubMed] [Google Scholar]
- 70.Dabelea D, Snell-Bergeon JK, Hartsfield CL, Bischoff KJ, Hamman RF, McDuffie RS 2005. Increasing prevalence of gestational diabetes mellitus (GDM) over time and by birth cohort: Kaiser Permanente of Colorado GDM Screening Program. Diabetes Care 28:579–584 [DOI] [PubMed] [Google Scholar]
- 71.Ferrara A, Kahn HS, Quesenberry CP, Riley C, Hedderson MM 2004. An increase in the incidence of gestational diabetes mellitus: Northern California, 1991–2000. Obstet Gynecol 103:526–533 [DOI] [PubMed] [Google Scholar]
- 72.Williams DE, Cadwell BL, Cheng YJ, Cowie CC, Gregg EW, Geiss LS, Engelgau MM, Narayan KM, Imperatore G 2005. Prevalence of impaired fasting glucose and its relationship with cardiovascular disease risk factors in US adolescents, 1999–2000. Pediatrics 116:1122–1126 [DOI] [PubMed] [Google Scholar]
- 73.Benjamin SM, Valdez R, Geiss LS, Rolka DB, Narayan KM 2003. Estimated number of adults with prediabetes in the US in 2000: opportunities for prevention. Diabetes Care 26:645–649 [DOI] [PubMed] [Google Scholar]
- 74.Wilson PW, McGee DL, Kannel WB 1981. Obesity, very low density lipoproteins, and glucose intolerance over fourteen years: The Framingham Study. Am J Epidemiol 114:697–704 [DOI] [PubMed] [Google Scholar]
- 75.Ford ES 2005. Prevalence of the metabolic syndrome defined by the International Diabetes Federation among adults in the U.S. Diabetes Care 28:2745–2749 [DOI] [PubMed] [Google Scholar]
- 76.Gregg EW, Cheng YJ, Cadwell BL, Imperatore G, Williams DE, Flegal KM, Narayan KM, Williamson DF 2005. Secular trends in cardiovascular disease risk factors according to body mass index in US adults. JAMA 293:1868–1874 [DOI] [PubMed] [Google Scholar]
- 77.Ford ES, Giles WH, Dietz WH 2002. Prevalence of the metabolic syndrome among US adults: findings from the third National Health and Nutrition Examination Survey. JAMA 287:356–359 [DOI] [PubMed] [Google Scholar]
- 78.Ogden CL, Carroll MD, Curtin LR, McDowell MA, Tabak CJ, Flegal KM 2006. Prevalence of overweight and obesity in the United States, 1999–2004. JAMA 295:1549–1555 [DOI] [PubMed] [Google Scholar]
- 79.Tzanela M 2007. Adult growth hormone deficiency: to treat or not to treat. Expert Opin Pharmacother 8:787–795 [DOI] [PubMed] [Google Scholar]
- 80.Kalyani RR, Dobs AS 2007. Androgen deficiency, diabetes, and the metabolic syndrome in men. Curr Opin Endocrinol Diabetes Obes 14:226–234 [DOI] [PubMed] [Google Scholar]
- 81.Shabsigh R, Arver S, Channer KS, Eardley I, Fabbri A, Gooren L, Heufelder A, Jones H, Meryn S, Zitzmann M 2008. The triad of erectile dysfunction, hypogonadism and the metabolic syndrome. Int J Clin Pract 62:791–798 [DOI] [PMC free article] [PubMed] [Google Scholar]
- 82.Bhasin S, Zhang A, Coviello A, Jasuja R, Ulloor J, Singh R, Vesper H, Vasan RS 2008. The impact of assay quality and reference ranges on clinical decision making in the diagnosis of androgen disorders. Steroids 73:1311–1317 [DOI] [PubMed] [Google Scholar]
- 83.Demers LM 2008. Testosterone and estradiol assays: current and future trends. Steroids 73:1333–1338 [DOI] [PubMed] [Google Scholar]
- 84.Wang C, Shiraishi S, Leung A, Baravarian S, Hull L, Goh V, Lee PW, Swerdloff RS 2008. Validation of a testosterone and dihydrotestosterone liquid chromatography tandem mass spectrometry assay: interference and comparison with established methods. Steroids 73:1345–1352 [DOI] [PMC free article] [PubMed] [Google Scholar]
- 85.2008 National diabetes fact sheet: general information and national estimates on diabetes in the United States, 2007. Atlanta: Centers for Disease Control and Prevention, Available online at http://www.cdc.gov/diabetes/pubs/pdf/ndfs_2007.pdf. Last accessed 12/29/2008


