

Abstract
Staphylococcus aureus (Sa) is the leading cause of a variety of bacterial infections ranging from superficial skin infections to invasive and life threatening diseases such as septic bacteremia, necrotizing pneumonia, and endocarditis. The success of Sa as a human pathogen is contributed to its ability to adapt to different environments by changing expression, production, or secretion of virulence factors. Although Sa immune evasion is well-studied, the regulation of virulence factors under different nutrient and growth conditions is still not well understood. Here, we used label-free quantitative mass spectrometry to quantify and compare the Sa exoproteins (i.e. exoproteomes) of master regulator mutants or established reference strains. Different environmental conditions were addressed by growing the bacteria in rich or minimal media at different phases of growth. We observed clear differences in the composition of the exoproteomes depending on the genetic background or growth conditions. The relative abundance of cytotoxins determined in our study correlated well with differences in cytotoxicity measured by lysis of human neutrophils. Our findings demonstrate that label-free quantitative mass spectrometry is a versatile tool for predicting the virulence of bacterial strains and highlights the importance of the experimental design for in vitro studies. Furthermore, the results indicate that label-free proteomics can be used to cluster isolates into groups with similar virulence properties, highlighting the power of label-free quantitative mass spectrometry to distinguish Sa strains.
Staphylococcus aureus (Sa)1 asymptomatic colonization of the nares, skin or gastrointestinal tract is detected in ∼30% of humans (1, 2). At the same time, Sa is also responsible for a variety of diseases ranging from skin and soft tissue infections to invasive diseases such as bacteremia, necrotizing pneumonia, and infective endocarditis (3, 4). How Sa switches its lifestyle from a commensal bacterium to a dangerous human pathogen is not well understood. Of particular concern is the emergence of difficult to treat, community-associated methicillin-resistant Sa (CA-MRSA) that began in the 1990s. The rise of CA-MRSA indicates that MRSA strains evolved from a traditionally nosocomial pathogen to a pathogen that causes disease in healthy individuals with no healthcare associated risk factors (3, 5). The most successful CA-MRSA in the United States of America is the USA300 lineage (3, 4).
The success of CA-MRSA as a formidable human pathogen is largely because of an array of virulence factors that are adept at disarming the human immune system (6). Certain immunomodulatory proteins such as staphylococcal protein A (Spa) and staphylococcal binder of immunoglobulin (Sbi) bind to human IgG and prevent opsonophagocytosis by immune cells (7–9). Others, such as staphylococcal complement inhibitor (SCIN) efficiently inhibits opsonization and phagocytosis (10, 11), by disarming critical innate immune defense strategies through the prevention of complement activation. In addition, Sa produces surface proteins including clumping factor A (ClfA) and extracellular fibrinogen binding protein (Efb), to promote attachment to host cells and tissues (12). This pathogen also secretes enzymes such as nucleases and proteases enabling Sa to counter neutrophil extracellular nets (NETs) and degrade host tissues, respectively (13–15). Additionally, Sa produces an array of cytotoxins such as leukocidins and phenol soluble modulins (PSMs) that target and destroy cells of the innate and adaptive immune systems (16, 17). PSMs insert nonspecifically into the cell membrane because of their amphiphilic nature. In contrast, the bi-component pore-forming leukocidins insert into the plasma membrane of target cells upon binding to specific surface receptors, both resulting in membrane puncture and cell death (18).
Sa modulates expression of virulence factors by sensing signals from the environment through a complex network of regulatory elements. Three master regulators are key for the controlled expression of Sa virulence factors: the accessory gene regulator (AgrBDCA), the repressor of toxins (Rot), and the Sa exoprotein expression (SaePQRS) system. The well-characterized, agr locus encodes for a “self-recognizing” two-component system (TCS) that detects increases in cell density via a secreted signaling peptide, resulting in the production of an effector regulatory RNA known as RNAIII (19, 20). RNAIII is a powerful activator of enzymes and cytotoxins that are thought to promote Sa survival in vivo (19–24). It acts by inhibiting translation of another master regulator, rot (22). Rot directly binds to the promoter elements of toxins/proteases and represses their transcription, while it activates expression of gene products involved in immune evasion (21, 25). Although Rot represses the expressions of certain toxins and enzymes, the Sae-TCS is involved in the activation of the genes encoding toxins and secreted proteins (26–31). The Sae-TCS senses environmental stimuli such as pH and the presence of host phagocytes resulting in a dramatic increase of toxin production (31–33). Taken together, when bacterial densities are low during early stages of Sa infections, the Agr system is generally inactive and Rot is abundant, thereby repressing toxin expressions. At this time, factors that evade immune detection, and adhesins that help Sa attach to host tissues, are highly expressed. When Sa adheres and colonizes various tissues, it rapidly grows, leading to activation of the Agr system. Activated Agr leads to suppression of Rot, and thus enhances enzyme and toxin production, while repressing production of immune modulators.
Mutations in master regulators are often associated with clinical infections and can be reflective of the severity of infections. The ability to predict severity of infection of an emerging strain could potentially inform clinical prognostication, management and infection control. Current methods for cataloging Sa strains rely on utilizing genomic sequences to determine clonality, such as multilocus sequence typing (MLST) and spa typing. Strains are also screened for the presence of important genetic biomarkers, such as the staphylococcal cassette chromosome mec gene (SSCmec) and the Panton-Valentine Leukocidin gene (pvl) (34). MLST uses seven housekeeping genes to group the different Sa strains into sequence types (ST). STs sharing 5 of the 7 identical alleles are grouped as clonal complexes (CCs). Thus, MLST can provide information regarding the lineage of different Sa isolates in population and epidemiological studies (35). Spa typing cataloges the variable tandem number of repeat polymorphisms in the 3′ coding region of Spa (36, 37). SCCmec confers methicillin resistance to Sa (38). The presence of pvl is often associated with CA-MRSA, such as strains from the USA300 lineage (3).
Although genotypic methods have been reliable and reproducible in grouping the different Sa strains (34), they provide limited information on the production of virulence factors; thus the virulence potential of these strains cannot be accurately predicted based on typing alone. Since the controlled production of virulence factors is vital for the success of Sa as a human pathogen, we sought to test the utility of label-free quantitative proteomics for characterization of Sa exoproteomes under a variety of different conditions. We quantitatively compared the exoprotein profiles of Sa USA300 1) master regulator mutants, Δagr, Δrot, and Δsae grown to stationary phase in either minimal (RPMI) or rich (TSB) media; 2) wild type (WT) USA300 grown to either exponential, early stationary, or late-stationary phase; and 3) 13 different reference Sa strains belonging to four different clonal complexes. Altogether, our study provides a rich data set cataloging the exoproteome of the highly prevalent CA-MRSA in the United States, USA300, and other important Sa isolates.
EXPERIMENTAL PROCEDURES
Bacterial Culture and Growth Conditions
Sa strains were grown at 37 °C on Tryptic Soy Agar (TSA), then in Tryptic Soy Broth (TSB) or Roswell Park Memorial Institute media (RPMI, Invitrogen, Waltham, MA) supplemented with 1% Cassamino Acid. Liquid cultures were grown in 5 ml growth media in 15 ml tubes at a 45° angle or in 150 μl growth media in 96-well plates with shaking at 180 rpm overnight prior to subculture.
Sa Strains and Growth Curve
The construction and validation of the isogenic agr::tet (26, 39), rot::erm (26), and sae::spec (29) have been described.
For growth curves, Sa strain LAC was subcultured at 1:100 in 100 μl TSB or RPMI from 6 independent colonies grown in 150 μl TSB in a 96-well plate with shaking overnight at 180 rpm. Optical densities at 600 nm were read at the beginning of the subculture and at the indicated time points using a PerkinElmer Envision 2103 Multi-label reader (PerkinElmer, Waltham, MA).
Isolation of Primary Human Neutrophils
Leukopaks were obtained from de-identified donors from the New York Blood Center where written consents were obtained from all participants and human polymorphonuclear neutrophils (hPMNs) were purified as described previously (40). hPMNs were resuspended in RPMI 1640 (Cellgro, Herndon, VA) supplemented with 10% fetal bovine serum (FBS).
Cytotoxicity Assay
Cytotoxicity assays were performed as described previously (21, 41). Briefly, culture supernatants were collected from Sa strains sub cultured at 1:100 from overnight cultures in 5 ml TSB or 5 ml RPMI in 15 ml conical tubes at the indicated time points. The culture supernatants were serially diluted and added to 2 × 10⁵ hPMN/well for a final volume of 100 μl/well. hPMNs were intoxicated with the culture supernatant from the indicated Sa strain for 1 h at 37 °C and 5% CO2. hPMN viability was determined using CellTiter 96 Aqueous One Solution (Promega, Madison, WI). Briefly, 10 μl/well of CellTiter was added and incubated at 37 °C and 5% CO2 for 2 h. Cell viability was measured by absorbance at 492 nm using a PerkinElmer Envision 2103 Multilabel reader (PerkinElmer).
Exoprotein Isolation
Sa cultures were grown in 5 ml TSB or RPMI in 15 ml conical tubes for 3, 5, or 8 h in a 1:100 subculture from overnight cultures grown in TSB. Isogenic mutants were grown in TSB for 5 h. All established reference strains were grown in TSB for 5 h. At the indicated time point post-subculture, cultures were normalized to the same optical density by adding respective media to dilute cultures with higher cell density. Culture supernatants were collected by centrifugation at 4000 rpm for 10 min to remove bacteria, followed by filtration through a 0.22 μm filter to remove cell debris. The proteins in the culture supernatants were precipitated in 10% (v/v) trichloroacetic acid (TCA) at 4 °C overnight. The precipitated proteins were sedimented by centrifugation and pellets were washed with ethanol. The protein pellets were centrifuged again, the remaining ethanol was removed and the pellets were allowed to air dry.
Exoprotein Profiling
Precipitated exoproteins were resuspended in 8 m urea for 30 min at RT, then diluted 1:1 with 2× SDS sample buffer and boiled for 10 min. exoproteins were separated in a 12% SDS-PAGE gel and protein visualized using either Coomassie, silver staining, or Instant Blue. The gels were imaged using the Gel Doc XR System (Bio-Rad, Hercules, CA).
Exoprotein Sample Preparation and LC-MS Analysis
Reconstituted exoprotein isolates were reduced with 0.02 m dithiothreitol and alkylated with 0.05 m iodoacetamide. The exoproteins were in-gel digested as described in (42) and the resulting peptide mixture desalted as previously described (see supplemental information for details) (43). Aliquots of the peptide mixtures were loaded onto a Acclaim PepMap 100 precolumn (75 μm × 2 cm, C18, 3 μm, 100 Å) in-line with an EASY-Spray, PepMap column (75 μm × 50 cm, C18, 2 μm, 100 Å) with a 5 μm emitter using the autosampler of an EASY-nLC 1000 (Thermo Scientific, Waltham, MA). The samples were gradient eluted directly into an Orbitrap Fusion Lumos mass spectrometer (Thermo Scientific) and analyzed in a data dependent manner using a top speed method. Complete details of the LC-MS acquisition can be found in the supplemental materials.
Data Analysis
The MaxQuant software suite (version 1.5.2.8) was used for peptide and protein identifications and label-free quantitation (44). For the master regulator mutant and growth curve studies the raw data was searched against a UniProt USA300 protein database downloaded on August 31, 2016 containing 2607 entries. For the first search the peptide tolerance was set to 20 ppm and for the main search peptide tolerance was 4.5 ppm. Trypsin specific cleavage was selected with 2 missed cleavages. A peptide spectral match (PSM) FDR of 1% and a Protein FDR of 1% was selected for identification. Label-free quantitation was performed with a label-free quantitation minimum ratio of 2 and allowing for unique peptides only. Matching between runs was allowed with a 0.7 min match window and a 20-min alignment time window. Carbamidomethylation of Cys was added as a static modification. Oxidation of Met, deamidation of Asn and Gln and acetylation of the protein N terminus were the allowed variable modifications.
Results were filtered to include proteins identified with 2 or more unique peptides in at least all three replicates of one strain type. Label-free quantitation intensity values were log2 transformed, missing values were imputed from the normal data distribution, and z-scores were calculated. A z-score indicates how many standard deviations a value is from the mean ((z = (X − μ)/σ), X = value, μ = population mean, σ = standard deviation). Unsupervised hierarchical clustering is used to generate a heat map from the z-scores representing protein groups in the matrix as colors and grouping exoprotein isolates based on the relative intensities of the quantified proteins.
For the reference strain comparison analysis, the raw files were searched against a combined NCBI database containing individual databases for 12 strains (LAC and SF8300 are both USA300) consisting of 33,067 entries (COL: 2788, MW2: 2767, Mu50: 2851, EMRSA16: 2772, LAC: 2560, MRSA252: 2852, MSSA476: 2619, N315: 2755, NCTC8325: 2767, Newman: 2624, 502A: 2729, and USA500: 2983). The parameters were the same as above except matching between runs was not allowed.
Comparative analysis of protein sequences was done using orthologous genes as defined by “Reciprocal Best Hits” (RBH) comparisons based on BLAST searches to compile protein groups (45). In short, a RBH is found when the proteins encoded by the sequences of two genes from two different genomes find each other as the best scoring match in the other genome. To compare the expression of the orthologs across all the reference strains of interest, we selected one strain to serve as a pivot-strain (LAC) and proceeded to search for reciprocal best blast hits for every one of its gene loci. In the cases where no RBH was found with another strain, it was assumed that no ortholog was present for that strain. In order to ensure quantitation of orthologs based strictly on comparable mass spectrometry features, protein quantitation was limited only to peptides present in the predicted amino acid sequence of all defined orthologs for a given pivot gene locus and no other protein entry (i.e. the peptides must be present in all putative orthologues and must be unique to the putative ortholog group).
For each of the resulting putative ortholog groups, the number of peptide spectral matches (PSMs) reported by MaxQuant for all ortho-conserved and ortho-unique peptides was averaged across all experimental replicates to yield the average intensity per ortholog group and experimental condition pairing. The resulting dataset was clustered in the R statistical software package using complete linkage agglomerative clustering and 1 − r as the distance measure, where r is defined as the Pearson coefficient.
The resulting heat map is shown in Fig. 7A, color coded by Z-score (normalized per row). Toxicity assay results are also shown (using a similar but linear color-coding from minimum toxicity in white to maximum toxicity in purple). The functional category of the secretome genes are color coded as follows: immunomodulators in green, exoenzymes in blue and cytotoxins in red.
Fig. 7.

The effect of clonal lineages on the exoprotein production by a group of diverse Sa reference strains. A, Heat map of protein quantitation data for the selected virulence factors. The color scheme represents a row-based z-score on a scale from dark purple (most PSMs) to white (fewest PSMs). The protein class is designated by color on the left y axis and the common protein IDs are labeled on the right y axis. Immunomodulators are indicated in green, exoenzymes in blue, and cytotoxins in red. The strain names are indicated along the bottom x axis. The average cytotoxicity using the 5% dilution of the culture filtrate is shown for each strain at the top of the heat map. The same color scheme is used as for the protein data (i.e. the cytotoxicity data was also transformed to z-scores; dark purple (most cytotoxic) to white (least cytotoxic)). The expression of orthologues was compared across the reference strains using LAC as the pivot-strain. The reciprocal best blast hits for every selected virulence factor in each reference strain were determined, peptide intensities for all ortho-conserved and ortho-unique PSMs were summed, results were log10 transformed and z-scores were calculated. The resulting data was clustered using complete linkage agglomerative clustering and 1-r as the distance measure, where r is defined as the Pearson correlation. B, The cytotoxicities of all 13 reference strains is plotted. A higher percent of dead cells (hPMNs) indicates greater cytotoxicity. Intoxication of hPMNs (from three donors ± the standard error of mean) with a titration of culture filtrates from the reference strains. Cell death was measured with CellTiter metabolic dye. The CC8 strains are the most cytotoxic strains, CC5 strains are moderately cytotoxic, and the CC1 and CC30 strains have low cytotoxicity.
Experimental Design and Statistical Rationale
For the virulence factor regulator mutant studies three biological replicates were used for each WT, Δrot, Δagr, and Δsae grown in both minimal and rich media for a total of 24 individual samples. All 24 samples were prepared in parallel and analyzed via LC-MS in a randomized order. We also isolated exoproteins from bacteria grown in minimal and rich media at 3, 5, and 8 h in triplicate for a total of 18 individual samples. The growth curve samples were prepared in parallel and again analyzed in random order via LC-MS. Results were filtered to include proteins identified with 2 or more unique peptides in at least all three replicates of one strain type. The Sa reference strain analysis used three biological replicates for each of the 13 strains, except for Newman because of contamination of one replicate we had biological duplicates. The 38 samples were prepared in parallel and analyzed via LC-MS in a random order.
RESULTS
The Effect of Nutrient Availability On the Exoproteome of USA300 Master Regulator Mutants
Bacterial virulence is dependent on its environment and genetic background. To better understand virulence changes associated with environmental and strain variation, we cataloged changes in the Sa exoproteome using label-free quantitative proteomics of the representative USA300, strain LAC (WT), and isogenic mutants (Δrot, Δagr, and Δsae) grown to early stationary phase in nutrient rich or minimal media. Three separate experiments per growth medium were performed to obtain a robust data set that will serve as a resource for the research community. We quantified 595 proteins across all strains, requiring two or more unique peptides per protein in at least all three replicates of one sample type. Approximately 65% (385/595 proteins) of the identified proteins were detected in all culture filtrates (supplemental Figs. S1A–S1B). Overall the protein secretion levels were similar for strains grown in rich versus minimal media (supplemental Fig. S1C–S1E). The Δrot strain secreted the highest level of overall protein in both minimal and rich media compared with WT, Δagr, and Δsae strains (supplemental Fig. S1E). This finding is consistent with the known potent repressive role of Rot for the genes that encode for exoproteins (21, 39). It is worth noting that unsupervised hierarchical clustering of the protein data revealed that Δrot exoproteomes are more similar to each other regardless of the medium condition. However, clustering of the WT, Δagr, and Δsae strains was driven by nutrient availability (Fig. 1). Importantly, clustering showed the high reproducibility of the replicate samples and the techniques.
Fig. 1.
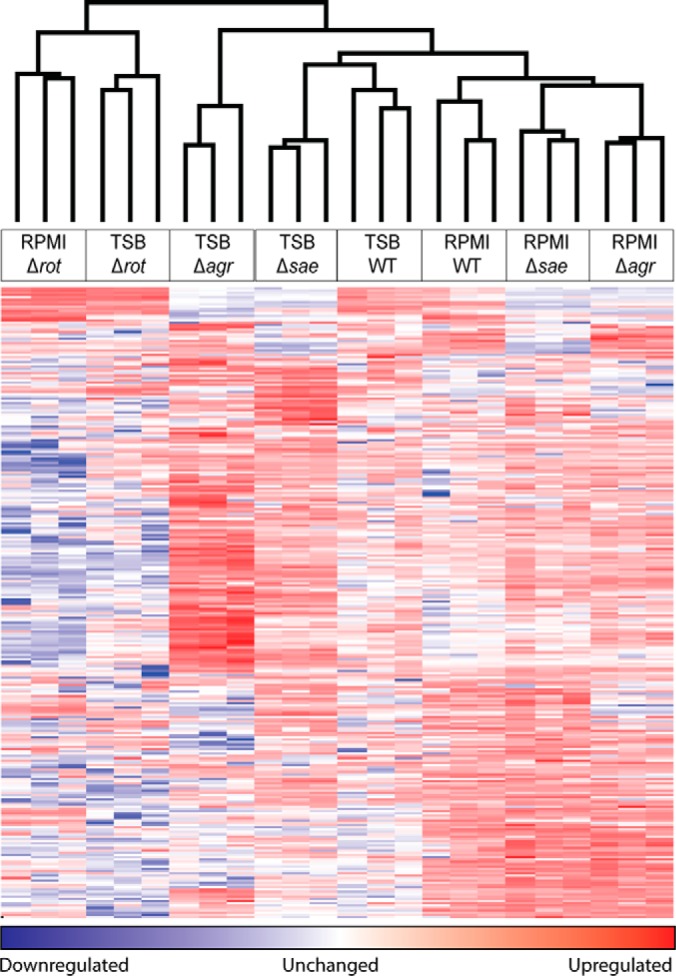
Label-free mass spectrometry quantitation differentiates isogenic Sa mutant exoprotein profiles. A heat map of the protein quantitation data generated using unsupervised clustering is shown. LFQ intensity values were log2 transformed, missing values were imputed from the normal data distribution, and z-scores were calculated. A z-score indicates how many standard deviations a value is from the mean ((z = (X − μ)/σ), X = value, μ = population mean, σ = standard deviation). Unsupervised hierarchical clustering is used to generate a heat map from the z-scores representing protein groups in the matrix as colors. Each row in the heat map is a different protein group and each column is an individual sample. The clustering at the top indicates which samples are most closely related based on the relative intensity of the quantified protein groups. Unsupervised hierarchical clustering confirms that the replicates tightly cluster showing high reproducibility of the workflow.
Next, we examined the secretion of three classes of virulence factors in these mutants: immunomodulators, exoenzymes, and cytotoxins (Table I). Although certain classes show a general trend of increase or decrease, not all proteins in a group followed the same trend, nor exhibited a similar fold change. For instance, the rot mutant showed decreased secretion of immunomodulatory proteins compared with WT (Fig. 2A) and increased secretion of exoenzymes and cytotoxins (Figs. 2B–2C). However, the coagulases (Coa and Vwbp) were lower in abundance in this mutant (Fig. 2B). We did not detect the secreted PSMα 2 and 4 toxins in the Δagr mutant, data consistent with the requirement of the Agr system for the expression of these virulence factors (46). Altogether, analyses of the exoproteome profiles of the WT LAC strain and the isogenic master regulator mutants demonstrated that deletion of the master regulators affect global protein secretion; the overall trends of immunomodulators, exoenzymes, and cytotoxins secretions when compared with WT were similar in minimal and rich media.
Table I. Staphylococcus aureus virulence factors grouped based on functional classes with UniProt identifier, common protein names, USA300 gene identifiers, and common protein names. These proteins represent three major classes of virulence factors which are highlighted in this study to understand cytotoxicity and other virulence behaviors.
| Protein class | Protein function | Uniprot accession | Common protein ID | USA300 gene ID | Protein name |
|---|---|---|---|---|---|
| Immunomodulators | Bind to IgG and prevent opsonization | A0A0H2XJH7 | SPA | SAUSA300_0113 | Immunoglobulin G binding protein A |
| Bind to IgG and prevent opsonization | Q2FE79 | SBI | SAUSA300_2364 | Immunoglobulin-binding protein sbi | |
| Inhibit chemotaxis of phagocytes | Q2FHS7 | FLR | SAUSA300_1053 | FPRL1 inhibitory protein | |
| Inhibit chemotaxis of phagocytes | A0A0H2XIW0 | EAP | SAUSA300_0883 | Putative surface protein | |
| Complement inactivation/Fibrinogen-binding proteins | A0A0H2XG16 | CLFA | SAUSA300_0772 | Clumping factor A | |
| Complement inactivation | Q2FJ77 | SDRE | SAUSA300_0548 | Serine-aspartate repeat-containing protein E | |
| Complement inactivation | Q2FG07 | ISDH | SAUSA300_1677 | Iron-regulated surface determinant protein H | |
| Complement inactivation/Fibrinogen-binding proteins | A0A0H2XH00 | ECB | SAUSA300_1052 | Fibrinogen-binding protein | |
| Complement inactivation/Fibrinogen-binding proteins | A0A0H2XIH9 | EFB | SAUSA300_1055 | Fibrinogen-binding protein | |
| Complement inactivation | A0A0H2XFS8 | SAK | SAUSA300_1922 | Staphylokinase | |
| Fibrinogen-binding proteins/Surface-bound adhesins | Q2FE03 | FNBA | SAUSA300_2441 | Fibronectin-binding protein A | |
| Fibrinogen-binding proteins/Surface-bound adhesins | A0A0H2XKG3 | FNBB | SAUSA300_2440 | Fibronectin binding protein B | |
| Surface-bound adhesins | A0A0H2XHK2 | CLFB | SAUSA300_2565 | Clumping factor B | |
| Surface-bound adhesins | Q2FJ78 | SDRD | SAUSA300_0547 | Serine-aspartate repeat-containing protein D | |
| Exo-enzymes | Protease | Q2FFS9 | SPLF | SAUSA300_1753 | Serine protease SplF |
| Protease | Q2FFT0 | SPLE | SAUSA300_1754 | Serine protease SplE | |
| Protease | Q2FFT3 | SPLD | SAUSA300_1755 | Serine protease SplD | |
| Protease | Q2FFT1 | SPLC | SAUSA300_1756 | Serine protease SplC | |
| Protease | Q2FFT2 | SPLB | SAUSA300_1757 | Serine protease SplB | |
| Protease | Q2FFT4 | SPLA | SAUSA300_1758 | Serine protease SplA | |
| Protease | A0A0H2XGH9 | SSPB | SAUSA300_0950 | Cysteine protease | |
| Protease | A0A0H2XDQ5 | AUR | SAUSA300_2572 | Zinc metalloproteinase aureolysin | |
| Lipase | A0A0H2XK15 | PLC | SAUSA300_0099 | 1-phosphatidylinositol phosphodiesterase | |
| Lipase | A0A0H2XI72 | GEH | SAUSA300_0320 | Triacylglycerol lipase | |
| Hyaluronidase | A0A0H2XIY1 | HYSA | SAUSA300_2161 | Hyaluronate lyase | |
| Nuclease | A0A0H2XHI2 | NUC | SAUSA300_0776 | Thermonuclease | |
| Coagulase | A0A0H2XHP9 | COA | SAUSA300_0224 | Staphylocoagulase | |
| Coagulase | A0A0H2XEN7 | VWBP | SAUSA300_0773 | Putative staphylocoagulase | |
| Cytotoxins | Leukocidins | Q2FFA2 | LUKA | SAUSA300_1975 | Uncharacterized leukocidin-like protein 2 |
| Leukocidins | A0A0H2XI46 | LUKS-PV | SAUSA300_1382 | Panton-Valentine leukocidin, LukS-PV | |
| Leukocidins | A0A0H2XFK0 | LUKF-PV | SAUSA300_1381 | Panton-Valentine leukocidin, LukF-PV | |
| Leukocidins | Q2FFA3 | LUKB | SAUSA300_1974 | Uncharacterized leukocidin-like protein 1 | |
| Leukocidins/hemolysins | A0A0H2XFN4 | LUKD | SAUSA300_1768 | Leukotoxin LukD | |
| Leukocidins/hemolysins | A0A0H2XJW6 | LUKE | SAUSA300_1769 | Leukotoxin LukE | |
| Leukocidins | P0C817 | PSMA4 | SAUSA300_0424.1 | Phenol-soluble modulin alpha 1 peptide | |
| Leukocidins | P0C7Y0 | PSMA2 | SAUSA300_0424.4 | Phenol-soluble modulin alpha 2 peptide | |
| Hemolysin | A0A0H2XEW5 | HLA | SAUSA300_1058 | Alpha-hemolysin | |
| Leukocidins/hemolysins | A0A0H2XIG9 | hlgA | SAUSA300_2365 | Gamma-hemolysin component A | |
| Leukocidins/hemolysins | A0A0H2XH48 | HLGB | SAUSA300_2367 | Gamma-hemolysin component B | |
| Leukocidins/hemolysins | A0A0H2XFL0 | HLGC | SAUSA300_2366 | Gamma-hemolysin component C |
Fig. 2.

The effect of nutrient availability on the exoproteome of Sa master regulator mutants as investigated through the analysis of the levels of secretion of three major classes of virulence factors. The log2 ratio of protein LFQ values from the mutant versus LAC WT are plotted for (A) immunomodulators, (B) exoenzymes, and (C) cytotoxins. Minimal medium (RPMI) values are in red and nutrient rich medium (TSB) are in blue. A positive value indicates the protein is detected at a higher intensity in the mutant than in the LAC WT. A negative value indicates the protein is detected at a higher intensity in the LAC WT than the mutant. All proteins are labeled with the corresponding common protein identifier. Error bars represent the standard deviation of the triplicate analyses. If a protein is only identified in the LAC WT samples the value is set to the minimum of the axis (-15) and if a protein is only identified in the mutant the value is set to the maximum of the axis (+15) and represented by a pale, dotted bar.
To correlate our proteomic data to the virulence potential of these strains, we utilized a cytotoxicity assay to evaluate the ability of the exoproteins from each strain to kill hPMNs. Culture filtrate from the Δrot strain was more cytotoxic to hPMNs than the WT strain (Fig. 3A). Culture filtrate from the Δsae strain lacked cytotoxic activity toward hPMNs (Fig. 3A), consistent with the observation that Sae is indispensable for toxin production (29). The cytotoxicity of the Δagr strain grown in rich medium was very low, but surprisingly, when the mutant strain was grown in minimal medium, it exhibits enhanced cytotoxicity (Fig. 3B). Examination of the label-free quantitation data showed that the Δagr mutant had lower production of cytotoxins compared with WT (Fig. 2C). However, the bi-component leukocidin LukAB was more abundant in the exoproteome when Δagr Sa was grown in minimal medium compared to rich medium (p value >0.05) (Fig. 3B). LukAB has been shown to be the dominant cytotoxic factor in the culture supernatants of Sa (41, 47, 48), thus we speculate that the cytotoxic activity observed in Δagr grown in minimum medium is likely caused by this toxin. All together these data suggest that agr deficiency in a nutrient limited environment can contribute to Sa virulence, consistent with the observations that agr deficient strains are commonly isolated from both nasal carriers and bacteremic patients (49).
Fig. 3.

The effect of nutrient availability on the cytotoxicity of mutant Sa. A, Cytotoxicity assay data is plotted for LAC WT and each mutant, where a higher percent of dead cells (hPMNs) indicates greater cytotoxicity. Intoxication of hPMNs from six donors ± the standard error of mean with titration of culture filtrates from the indicated Sa LAC strains grown in rich (TSB) or minimal media (RPMI). Cell death was measured with CellTiter metabolic dye. The culture filtrate from Δagr grown in minimal medium has a cytotoxicity closer to LAC WT, but grown in rich medium the cytotoxicity is drastically reduced. A two-way ANOVA was performed comparing means using Sidak correction for multiple comparisons. Data points with p values less than 0.05 are considered significant and are indicated by the following key: 0.01–0.05 = *, 0.01–0.001 = **, 0.001–0.0001 = ***, and <0.0001 = ****. B, The average LFQ intensity values for the selected cytotoxins are plotted with minimal medium in red and rich medium in blue. Error bars represent the standard deviation of the triplicate analyses. All proteins are labeled with the corresponding protein ID. The intensity of the monomers of the bi-component leukocidin LukAB from Δagr grown in minimal medium is significantly higher than that grown in rich medium. A two-way ANOVA was performed as described above.
The Effect of Nutrient Availability and Culture Density on USA300 Exoproteome
Next, we investigated the effect of the different bacterial growth phases on the overall exoproteome of LAC. We collected culture filtrates from exponential (3 h), early stationary (5 h), and late stationary (8 h) growth phases in either minimal or rich media (Fig. 4A). These times were selected because during the early stages of infection (analogous to the exponential phase), the bacterium devotes significant resources to upregulate the production of adhesins and immunomodulators, but as the population density increases (early and late stationary phases), the secretion switches to exoenzymes and toxins that cause tissue damage and extend pathogenesis (19, 20). Thus, we postulated secretion profiles at these three time points would reveal changes in the expression of different functional protein classes.
Fig. 4.
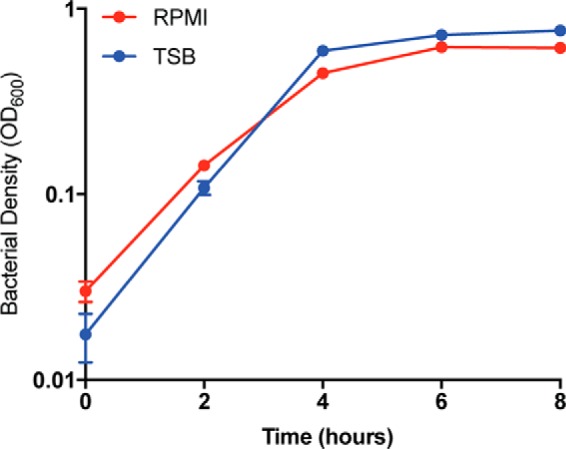
Sa grows to a higher density when grown in a nutrient rich environment. The optical density at 600 nm of four independent colonies of LAC WT grown in both minimal (RPMI) and rich (TSB) media was measured at t = 0, 2, 4, 6, and 8 h. Minimal medium (RPMI) colony density is plotted in red and rich medium (TSB) is plotted in blue. The density of the cultures after 2 h is slightly higher when grown in a nutrient rich environment.
Three separate experiments per growth media were performed to obtain a robust data set. We quantified 438 proteins across all conditions, requiring 2 or more unique peptides per protein in at least all three replicates of one sample type. Only a few proteins were unique between the time points and across the growth conditions (supplemental Figs. S2A–S2B). Unsupervised hierarchical clustering showed that there was more variability during the exponential phase compared with stationary phase samples, possibly because of sample handling and low protein amounts (supplemental Fig. S2D).
We again investigated the abundance of the three classes of virulence factors: immunomodulators, exoenzymes, and cytotoxins in these nutrient-growth phase combinations (Table I). Irrespective of nutrient conditions, secretion of most immunomodulator proteins was highest in exponential growth phase (5 vs 3 h and 8 vs 3 h, Fig. 5A). One protein that did not fit this trend was staphylokinase (Sak), which is more abundant at early stationary phase in minimal medium (8 vs 5 h; Fig. 5A). In contrast, abundances of exoenzymes were high at stationary phase compared with exponential phase (5 vs 3 h). Interestingly, levels of certain proteases (SplA-F) increased further at late stationary phase (8 vs 5 h) (Fig. 5B). Two proteins that deviated from this trend were the coagulases, Coa and Vwbp, both of these enzymes were most abundant at exponential phase, but their levels dwindled at stationary phase (Fig. 5B).
Fig. 5.

The effect of nutrient availability and culture density on the exoproteome as investigated through the analysis of three major classes of virulence factors. The log2 ratio LFQ intensities of exoproteins from LAC WT at two time points (5/3 and 5/8 h) are plotted for (A) immunomodulators, (B) exoenzymes, and (C) cytotoxins. Minimal medium (RPMI) values are in red and nutrient rich medium (TSB) are in blue. A positive value indicates the protein is detected at a higher intensity in the later time point. A negative value indicates the protein is detected at a higher intensity in the earlier time point. All proteins are labeled with the common protein ID. Error bars represent the standard deviation of the triplicate analyses. If a protein is only identified at one time point the value is set to the maximum or minimum of the axis (± 10) and represented by a pale, dotted bar.
Cytotoxin secretion was similar to that of exoenzymes regardless of nutrient conditions (Fig. 5C). This functional class was highly abundant in the culture filtrates of stationary phase bacteria (5 vs 3 h and 8 vs 3 h). The bi-component toxins are an important class of cytotoxins with high lytic activities on hPMNs (16). Thus, to correlate bi-component toxin levels in culture filtrates to phenotypic functionality, we performed cytotoxicity assays using culture filtrates of LAC (Fig. 6A). First, consistent with the observation by mass spectrometry that toxin production increased at stationary phase, culture filtrates from the stationary phase were more cytotoxic toward hPMNs compared with the ones from exponential phase. Second, late-stationary phase culture filtrates had a moderate reduction in cytotoxicity compared with early-stationary phase supernatants (5 vs 8 h TSB/RPMI, Fig. 6A), perhaps owing to the increased protease presence in late stationary phase (Fig. 5B), which results in degradation of proteins in the culture filtrate (50). Lastly, LukAB and LukSF-PV have been reported to be the most potent in lysing hPMNs (47). In fact, culture filtrates lacking either of these toxins have led to reduced cytotoxicity toward hPMNs (47). Therefore, we compared the abundances of these two cytotoxins in the various growth phases under different media conditions. Consistent with our data (Fig. 6A), we observed that increased cytotoxicity correlated with higher abundance of LukAB and LukSF-PV during stationary phase (5 and 8 h). Interestingly, we observed significantly higher levels of LukAB in the exoproteomes of Sa grown in minimal medium during stationary phase, but LukSF-PV is up-regulated in stationary phase when Sa is grown in nutrient rich medium (Fig. 6B). These are interesting observations that will require further investigation.
Fig. 6.
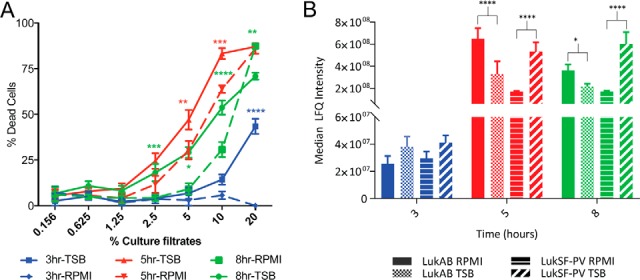
The effect of nutrient availability and culture density on the cytotoxicity of Sa. A, Cytotoxicity assay data is plotted for LAC WT grown in both environments at the three time points. A higher percent of dead cells (hPMNs) indicates greater cytotoxicity. Intoxication of hPMNs (from six donors ± the standard error of mean) with a titration of culture filtrates from LAC WT grown in rich (TSB) or minimal media (RPMI) is shown. Cell death was measured with CellTiter metabolic dye. There is a statistically significant increase in the cytotoxicity of the bacteria grown in rich medium as compared with those grown in minimal medium. A two-way ANOVA was performed comparing means using Sidak correction for multiple comparisons. Data points with p values less than 0.05 are considered significant and are indicated by the following key: 0.01–0.05 = *, 0.01–0.001 = **, 0.001–0.0001 = ***, and <0.0001 = ****. B, The median LFQ intensities of the bi-component leukocidins are plotted at log phase (3 h - blue), early stationary phase (5 h - red), and late stationary phase (8 h - green). Bars representing LukAB from Sa grown in minimal medium are solid, LukSF-PV are lined, and bars representing LukAB from Sa grown in rich medium are checkered, LukSF-PV are slashed. The level of LukSF-PV plateaus at stationary phase, but LukAB is levels are highest during early stationary phase and decrease in late stationary phase. Interestingly, at both early and late stationary phase LukAB is more abundant than LukSF-PV when Sa is grown in minimal medium, but the reverse is true when Sa is grown in a nutrient rich environment. A two-way ANOVA was performed as described above.
The Effect of Clonal Lineages On the Exoprotein Production by Diverse Sa Reference Strains
Our data demonstrates that label-free quantitation can predict cytotoxicity of a strain based on the exoproteome alone (Figs. 3 and 6). We next extended this hypothesis to test our ability to predict the cytotoxic profiles of 13 Sa reference strains representing four CCs (Table II). These strains include CA-MRSA, hospital-associated MRSA (HA-MRSA), methicillin-sensitive Sa (MSSA), and vancomycin-intermediate Sa (Table II). Label-free quantification showed that each reference strain has a unique exoprotein profile (Fig. 7A). Because a large majority of Sa infections in the USA belong to CC8 (51–54), we included six different CC8 strains. We examined the abundance of three classes of virulence factors: immunomodulators, exoenzymes, and cytotoxins in these reference strains. The proteomics data reproduces the CC8 genomic cluster except for COL (Fig. 7A). Interestingly, the cytotoxicity data supports the placement of COL outside of the CC8 cluster in agreement with the exoproteome profile (Fig. 7B). In addition, the exoproteome profiles suggest other distinct differences between strains within the CC8 group (Fig. 7A). For example, two representative CA-MRSA strains in our collection, LAC and SF8300, were among the most cytotoxic to hPMNs (Fig. 7B) and their exoproteomes are distinct from the other CC8 strains (Fig. 7A). The CC8 strain, Newman, while also highly cytotoxic (Fig. 7B) lacks LukSF-PV as expected due to these lack of these genes, lukS-PV and lukF-PV, in this strain. In comparing the highly cytotoxic CC8 cluster, higher levels of HlgA, HlgB, and HlgC are present in the exoproteome of Newman, whereas LukAB are present at a similar level in the exoproteomes of LAC, SF8300, and Newman (Fig. 7A). The higher level of toxins in the Newman exoproteome is consistent with the findings that this strain harbors a hyperactive saeS allele, which results in increased exoproteome production (55–57) and high cytotoxicity (Fig. 7B). Notably, USA500 has a large abundance of exo-enzymes and cytotoxins, consistent with what is known in literature (21). The CC5 strains Mu50, 502A, and N315 cluster together with the CC1 strains (Fig. 7A). Closer examination reveals the driving force for this cluster is the overall lower production of all exoproteins and a subset of immunomodulators involved in attachment to host tissues (Fig. 7A). Overall, our data suggest that proteomic data could be used to deduce the cytotoxic potential of diverse strains belonging to various CCs.
Table II. Staphylococcus aureus reference strains with clonal complex assignment. Table II indicates the clonal complex of the reference strain as determined by MLST. Also included is whether the strain is MRSA or MSSA. If a strain is MRSA then we differentiate between hospital-associated (HA) or community-associated (CA), if the strain is positive for pvl, and if it is a vancomycin intermediate strain (VISA). A mix of HA and CA strains were used for this study. The selection of reference strains dominantly represents CC8, which is the class of Sa strains that most commonly causes infection in the USA. (HA*) USA500 is annotated as HA* because there is not good epidemiological data for this strain and it has features of both HA and CA strains. (**) 502A was originally isolated from a neonate nurse in the 1960s, but was used for bacterial interference programs in the 1960s–1970s (75).
| STRAIN | CLONAL COMPLEX | VISA | MRSA | MSSA | HA-MRSA/CA-MRSA | pvl |
|---|---|---|---|---|---|---|
| LAC | CC8 | x | CA | + | ||
| SF8300 | CC8 | x | CA | + | ||
| Newman | CC8 | x | ||||
| USA500 | CC8 | x | HA* | |||
| COL | CC8 | x | HA | |||
| NCTC8325 | CC8 | x | ||||
| 502A | CC5 | x | ** | |||
| N315 | CC5 | x | HA | |||
| Mu50 | CC5 | x | x | HA | ||
| EMRSA16 | CC30 | x | HA | |||
| MRSA252 | CC30 | x | HA | |||
| MSSA476 | CC1 | x | ||||
| MW2 | CC1 | x | CA | + |
DISCUSSION
Sa is a significant human pathogen that has evolved a large repertoire of secreted and cell surface tethered virulence factors to colonize multiple tissue sites and cause various disease states (6). In this study, we used a multi-factorial approach to characterize the Sa exoproteome and correlate changes in exoproteomes with the cytotoxic potential of the conditions tested. Analyzing the Sa exoproteome can be a daunting task, given that hundreds of proteins are secreted or surface-bound (58). Here, we have attempted to simplify the study of such large exoproteome data sets by grouping exoproteins based on virulence function (immunomodulators, exoenzymes and cytotoxins) and by focusing on several representative proteins of each group. This strategy allowed us to identify trends in the secretion of these important virulence factors.
First, we validated our label-free mass spectrometry strategy by comparing proteomes of known regulatory mutants, Δagr, Δsae and Δrot, in nutrient-rich and minimal media. Second, we compared exoproteomes of LAC grown to various growth phases in rich and minimal media. These data sets identified the virulence factors secreted at both low and high cell densities, mimicking conditions of early Sa infection (exponential growth phase) and a state of quorum (early- and late-stationary growth phases). Last, we extended these analyses to a larger set of reference strains to assess if the exoproteome profiling is indicative of strain-specific cytotoxicity.
In our study we used isogenic mutants of master regulators that are well characterized in the literature (21–26, 31, 32). We selected these specific mutants not only for validation, but also to evaluate if label-free quantitation can provide insights into Sa biology. For instance, we found that inactivation of the repressor, rot, led to a dramatic increase in protein abundance in the culture filtrates (supplemental Fig. S1E); however, few unique protein species were detected in this mutant compared with WT, Δagr and Δsae (supplemental Fig. S1A–S1B). The in vitro biology and the in vivo relevance of this finding would be an interesting area to investigate in future studies. Likewise, we found that mutation of the agr locus grown in rich medium abrogated Sa virulence with respect to its cytotoxic potential toward hPMNs (Fig. 3A). However, culture filtrates from the same strain grown in minimal medium still exhibited high levels of cytotoxicity (Fig. 3A). On closer analyses, we found that the cytotoxin LukAB was more abundant in the exoproteome when Sa Δagr was grown in minimal verses rich media (p value <0.0001), potentially accounting for the differences in cytotoxicity (Fig. 3B). This finding suggested an agr-independent but media-dependent mechanism by which these cytotoxins are produced.
In an effort to understand protein variations during various Sa growth phases, we compared the exoprotein profile at different phases of growth. Our results corroborate what is found in literature regarding the cell density-induced protein profile of Sa (Figs. 5 and 6) (20, 24, 59). Of note, the immunomodulatory protein Sak was ∼2-fold higher in minimal medium stationary phase culture filtrates compared with the same time point in rich medium and other proteins in this category (Fig. 5A). Additionally, the coagulases (Coa and Vwbp) exhibit profiles more similar to immunomodulators rather than the other evaluated exoenzymes (Fig. 5B). Taken together, our data set allows us to identify groups of proteins that did not follow the trend of their functional classes and could be subjects of future studies.
Multiple efforts to understand Sa virulence have used comparative transcriptomics (59–63) to study specific changes in the Sa virulon. Such methods like RNA-Seq or microarrays inform us about regulatory changes at the genomic level. However, these results may not reflect actual levels of secreted effector molecules. In contrast, the exoproteome is a true indicator of virulence factor levels, and potentially Sa pathogenesis (64). We and others have successfully exploited this strategy to study Sa virulence properties (42, 65, 66). However, these studies have largely compared exoproteomes of single mutants to their WT counterparts (26, 67, 68) or have elucidated secretion profiles of one strain in different nutrient conditions (69–71). In this study, we use label-free quantitation analysis to generate a large, multicomponent data set comparing exoproteomes in various combinations of different growth phases, nutrient environment and genetic background, thus generating a powerful data set to further studies of Sa pathobiology.
We used minimal (RPMI) and rich (TSB) media to mimic environmental conditions encountered by Sa in vivo. Observed differences in the secretion profiles of Sa grown in minimal and rich media suggest the need for greater understanding in the regulation of Sa virulence factor productions. Additionally, our study highlights the importance of nutrient availability for the design of in vitro experiments to better address the expressions of virulence factors under different conditions.
We have shown the power of label-free quantitative proteomics for the prediction of the potential virulence of Sa strains. As the pathogen evolves to evade the host immune system, profiling of the exoproteome could assist in predicting the virulence potential of new emerging strains, which is critical to improve treatment and prevention methods. However, comparing the exoproteome across different bacterial strains presents a technical challenge. Usually quantitative comparisons using mass spectrometry are done across proteomes with similar background where very few of the proteins differ and most of the proteins do not change. In stark contrast, the exoproteome of Sa strains shows a large diversity of protein variants, including gene deletions, gene duplications (paralogues) or allelic differences (orthologues). The most common workflow in proteomics involves analysis of the proteomes after proteolytic digestion into peptides rather than intact proteins. Peptide sequences are then characterized using mass spectrometry and the sequence in turn credited to a protein or protein isoforms, which is in turn linked to a gene. Here, searching the peptide database against a database containing all analyzed strains resulted in matches to multiple protein orthologues and paralogues. Further confounding the analysis of the mass spectrometric data is that genome annotation of different Sa strains is neither uniform nor complete, and the entire sequence of a protein is generally not observed by mass spectrometry. Indeed, the sequence coverage of a protein can differ dramatically (∼3–100%). Thus, it is challenging to group the peptide data and allow for a one to one comparison across different strains. For instance, the leukocidins are known to differ between strains and share sequence similarities between family members (16, 72), as evident by pronounced cross reactivity of anti-leukocidin antibodies (73). To be able to align the gene products of the 13 strains, we compiled protein groups of all 13 strains using orthologous genes as defined by “Reciprocal Best Hits” (RBH) comparisons based on BLAST searches (45). To compare the production of the orthologues across all the reference strains of interest, we selected one strain to serve as a pivot-strain (LAC) and proceeded to search for reciprocal best blast hits for every one of its gene loci. This procedure allowed us to compare across the 13 strains while avoiding orthologs with different enough amino acid sequences to appear as a separate protein groups and thus allowing direct comparison of that ortholog across all strains. However, to ensure that quantitation of orthologues is based strictly on comparable mass spectrometry features (i.e. identical peptides), quantitation was restricted to peptides present in the predicted amino acid sequence of all defined orthologues for a given pivot gene locus and no other protein entry (i.e. the peptides must be present in all putative orthologues and must be unique to the putative orthologue group).
Going forward, we believe our strategy of combining mass spectrometry with the computational alignment of orthologues and paralogues (a pangenome) will be an increasingly important tool to comprehensively characterize the exoproteome (74). We believe that with careful data integration and analysis, exoproteome characterization has the potential to become an indispensable tool for predicting the potential virulence of pathogens, especially in the case of new emerging strains.
DATA AVAILABILITY
All raw mass spectrometry data and search results have been deposited to the ProteomeXchange Consortium via the MassIVE partner repository with the data set identifiers: ProteomeXchange PXD005203 and MassIVE MSV000080260.
Supplementary Material
Footnotes
Author contributions: J.R.C., D.B., K.T., B.S., V.J.T., and B.U. designed research; J.R.C., D.B., and K.T. performed research; R.C. contributed new reagents or analytic tools; J.R.C., D.B., K.T., M.A., R.C., V.J.T., and B.U. analyzed data; J.R.C., D.B., K.T., M.A., B.S., V.J.T., and B.U. wrote the paper.
* This work was supported by the Shared Instrumentation Grant 1S10OD010582 to BU from the National Institute of Health for the purchase of an Orbitrap Fusion Lumos mass spectrometer, the US National Institute of Allergy and Infectious Diseases (NIAID) under award numbers AI099394, AI105129 to VJT, and AI103268 to BS and VJT. JRC, DB, KT, RC, BS, BU, and VJT were also supported in part by a National Institute of Allergy and Infectious Diseases award 272201400019C. VJT is a Burroughs Wellcome Fund Investigator in the Pathogenesis of Infectious Diseases. DB was supported in part by a Departmental Vilcek and Goldfarb endowed fellowship from the NYU School of Medicine Department of Microbiology. The content is solely the responsibility of the authors and does not necessarily represent the official views of the National Institutes of Health.
 This article contains supplemental material.
1 The abbreviations used are:
- Sa
- Staphylococcus aureus
- agr
- accessory gene regulator
- Asn
- asparagines
- CA
- community associated
- CC
- clonal complex
- Cys
- cysteine
- FDR
- false discovery rate
- Gln
- glutamine
- HA
- hospital associated
- hPMNs
- human polymorphonuclear leukocytes or neutrophils
- LFQ
- label-free quantitation as calculated by MaxQuant
- Met
- methionine
- MLST
- multilocus sequence typing
- MRSA
- Methicillin-resistant Staphylococcus aureus
- MSSA
- Methicillin-sensitive Staphylococcus aureus
- NETs
- neutrophil extracellular nets
- PSM
- peptide spectral match
- pvl
- Panton–Valentine leukocidin gene
- Rot
- repressor of toxins
- RPMI
- Roswell Park Memorial Institute medium-Cassamino acid
- Sae
- Sa exoprotein expression
- SCCmec
- staphylococcal cassette chromosome mec
- ST
- strain type
- TSB
- Tryptic Soy Broth
- WT
- wild type
- TCS
- Two-component system.
REFERENCES
- 1. Diekema D. J., Pfaller M. A., Schmitz F. J., Smayevsky J., Bell J., Jones R. N., Beach M., and Group S. P. (2001) Survey of infections because of Staphylococcus species: frequency of occurrence and antimicrobial susceptibility of isolates collected in the United States, Canada, Latin America, Europe, and the Western Pacific region for the SENTRY Antimicrobial Surveillance Program, 1997–1999. Clin. Infect. Dis. 32, S114–S132 [DOI] [PubMed] [Google Scholar]
- 2. Kluytmans J., van Belkum A., and Verbrugh H. (1997) Nasal carriage of Staphylococcus aureus: epidemiology, underlying mechanisms, and associated risks. Clin. Microbiol. Rev. 10, 505–520 [DOI] [PMC free article] [PubMed] [Google Scholar]
- 3. David M. Z., and Daum R. S. (2010) Community-associated methicillin-resistant Staphylococcus aureus: epidemiology and clinical consequences of an emerging epidemic. Clin. Microbiol. Rev. 23, 616–687 [DOI] [PMC free article] [PubMed] [Google Scholar]
- 4. Tong S. Y., Davis J. S., Eichenberger E., Holland T. L., and Fowler V. G. Jr. (2015) Staphylococcus aureus infections: epidemiology, pathophysiology, clinical manifestations, and management. Clin. Microbiol. Rev. 28, 603–661 [DOI] [PMC free article] [PubMed] [Google Scholar]
- 5. Thurlow L. R., Joshi G. S., and Richardson A. R. (2012) Virulence strategies of the dominant USA300 lineage of community-associated methicillin-resistant Staphylococcus aureus (CA-MRSA). FEMS Immunol. Med. Microbiol. 65, 5–22 [DOI] [PMC free article] [PubMed] [Google Scholar]
- 6. Thammavongsa V., Kim H. K., Missiakas D., and Schneewind O. (2015) Staphylococcal manipulation of host immune responses. Nat. Rev. Microbiol. 13, 529–543 [DOI] [PMC free article] [PubMed] [Google Scholar]
- 7. Burman J. D., Leung E., Atkins K. L., O'Seaghdha M. N., Lango L., Bernado P., Bagby S., Svergun D. I., Foster T. J., Isenman D. E., and van den Elsen J. M. (2008) Interaction of human complement with Sbi, a staphylococcal immunoglobulin-binding protein: indications of a novel mechanism of complement evasion by Staphylococcus aureus. J. Biol. Chem. 283, 17579–17593 [DOI] [PMC free article] [PubMed] [Google Scholar]
- 8. Forsgren A., and Sjoquist J. (1966) “Protein A” from S. aureus. I. Pseudo-immune reaction with human gamma-globulin. J. Immunol. 97, 822–827 [PubMed] [Google Scholar]
- 9. Sjodahl J. (1977) Repetitive sequences in protein A from Staphylococcus aureus. Arrangement of five regions within the protein, four being highly homologous and Fc-binding. Eur. J. Biochem. 73, 343–351 [DOI] [PubMed] [Google Scholar]
- 10. Rooijakkers S. H., Ruyken M., Roos A., Daha M. R., Presanis J. S., Sim R. B., van Wamel W. J., van Kessel K. P., and van Strijp J. A. (2005) Immune evasion by a staphylococcal complement inhibitor that acts on C3 convertases. Nat. Immunol. 6, 920–927 [DOI] [PubMed] [Google Scholar]
- 11. Rooijakkers S. H., Ruyken M., van Roon J., van Kessel K. P., van Strijp J. A., and van Wamel W. J. (2006) Early expression of SCIN and CHIPS drives instant immune evasion by Staphylococcus aureus. Cell Microbiol. 8, 1282–1293 [DOI] [PubMed] [Google Scholar]
- 12. Foster T. J., Geoghegan J. A., Ganesh V. K., and Hook M. (2014) Adhesion, invasion and evasion: the many functions of the surface proteins of Staphylococcus aureus. Nat. Rev. Microbiol. 12, 49–62 [DOI] [PMC free article] [PubMed] [Google Scholar]
- 13. Berends E. T., Horswill A. R., Haste N. M., Monestier M., Nizet V., and von Kockritz-Blickwede M. (2010) Nuclease expression by Staphylococcus aureus facilitates escape from neutrophil extracellular traps. J. Innate Immun. 2, 576–586 [DOI] [PMC free article] [PubMed] [Google Scholar]
- 14. Shaw L., Golonka E., Potempa J., and Foster S. J. (2004) The role and regulation of the extracellular proteases of Staphylococcus aureus. Microbiology 150, 217–228 [DOI] [PubMed] [Google Scholar]
- 15. Suleman L. (2016) Extracellular bacterial proteases in chronic wounds: a potential therapeutic target? Adv. Wound Care 455–463 [DOI] [PMC free article] [PubMed] [Google Scholar]
- 16. Alonzo F. 3rd, and Torres V. J. (2014) The Bicomponent Pore-Forming Leucocidins of Staphylococcus aureus. Microbiol. Mol. Biol. Rev. 78, 199–230 [DOI] [PMC free article] [PubMed] [Google Scholar]
- 17. Otto M. (2014) Staphylococcus aureus toxins. Curr. Opin. Microbiol. 17, 32–37 [DOI] [PMC free article] [PubMed] [Google Scholar]
- 18. Menestrina G., Serra M. D., and Prevost G. (2001) Mode of action of beta-barrel pore-forming toxins of the staphylococcal alpha-hemolysin family. Toxicon 39, 1661–1672 [DOI] [PubMed] [Google Scholar]
- 19. Novick R. P. (2003) Autoinduction and signal transduction in the regulation of staphylococcal virulence. Mol. Microbiol. 48, 1429–1449 [DOI] [PubMed] [Google Scholar]
- 20. Novick R. P., and Geisinger E. (2008) Quorum sensing in staphylococci. Annu. Rev. Genet. 42, 541–564 [DOI] [PubMed] [Google Scholar]
- 21. Benson M. A., Ohneck E. A., Ryan C., Alonzo F 3rd, Smith H., Narechania A., Kolokotronis S. O., Satola S. W., Uhlemann A. C., Sebra R., Deikus G., Shopsin B., Planet P. J., and Torres V. J. (2014) Evolution of hypervirulence by a MRSA clone through acquisition of a transposable element. Mol. Microbiol. 93, 664–681 [DOI] [PMC free article] [PubMed] [Google Scholar]
- 22. Boisset S., Geissmann T., Huntzinger E., Fechter P., Bendridi N., Possedko M., Chevalier C., Helfer A. C., Benito Y., Jacquier A., Gaspin C., Vandenesch F., and Romby P. (2007) Staphylococcus aureus RNAIII coordinately represses the synthesis of virulence factors and the transcription regulator Rot by an antisense mechanism. Genes Dev. 21, 1353–1366 [DOI] [PMC free article] [PubMed] [Google Scholar]
- 23. Morfeldt E., Taylor D., von Gabain A., and Arvidson S. (1995) Activation of alpha-toxin translation in Staphylococcus aureus by the trans-encoded antisense RNA, RNAIII. EMBO J. 14, 4569–4577 [DOI] [PMC free article] [PubMed] [Google Scholar]
- 24. Novick R. P., Ross H. F., Projan S. J., Kornblum J., Kreiswirth B., and Moghazeh S. (1993) Synthesis of staphylococcal virulence factors is controlled by a regulatory RNA molecule. EMBO J. 12, 3967–3975 [DOI] [PMC free article] [PubMed] [Google Scholar]
- 25. Killikelly A., Benson M. A., Ohneck E. A., Sampson J. M., Jakoncic J., Spurrier B., Torres V. J., and Kong X. P. (2015) Structure-based functional characterization of repressor of toxin (Rot), a central regulator of Staphylococcus aureus virulence. J. Bacteriol. 197, 188–200 [DOI] [PMC free article] [PubMed] [Google Scholar]
- 26. Benson M. A., Lilo S., Nygaard T., Voyich J. M., and Torres V. J. (2012) Rot and SaeRS cooperate to activate expression of the staphylococcal superantigen-like exoproteins. J. Bacteriol. 194, 4355–4365 [DOI] [PMC free article] [PubMed] [Google Scholar]
- 27. Giraudo A. T., Cheung A. L., and Nagel R. (1997) The sae locus of Staphylococcus aureus controls exoprotein synthesis at the transcriptional level. Arch. Microbiol. 168, 53–58 [DOI] [PubMed] [Google Scholar]
- 28. Liang X., Yu C., Sun J., Liu H., Landwehr C., Holmes D., and Ji Y. (2006) Inactivation of a two-component signal transduction system, SaeRS, eliminates adherence and attenuates virulence of Staphylococcus aureus. Infect. Immun. 74, 4655–4665 [DOI] [PMC free article] [PubMed] [Google Scholar]
- 29. Nygaard T. K., Pallister K. B., Ruzevich P., Griffith S., Vuong C., and Voyich J. M. (2010) SaeR binds a consensus sequence within virulence gene promoters to advance USA300 pathogenesis. J. Infect. Dis. 201, 241–254 [DOI] [PMC free article] [PubMed] [Google Scholar]
- 30. Rogasch K., Ruhmling V., Pane-Farre J., Hoper D., Weinberg C., Fuchs S., Schmudde M., Broker B. M., Wolz C., Hecker M., and Engelmann S. (2006) Influence of the two-component system SaeRS on global gene expression in two different Staphylococcus aureus strains. J. Bacteriol. 188, 7742–7758 [DOI] [PMC free article] [PubMed] [Google Scholar]
- 31. Zurek O. W., Nygaard T. K., Watkins R. L., Pallister K. B., Torres V. J., Horswill A. R., and Voyich J. M. (2014) The role of innate immunity in promoting SaeR/S-mediated virulence in Staphylococcus aureus. J. Innate Immun. 6, 21–30 [DOI] [PMC free article] [PubMed] [Google Scholar]
- 32. Cho H., Jeong D. W., Liu Q., Yeo W. S., Vogl T., Skaar E. P., Chazin W. J., and Bae T. (2015) Calprotectin Increases the Activity of the SaeRS Two Component System and Murine Mortality during Staphylococcus aureus Infections. PLoS Pathog. 11, e1005026. [DOI] [PMC free article] [PubMed] [Google Scholar]
- 33. Novick R. P., and Jiang D. (2003) The staphylococcal saeRS system coordinates environmental signals with agr quorum sensing. Microbiology 149, 2709–2717 [DOI] [PubMed] [Google Scholar]
- 34. Stefani S., Chung D. R., Lindsay J. A., Friedrich A. W., Kearns A. M., Westh H., and Mackenzie F. M. (2012) Meticillin-resistant Staphylococcus aureus (MRSA): global epidemiology and harmonisation of typing methods. Int. J. Antimicrob. Agents 39, 273–282 [DOI] [PubMed] [Google Scholar]
- 35. Enright M. C., Day N. P., Davies C. E., Peacock S. J., and Spratt B. G. (2000) Multilocus sequence typing for characterization of methicillin-resistant and methicillin-susceptible clones of Staphylococcus aureus. J. Clin. Microbiol. 38, 1008–1015 [DOI] [PMC free article] [PubMed] [Google Scholar]
- 36. Koreen L., Ramaswamy S. V., Graviss E. A., Naidich S., Musser J. M., and Kreiswirth B. N. (2004) spa typing method for discriminating among Staphylococcus aureus isolates: implications for use of a single marker to detect genetic micro- and macrovariation. J. Clin. Microbiol. 42, 792–799 [DOI] [PMC free article] [PubMed] [Google Scholar]
- 37. Shopsin B., Gomez M., Montgomery S. O., Smith D. H., Waddington M., Dodge D. E., Bost D. A., Riehman M., Naidich S., and Kreiswirth B. N. (1999) Evaluation of protein A gene polymorphic region DNA sequencing for typing of Staphylococcus aureus strains. J. Clin. Microbiol. 37, 3556–3563 [DOI] [PMC free article] [PubMed] [Google Scholar]
- 38. International Working Group on the Classification of Staphylococcal Cassette Chromosome, E. (2009) Classification of staphylococcal cassette chromosome mec (SCCmec): guidelines for reporting novel SCCmec elements. Antimicrob. Agents Chemother. 53, 4961–4967 [DOI] [PMC free article] [PubMed] [Google Scholar]
- 39. Mootz J. M., Benson M. A., Heim C. E., Crosby H. A., Kavanaugh J. S., Dunman P. M., Kielian T., Torres V. J., and Horswill A. R. (2015) Rot is a key regulator of Staphylococcus aureus biofilm formation. Mol. Microbiol. 96, 388–404 [DOI] [PMC free article] [PubMed] [Google Scholar]
- 40. Reyes-Robles T., Lubkin A., Alonzo F 3rd, Lacy D. B., and Torres V. J. (2016) Exploiting dominant-negative toxins to combat Staphylococcus aureus pathogenesis. EMBO Rep. 17, 428–440 [DOI] [PMC free article] [PubMed] [Google Scholar]
- 41. Dumont A. L., Nygaard T. K., Watkins R. L., Smith A., Kozhaya L., Kreiswirth B. N., Shopsin B., Unutmaz D., Voyich J. M., and Torres V. J. (2011) Characterization of a new cytotoxin that contributes to Staphylococcus aureus pathogenesis. Mol. Microbiol. 79, 814–825 [DOI] [PMC free article] [PubMed] [Google Scholar]
- 42. Balasubramanian D., Ohneck E. A., Chapman J., Weiss A., Kim M. K., Reyes-Robles T., Zhong J., Shaw L. N., Lun D. S., Ueberheide B., Shopsin B., and Torres V. J. (2016) Staphylococcus aureus coordinates leukocidin expression and pathogenesis by sensing metabolic fluxes via RpiRc. MBio. 7 [DOI] [PMC free article] [PubMed] [Google Scholar]
- 43. Cotto-Rios X. M., Bekes M., Chapman J., Ueberheide B., and Huang T. T. (2012) Deubiquitinases as a signaling target of oxidative stress. Cell Rep. 2, 1475–1484 [DOI] [PMC free article] [PubMed] [Google Scholar]
- 44. Cox J., Hein M. Y., Luber C. A., Paron I., Nagaraj N., and Mann M. (2014) Accurate proteome-wide label-free quantification by delayed normalization and maximal peptide ratio extraction, termed MaxLFQ. Mol. Cell. Proteomics 13, 2513–2526 [DOI] [PMC free article] [PubMed] [Google Scholar]
- 45. Moreno-Hagelsieb G., and Latimer K. (2008) Choosing BLAST options for better detection of orthologs as reciprocal best hits. Bioinformatics 24, 319–324 [DOI] [PubMed] [Google Scholar]
- 46. Queck S. Y., Jameson-Lee M., Villaruz A. E., Bach T. H., Khan B. A., Sturdevant D. E., Ricklefs S. M., Li M., and Otto M. (2008) RNAIII-independent target gene control by the agr quorum-sensing system: insight into the evolution of virulence regulation in Staphylococcus aureus. Mol. Cell 32, 150–158 [DOI] [PMC free article] [PubMed] [Google Scholar]
- 47. DuMont A. L., Yoong P., Liu X., Day C. J., Chumbler N. M., James D. B., Alonzo F 3rd, Bode N. J., Lacy D. B., Jennings M. P., and Torres V. J. (2014) Identification of a crucial residue required for Staphylococcus aureus LukAB cytotoxicity and receptor recognition. Infect. Immun. 82, 1268–1276 [DOI] [PMC free article] [PubMed] [Google Scholar]
- 48. Ventura C. L., Malachowa N., Hammer C. H., Nardone G. A., Robinson M. A., Kobayashi S. D., and DeLeo F. R. (2010) Identification of a novel Staphylococcus aureus two-component leukotoxin using cell surface proteomics. PLoS ONE 5, e11634. [DOI] [PMC free article] [PubMed] [Google Scholar]
- 49. Smyth D. S., Kafer J. M., Wasserman G. A., Velickovic L., Mathema B., Holzman R. S., Knipe T. A., Becker K., von Eiff C., Peters G., Chen L., Kreiswirth B. N., Novick R. P., and Shopsin B. (2012) Nasal carriage as a source of agr-defective Staphylococcus aureus bacteremia. J. Infect. Dis. 206, 1168–1177 [DOI] [PMC free article] [PubMed] [Google Scholar]
- 50. Kolar S. L., Ibarra J. A., Rivera F. E., Mootz J. M., Davenport J. E., Stevens S. M., Horswill A. R., and Shaw L. N. (2013) Extracellular proteases are key mediators of Staphylococcus aureus virulence via the global modulation of virulence-determinant stability. Microbiologyopen 2, 18–34 [DOI] [PMC free article] [PubMed] [Google Scholar]
- 51. Chambers H. F., and Deleo F. R. (2009) Waves of resistance: Staphylococcus aureus in the antibiotic era. Nat. Rev. Microbiol. 7, 629–641 [DOI] [PMC free article] [PubMed] [Google Scholar]
- 52. Enright M. C., Robinson D. A., Randle G., Feil E. J., Grundmann H., and Spratt B. G. (2002) The evolutionary history of methicillin-resistant Staphylococcus aureus (MRSA). Proc. Natl. Acad. Sci. U.S.A. 99, 7687–7692 [DOI] [PMC free article] [PubMed] [Google Scholar]
- 53. Feil E. J., Li B. C., Aanensen D. M., Hanage W. P., and Spratt B. G. (2004) eBURST: inferring patterns of evolutionary descent among clusters of related bacterial genotypes from multilocus sequence typing data. J. Bacteriol. 186, 1518–1530 [DOI] [PMC free article] [PubMed] [Google Scholar]
- 54. Goering R. V., Shawar R. M., Scangarella N. E., O'Hara F. P., Amrine-Madsen H., West J. M., Dalessandro M., Becker J. A., Walsh S. L., Miller L. A., van Horn S. F., Thomas E. S., and Twynholm M. E. (2008) Molecular epidemiology of methicillin-resistant and methicillin-susceptible Staphylococcus aureus isolates from global clinical trials. J. Clin. Microbiol 46, 2842–2847 [DOI] [PMC free article] [PubMed] [Google Scholar]
- 55. Adhikari R. P., and Novick R. P. (2008) Regulatory organization of the staphylococcal sae locus. Microbiology 154, 949–959 [DOI] [PubMed] [Google Scholar]
- 56. Mainiero M., Goerke C., Geiger T., Gonser C., Herbert S., and Wolz C. (2010) Differential target gene activation by the Staphylococcus aureus two-component system saeRS. J. Bacteriol. 192, 613–623 [DOI] [PMC free article] [PubMed] [Google Scholar]
- 57. Schafer D., Lam T. T., Geiger T., Mainiero M., Engelmann S., Hussain M., Bosserhoff A., Frosch M., Bischoff M., Wolz C., Reidl J., and Sinha B. (2009) A point mutation in the sensor histidine kinase SaeS of Staphylococcus aureus strain Newman alters the response to biocide exposure. J. Bacteriol. 191, 7306–7314 [DOI] [PMC free article] [PubMed] [Google Scholar]
- 58. Balasubramanian S. K., Tiruvoipati R., Amin M., Aabideen K. K., Peek G. J., Sosnowski A. W., and Firmin R. K. (2007) Factors influencing the outcome of paediatric cardiac surgical patients during extracorporeal circulatory support. J. Cardiothorac Surg. 2, 4. [DOI] [PMC free article] [PubMed] [Google Scholar]
- 59. Dunman P. M., Murphy E., Haney S., Palacios D., Tucker-Kellogg G., Wu S., Brown E. L., Zagursky R. J., Shlaes D., and Projan S. J. (2001) Transcription profiling-based identification of Staphylococcus aureus genes regulated by the agr and/or sarA loci. J. Bacteriol. 183, 7341–7353 [DOI] [PMC free article] [PubMed] [Google Scholar]
- 60. Crosby H. A., Schlievert P. M., Merriman J. A., King J. M., Salgado-Pabon W., and Horswill A. R. (2016) The Staphylococcus aureus global regulator MgrA modulates clumping and virulence by controlling surface protein expression. PLoS Pathog. 12, e1005604. [DOI] [PMC free article] [PubMed] [Google Scholar]
- 61. Cue D., Junecko J. M., Lei M. G., Blevins J. S., Smeltzer M. S., and Lee C. Y. (2015) SaeRS-dependent inhibition of biofilm formation in Staphylococcus aureus Newman. PLoS ONE 10, e0123027. [DOI] [PMC free article] [PubMed] [Google Scholar]
- 62. Lei T., Becker A., and Ji Y. (2014) Transcriptomic analysis of Staphylococcus aureus using microarray and advanced next-generation RNA-seq technologies. Methods Mol. Biol. 1085, 213–229 [DOI] [PubMed] [Google Scholar]
- 63. Osmundson J., Dewell S., and Darst S. A. (2013) RNA-Seq reveals differential gene expression in Staphylococcus aureus with single-nucleotide resolution. PLoS ONE 8, e76572. [DOI] [PMC free article] [PubMed] [Google Scholar]
- 64. Rose H. R., Holzman R. S., Altman D. R., Smyth D. S., Wasserman G. A., Kafer J. M., Wible M., Mendes R. E., Torres V. J., and Shopsin B. (2015) Cytotoxic virulence predicts mortality in nosocomial pneumonia due to methicillin-resistant Staphylococcus aureus. J. Infect. Dis. 211, 1862–1874 [DOI] [PMC free article] [PubMed] [Google Scholar]
- 65. Kim J. W., Kim H. K., Kang G. S., Kim I. H., Kim H. S., Lee Y. S., and Yoo J. I. (2016) The SAV1322 gene from Staphylococcus aureus: genomic and proteomic approaches to identification and characterization of gene function. BMC Microbiol. 16, 206. [DOI] [PMC free article] [PubMed] [Google Scholar]
- 66. Otto A., van Dijl J. M., Hecker M., and Becher D. (2014) The Staphylococcus aureus proteome. Int. J. Med. Microbiol. 304, 110–120 [DOI] [PubMed] [Google Scholar]
- 67. Cassat J. E., Hammer N. D., Campbell J. P., Benson M. A., Perrien D. S., Mrak L. N., Smeltzer M. S., Torres V. J., and Skaar E. P. (2013) A secreted bacterial protease tailors the Staphylococcus aureus virulence repertoire to modulate bone remodeling during osteomyelitis. Cell Host Microbe 13, 759–772 [DOI] [PMC free article] [PubMed] [Google Scholar]
- 68. Hanzelmann D., Joo H. S., Franz-Wachtel M., Hertlein T., Stevanovic S., Macek B., Wolz C., Gotz F., Otto M., Kretschmer D., and Peschel A. (2016) Toll-like receptor 2 activation depends on lipopeptide shedding by bacterial surfactants. Nat. Commun. 7, 12304. [DOI] [PMC free article] [PubMed] [Google Scholar]
- 69. Alreshidi M. M., Dunstan R. H., Macdonald M. M., Smith N. D., Gottfries J., and Roberts T. K. (2015) Metabolomic and proteomic responses of Staphylococcus aureus to prolonged cold stress. J. Proteomics 121, 44–55 [DOI] [PubMed] [Google Scholar]
- 70. Bonar E., Wojcik I., and Wladyka B. (2015) Proteomics in studies of Staphylococcus aureus virulence. Acta Biochim. Pol. 62, 367–381 [DOI] [PubMed] [Google Scholar]
- 71. Islam N., Kim Y., Ross J. M., and Marten M. R. (2014) Proteomic analysis of Staphylococcus aureus biofilm cells grown under physiologically relevant fluid shear stress conditions. Proteome Sci. 12, 21. [DOI] [PMC free article] [PubMed] [Google Scholar]
- 72. Yoong P., and Torres V. J. (2013) The effects of Staphylococcus aureus leukotoxins on the host: cell lysis and beyond. Curr. Opin. Microbiol. 16, 63–69 [DOI] [PMC free article] [PubMed] [Google Scholar]
- 73. Rouha H., Badarau A., Visram Z. C., Battles M. B., Prinz B., Magyarics Z., Nagy G., Mirkina I., Stulik L., Zerbs M., Jagerhofer M., Maierhofer B., Teubenbacher A., Dolezilkova I., Gross K., Banerjee S., Zauner G., Malafa S., Zmajkovic J., Maier S., Mabry R., Krauland E., Wittrup K. D., Gerngross T. U., and Nagy E. (2015) Five birds, one stone: neutralization of alpha-hemolysin and 4 bi-component leukocidins of Staphylococcus aureus with a single human monoclonal antibody. mAbs 7, 243–254 [DOI] [PMC free article] [PubMed] [Google Scholar]
- 74. Tettelin H., Masignani V., Cieslewicz M. J., Donati C., Medini D., Ward N. L., Angiuoli S. V., Crabtree J., Jones A. L., Durkin A. S., Deboy R. T., Davidsen T. M., Mora M., Scarselli M., Margarit y Ros I., Peterson J. D., Hauser C. R., Sundaram J. P., Nelson W. C., Madupu R., Brinkac L. M., Dodson R. J., Rosovitz M. J., Sullivan S. A., Daugherty S. C., Haft D. H., Selengut J., Gwinn M. L., Zhou L., Zafar N., Khouri H., Radune D., Dimitrov G., Watkins K., O'Connor K. J., Smith S., Utterback T. R., White O., Rubens C. E., Grandi G., Madoff L. C., Kasper D. L., Telford J. L., Wessels M. R., Rappuoli R., and Fraser C. M. (2005) Genome analysis of multiple pathogenic isolates of Streptococcus agalactiae: implications for the microbial “pan-genome”. Proc. Natl. Acad. Sci. U.S.A. 102, 13950–13955 [DOI] [PMC free article] [PubMed] [Google Scholar]
- 75. Parker D., Narechania A., Sebra R., Deikus G., Larussa S., Ryan C., Smith H., Prince A., Mathema B., Ratner A. J., Kreiswirth B., and Planet P. J. (2014) Genome Sequence of Bacterial Interference Strain Staphylococcus aureus 502A. Genome Announcements 2 [DOI] [PMC free article] [PubMed] [Google Scholar]
Associated Data
This section collects any data citations, data availability statements, or supplementary materials included in this article.
Supplementary Materials
Data Availability Statement
All raw mass spectrometry data and search results have been deposited to the ProteomeXchange Consortium via the MassIVE partner repository with the data set identifiers: ProteomeXchange PXD005203 and MassIVE MSV000080260.