

Abstract
Better and more diverse biomarkers for the development of simple point-of-care tests for active tuberculosis (TB), a clinically heterogeneous disease, are urgently needed. We generated a proteomic Mycobacterium tuberculosis (Mtb) High-Density Nucleic Acid Programmable Protein Array (HD-NAPPA) that used a novel multiplexed strategy for expedited high-throughput screening for antibody responses to the Mtb proteome. We screened sera from HIV uninfected and coinfected TB patients and controls (n = 120) from the US and South Africa (SA) using the multiplex HD-NAPPA for discovery, followed by deconvolution and validation through single protein HD-NAPPA with biologically independent samples (n = 124). We verified the top proteins with enzyme-linked immunosorbent assays (ELISA) using the original screening and validation samples (n = 244) and heretofore untested samples (n = 41). We identified 8 proteins with TB biomarker value; four (Rv0054, Rv0831c, Rv2031c and Rv0222) of these were previously identified in serology studies, and four (Rv0948c, Rv2853, Rv3405c, Rv3544c) were not known to elicit antibody responses. Using ELISA data, we created classifiers that could discriminate patients' TB status according to geography (US or SA) and HIV (HIV- or HIV+) status. With ROC curve analysis under cross validation, the classifiers performed with an AUC for US/HIV- at 0.807; US/HIV+ at 0.782; SA/HIV- at 0.868; and SA/HIV+ at 0.723. With this study we demonstrate a new platform for biomarker/antibody screening and delineate its utility to identify previously unknown immunoreactive proteins.
Active tuberculosis (TB)1 is a disease caused by uncontrolled infection with Mycobacterium tuberculosis (Mtb). It predominantly affects the respiratory tract and is typically transmitted through infectious droplets generated by coughing. The disease remains a major global public health problem, ranking alongside HIV infection as the leading cause of death worldwide (1). In 2015, an estimated 10.4 million new cases occurred globally with around 1.4 million TB-associated deaths; numbers that for the first time in decades reflect an increase in incident cases compared with the preceding year (1). Rapid TB diagnosis and treatment are cornerstones of TB control and essential for reduction of morbidity, mortality and transmission.
Diagnosis of TB can be challenging because the clinical presentations are manifold and dependent on the immune status of the host. Furthermore, the differential diagnosis can be broad with diagnostic confirmation desired. The gold standard tests for detecting Mtb, usually in a respiratory sample, are culture or nucleic acid amplification (NAA) both of which require a certain degree of laboratory infrastructure and/or equipment, which are often not available in endemic settings, which are typically resource-limited. Thus, there is an urgent need for simple point-of-care (POC) TB tests that are based on the use of easily accessible, nonsputum based body fluids, such as blood, and that can detect the different forms of TB, pulmonary and extrapulmonary, in various hosts (2, 3). In the absence of such POC tests, a simple triage method to identify those symptomatic TB suspects that are in need of further confirmatory testing, would be desirable but remains a further unmet need among the current TB diagnostic armamentarium (2, 3).
Antibody (Ab) detection assays can be adapted for the development of rapid, inexpensive, easy to use tests that neither require laboratory infrastructure nor specific training. Prior serological tests for the diagnosis of TB have been insufficiently sensitive and specific (reviewed in (4, 5)) for several reasons. Importantly, the Ab profiles of TB patients are heterogeneous (6, 7), and tests that are based on a limited number of antigens, often only one or two (2, 3), are insufficient to capture the diversity of TB cases. For example, a strong Ab response to the 38 kDa protein is elicited almost exclusively in the subgroup of advanced, HIV negative pulmonary TB patients, so assays based on this antigen are limited in diagnostic scope (reviewed in (4, 6, 8)). Furthermore, several antigens appear to lack specificity for TB (reviewed in (5, 8)). Because of the potential to turn Ab detection assays into simple dipstick formats, TB serology, despite its known limitations, remains a field of study that is worthwhile pursuing further and new biomarker targets need to be identified. The simultaneous use of multiple more recently identified Mtb proteins in form of multiplex microbead immunoassays has already shown promising improved accuracy for TB serodiagnosis in regional case-control studies (9, 10). Although the World Health Organization recognizes the limitations of currently available serologic tests and in fact cautions against using them (11), it vigorously encourages further research to meet the need for reliable, simple tests for TB in endemic regions. Because Ab detection is amenable to use in dipstick format incorporating a diversity of antigens, the pursuit of Ab targets that are valid biomarkers of TB is worthwhile.
Discovery of potential biomarkers requires high-throughput methods for assessing proteome-wide screens for antibody reactivity. The utilization of in situ protein arrays provides advances in the access of high-throughput protein microarray and their translation studies (12). Instead of requiring purified protein for printing, the in situ protein microarray utilizes printing of expression plasmids encoding libraries of genes. After in situ transcription and translation the proteins “self-assemble” on the array surface with the aid of ribosomes and chaperones, thereby enhancing natural protein folding and post-translational modification. Among the in situ protein microarray methods, Nucleic Acid Programmable Protein Array (NAPPA) (13) represents a platform for the biomarker discovery in cancer (14), autoimmune diseases (15) and infectious disease (13, 16). Membrane proteins express and display well with NAPPA with an efficiency that exceeds 90% (13). Because membrane proteins comprise a large portion of antigens eliciting a human humoral immune response to TB, this method could identify novel valuable Ab targets for TB serodiagnosis that might not be discovered with the conventional protein array platform that is based on printing prefabricated proteins, typically generated in E. coli, on glass slides (6).
We here describe the generation of a novel Mtb protein microarray based on the NAPPA platform (17, 18), the High Density-NAPPA (HD-NAPPA), which we used in a multiplex version (M-HD-NAPPA) for high-throughput screening and in a single protein version for deconvolution and validation. This platform entails printing plasmids containing cDNAs encoding the Mtb proteome comprising ∼ 4000 proteins into silicon nano-wells. The objectives of this study were i) to screen sera from HIV uninfected and coinfected TB patients and controls from different geographic regions (US and South Africa (SA)) to identify proteins with potential and previously unknown value for TB serodiagnosis; and ii) to delineate panels of candidate proteins that hold promise in the different patient groups and should undergo further validation studies.
Experimental Procedures, Subjects and Study Design
Mtb Plasmid Construction and DNA Preparation
We obtained 3295 Mtb H37Rv and 437 CDC 1551 genes in entry vectors from the Pathogen Functional Genomics Center. We designed and obtained primers for the missing ∼800 H37Rv genes (Integrated DNA Technologies, Coralville, IA) and performed PCR amplification from genomic Mtb H37Rv DNA to create entry clones for these missing genes as described (19). After two rounds of PCR amplification and transfer of clones to the pANT7-cGST expression vector, which encodes a C-terminal fusion partner for the target gene of Glutathione-S-Transferase (GST), we obtained a final sequence-verified gene set comprised of 3646 H37Rv and 399 CDC 1551 clones (4045 total) for array construction. The reduction in clone numbers resulted from failure to either produce a PCR product or creation of a verified expression clone. Purified plasmid DNA was prepared with a high throughput alkaline lysis mini-prep protocol as described (17, 20, 21). For positive controls, we used several genes encoding for the antigens of the Epstein-Barr virus (EBV), a virus over 95% of individuals are infected with by adult age (22), specifically the Epstein-Barr Nuclear Antigen (EBNA), EBV_Small capsomere-interacting protein (BFRF3), EBV_EBNA2, and other viral genes, specifically H1N1_Nucleoprotein, H3N2_ Nucleoprotein, HCMV2_Viral transcription factor IE2 (UL122) (16). For negative gene controls we used a plasmid encoding GST without any fusion partner.
HD-NAPPA Array Fabrication
The HD-NAPPA array fabrication included three main processes as reported (15): nano-well slide fabrication, plasmid plate and printing mixture preparation and piezoelectric printing. The nano-well slide fabrication was performed as reported (16). The plasmid plate was constructed as reported for the HD-NAPPA (16), with modifications to the multiplex version to allow for a more high-throughput evaluation. We admixed three unique genes into one well resulting in three unique proteins displayed in each spot. Although this added the need to deconvolute reactive spots by reassessing the same screening samples with a new microarray containing only individual proteins per spot, it overall allowed us to process the screening faster (15, 16). The printing master mix (MM) was composed of polyclonal anti-GST Ab (GE Healthcare), bovine serum albumin (BSA, Sigma-Aldrich), BS3 cross linker (Pierce) and DEPC treated water (15, 16). To control for secondary Ab reactivity, we also printed purified mouse IgG, human IgG and human IgA, in MM at concentrations from 40 to 200 ng/μl in each subarray. Negative controls consisted of MM spots without any plasmid and the plasmid endcoding only for the fusion partner GST. The HD-NAPPA print was performed on AU302 piezoelectric dispensing system (Engineering Arts LLC, Tempe, AZ, USA) by depositing MM (1200 pL/well) and plasmid(s) (100 ng/μl, 300 pL/well) sequentially utilizing 16 individual noncontact dispensing heads. The HD-NAPPA slides were stored under an argon gas filled container at room temperature until the day of use when proteins were expressed.
Protein Expression on M-HD-NAPPA
Arrays were blocked with SuperBlock (Thermo Fisher Scientific, Rockford, IL) prior to expression to reduce nonspecific binding, rinsed with DI water and centrifuged dry. The nano-wells were filled with human cell-free expression system (In Vitro Transcription and Translation coupled system; IVTT; Thermo Fisher Scientific) and a custom micro-reactor device was used for the protein expression (23). After sealing the wells with a polystyrene membrane under 200 PSI pressure, we incubated the reactor for 2 h at 30 °C for expression and for 0.5 h at 15 °C for protein capture, followed by blocking with 5% skim milk in phosphate buffered saline with 0.2% tween 20 (PBST) for 30 min. Anti-GST murine monoclonal Ab (mAb; Cell signaling technology, Danvers, MA) was used to assess protein display followed by detection with Alexa 647-labeled Goat anti-mouse IgG (H+L) secondary Ab (A-21235, Thermo Fisher Scientific) (16).
Subjects and samples
Serum samples were obtained in cross-sectional studies from patients with Mtb culture-proven TB before or within the first 7 days of antituberculous treatment initiation and from asymptomatic controls (Table I). Subjects were enrolled in two different settings, in public hospitals in New York City, United States, and at Edendale Hospital in KwaZulu-Natal, South Africa (SA). Subjects provided informed written consent prior to enrollment and blood draw. Serum was obtained by collecting peripheral venous blood into BD Vacutainer® Serum Separation Tubes (SST™; Becton, Dickinson and Company, New Jersey) that do not contain any additives. Within 1–3 h after blood draw the samples were centrifuged at room temperature for 10 mins at 3000 rpm and serum was aliquoted and stored at −80 °C until further use. The studies were approved by the Institutional Review Boards of Arizona State University; the Albert Einstein College of Medicine, New York; and the University of KwaZulu-Natal, SA. The samples were divided into four subgroups according to the region (US, SA) and HIV status (HIV+/HIV−; Table II). Prior to performing assays, the samples in each subgroup were randomized into two even sets: one set for performing the screening/deconvolution array and one independent set for performing the validation array (Table II).
Table I. Demographics and clinical characteristics of TB patients and controls.
| US |
SA |
|||
|---|---|---|---|---|
| TB patients (n = 66) | Controls (n = 68) | TB patients (n = 102) | Controls (n = 49) | |
| Age, median (range) | 36 (20–70) | 42 (22–67) | 33 (23–42) | 35 (25–53) |
| Male sex, n (%) | 50 (75) | 31 (45) | 50 (49) | 12 (25) |
| Non-US borna, n (%) | 59 (89) | 23 (34) | NA | NA |
| TST positive (%) | NA | (45) | NA | NA |
| AFB smear positive, n (%) | 36 (54) | NA | 79 (77) | NA |
| HIV-infected, n (%) | 21 (32) | 46 (68) | 89 (87) | 24 (49) |
| CD4, median cells/mm3 (range) | 150 (121–271) | 539 (11–1541) | 199 (0–1000) | 602 (374–1237) |
a Subjects emigrated from various TB endemic regions, including Asia, South America and Africa; TST: Tuberculin skin-test; AFB: acid fast bacilli.
Table II. Sample distribution according to experiments and study phase.
| Region | US |
South Africa |
||||||
|---|---|---|---|---|---|---|---|---|
| HIV status | HIV− |
HIV+ |
HIV− |
HIV+ |
||||
| TB status | TB− | TB+ | TB− | TB+ | TB− | TB+ | TB− | TB+ |
| Multiplex HD-NAPPA (n = 120) | 11 | 21 | 12 | 8 | 12 | 5 | 10 | 41 |
| Deconvolution (n = 94)a | 6 | 20 | 6 | 7 | 6 | 5 | 6 | 38 |
| Validation (n = 124)b | 11 | 23 | 11 | 9 | 12 | 6 | 12 | 40 |
| ELISA (n = 285)c | 22 | 45 | 46 | 21 | 25 | 13 | 24 | 89 |
a Because the deconvolution of positive reactions was the prime goal of this experiment, we focused these analyses predominantly on TB+ samples from the multiplex HD-NAPPA screening.
b Consisting of biologically independent samples.
c Consisting of the original screening and validation samples (n = 244) and heretofore untested samples (n = 41).
M-HD-NAPPA - Concept Validation
In order to evaluate the M-HD-NAPPA array screening workflow, 96 Mtb genes were selected from initial individual gene glass-slide NAPPA results (data not shown) and scientific literature to create a gene set to validate immunodetection of individual proteins within a triple protein mix. In addition, we randomly selected 288 Mtb clones and printed those as individual genes as well as triple gene mixes on the HD-NAPPA slides. Ab binding was performed with a pooled sample set from 3 HIV−, TB+ subjects that had documented Ab reactivity to various proteins from prior studies (24) as well as mAb anti-GST for protein display level. During scanning of the silicon slides we adjusted the scanner parameters to focus the signal detection located within the wells, which were 75 μm deeper than flat glass slide based flat glass NAPPA.
M-HD-NAPPA - Discovery screen
We created a multiplex Mtb array containing all 4045 genes, spread among 1431 multiplexed Mtb gene spots along with the 96 individual Mtb genes and 7 viral single gene controls. There were four identical subarrays printed on each of the M-HD-NAPPA slides.
M-HD-NAPPA arrays were expressed for probing against 120 subject samples (Table II) to identify Mtb antibody binding proteins (16) (Fig. 1, Panel A). We utilized a four well gasket to create a chamber around each subarray (ProPlate Multi-well chamber, GraceBio-Labs, Bend, OR) and placed 650 μl of individual serum sample, diluted to 1:150 in 5% skim milk in PBST in each chamber, which was sealed with an opposing glass slide. This was then incubated overnight (14–16 h) at 4 °C with gentle shaking to ensure even exposure of array surface to sample. The arrays were then rinsed with 5% skim milk/PBST and Ab binding detected with Alex647 labeled Goat anti-human IgG (H+L) and 1:200 diluted Cy3 labeled Goat anti-human IgA (Jackson ImmunoResearch Labs, West Grove, PA). The slides were rinsed again to remove unbound secondary Ab, dried by centrifugation and scanned at 635 nm and 535 nm with Tecan PowerScanner. The resulting images were quantified with the ArrayPro Analyzer Software (Media Cybernetics, Inc.). Data were extracted and median normalized within each subarray. To assure a sufficient margin between positive and negative Ab reactivity we used a signal cutoff of 1.4 to identify spots for further deconvolution with the individual gene HD-NAPPA. In addition, we calculated the sensitivity and specificity within subgroups and all sample combinations. Those protein targets showing higher than 10% sensitivity in any of the four subgroups or higher than 5% sensitivity in all combined groups were selected for deconvolution.
Fig. 1.

Schematic strategy of Mtb biomarker discovery. A, Screening stage: Samples (set-1) were probed against 1431 Mtb 3*gene spots (4045 individual Mtb genes) multiplex HD-NAPPA array and multiplex spots showing response with TB+ sera were selected for deconvolution. B, Deconvolution stage: The same sample sets were probed against 870 single Mtb gene HD-NAPPA arrays. C, Validation stage: Independent samples (set-2) were probed against single Mtb genes identified in the deconvolution using the HD-NAPPA array. D, Verification stage: Both sample sets 1 and 2 were probed against the 8 most promising biomarker Mtb genes in Rapid antigenic protein in situ display (RAPID) ELISA for verification of their performance.
HD-NAPPA - Deconvolution
We identified 272 multiplex spots (792 single genes) showing differential responses between TB positive and negative subgroups. These 792 genes were printed as single genes on the HD-NAPPA. In addition, we included those initial individual 96 Mtb genes (from unpublished prior studies and the literature) that were not among the 792 genes (62 genes overlapped) and the controls resulting in a final 870 single gene HD-NAPPA of which 8 subarrays fitted on each slide. To identify the specific protein targets, we tested the same subject samples used for the M-HD-NAPPA screen and processed the slides as described earlier (Fig. 1, Panel B). Those genes with greater than 10% sensitivity in any of the four subgroups were selected as candidates for further analysis.
HD-NAPPA - Validation
Individual HD-NAPPA arrays as described above were created for deconvolution as well as validation with biologically independent sample sets (n = 124; Fig. 1, Panel C). Each sample was tested on an independent array. These samples were randomly assigned to processing days so that we would minimize any day-to-day processing bias. Array processing was performed as described above.
RAPID ELISA
Rapid antigenic protein in situ display (RAPID) ELISA was used as described (25) to verify the selected candidate proteins according to the three criteria described above (Fig. 1, Panel D). We used 285 individual subject samples (1:500 dilution) from both the discovery and validation array experiments (Table II) to assess binding to selected proteins. As a negative control, we used the Mtb protein Rv1553, which showed a normalized response close to one (0.972 ± 0.079,) on prior array analyses. Binding was detected using SuperSignal West Femto Chemiluminescent Substrate (Thermo Fisher Scientific). The chemiluminescent signal was measured using the EnVision 2104 Multilabel Reader (PerkinElmer, San Jose, CA) at 460 nm with 0.1 s per well, for a total of 10 repeat reads for each plate. The average from the last five reads was used for analysis. The Ab reactivity data were normalized by subtracting the reactivity to the negative control protein tested on the same run. Normalized values were log10 transformed and responses below background were set to zero. Normalized and transformed reactivity from replicate protein runs were then averaged for each sample.
Data Analysis
HD-NAPPA - Validation
We conducted a visual inspection of each array image and spot by spot to avoid artifacts. The data were median normalized, and the sensitivity and specificity were calculated at cutoff 1.4. We also calculated the odd's ratio of a positive response using Firth's penalized likelihood logistic regression (26). Finally, we calculated the area under the receiver operator characteristic (ROC) curve (AUC), which is a measure of marker performance across a range of cutoff values. It was set as 0.55, which elucidated the antigens likely to be positive in the TB groups. Only those genes that passed deconvolution and validation with the second set of samples were taken as possible biomarker candidates.
Because of the high level of heterogeneity of responses within the subject subcategories, we performed an analysis of the candidate biomarkers with the deconvolution and validation array data combined. Briefly, the normalized data of the deconvolution and validation within each subgroups were combined as 4 paired subgroups and processed with the same criteria as the validation array analysis. Those genes with a sensitivity higher than 20%, an odd's ratio>1.5 and an AUC value>0.55 in the combined analysis were selected as the biomarkers for ELISA verification testing.
ELISA
We used ROC curve analysis to assess the performance of each protein tested via ELISA for discriminating TB positive from TB negative patients in each of the four patient subgroups. We used the pROC R package (27) to conduct the analysis. For each protein, we measured several ROC statistics including AUC, the sensitivity at 80% specificity and the specificity at 80% sensitivity. We also calculated the p value for the Wilcoxon rank sum test of no difference between the TB positive and TB negative patients. p values were not adjusted for multiple testing and should not be interpreted as strict statistical p values because of the protein selection process and sample re-use.
We developed multiprotein panels to classify TB positive and TB negative patients in each subgroup. The classifier for each subgroup was a logistic regression model. We evaluated all possible logistic regression models using the Bayes Information Criteria (BIC) (28) to identify the best set of proteins for each subgroup. This analysis was conducted using the bestglm R package and Morgan-Tatar search (29). For each sample we calculated the fitted (noncalibrated) probability of TB positivity. We also calculated this probability using leave-one-out cross validation. We generated ROC curves using both the fitted and cross-validated probabilities, and calculated ROC statistics including the AUC, the specificity at 80% sensitivity and the sensitivity at 80% specificity.
RESULTS
M-HD-NAPPA - Concept Validation
We first generated a test set of 96 Mtb proteins, identified by preliminary studies using a serum pool from TB+ patients, as well as proteins reported in TB serology literature. We used these test proteins to create multiplex mixes of 3 proteins per spot to validate the concept of our M-HD-NAPPA. To confirm that we could detect a positive responder even when it was mixed with nonresponders (i.e. that the nonresponders did not dilute the responder signal too much), we ensured that we created all possible combinations of positive responders and nonresponders as determined by reactivity to the serum pool. To ensure that our selection did not create any bias, we also selected 3 random plates from the Mtb collection set to add an additional 288 Mtb genes. The gene mixtures, as well as the single genes, were printed on HD-NAPPA array. After expression, we probed the arrays with the TB+ pooled serum, sera from each of the individuals that comprise the pool, and anti-GST with signals normalized as described earlier (supplemental Fig. S1A and S1B). The quantified signal intensities were used to establish the Signal/Background (S/B) values for evaluating spot reactivity. Using the 96 individual protein array, we created a tool to evaluate signal intensities of the three-target mix as well as the individual component responses (supplemental Fig. S1C). The S/B values of the mixed protein responses revealed that all of the three-protein mixes and their individual components were detected for the mid- and high-level reactive protein mixtures (30/30; 100.0%) and were mostly detected if including the low reactive protein mixtures (32/35; 91.5%) using this multiplex testing strategy, demonstrating that responses to positive proteins could be observed reliably when mixed with two nonreactive proteins. We concluded that this level of reactivity of a three-target mix was satisfactory for screening purposes.
M-HD-NAPPA Screen
Following the successful demonstration of protein reactivity with M-HD-NAPPA, we performed a protein display quality control (QC) test with the 4045 Mtb M-HD-NAPPA array to assess the intra- and intersubarray correlation (protein display repeatability). The anti-GST reactivity showed that almost all of the spots exhibited a yellow to red color revealing an overall fluorescence intensity higher than 1 × 10⁶ arbitrary intensity units (a.u., the cutoff of the successful protein display; supplemental Fig. S2A–S2B). The successful protein display rate on the M-HD-NAPPA was as high as 99.45% ± 0.14% across the subarrays and across two slides. The intra-and interslide correlations revealed great reproducibility (r = 0.903 and r = 0.829, respectively; supplemental Fig. S2C). Reproducibility testing using binding of our positive control TB+ pool revealed excellent interslide correlations (0.977; supplemental Fig. S2D).
After assuring the quality and reproducibility of reactivity using the M-HD-NAPPA, we randomized samples to assure we had a mix of subject category samples during each run and day to ensure minimal run-to-run bias. All of the samples were analyzed as 4 paired subgroups according to the region (US/SA), HIV (HIV±) and TB status (TB±) for determining sensitivity and specificity. Using these groupings, we selected spots for deconvolution analysis. A representative image is shown in Fig. 2A.
Fig. 2.

Multiplex HD-NAPPA screening of candidate genes (A, B) and deconvolution of candidates on single gene HD-NAPPA (C, D). A, Representative sample being probed against the 1431 Mtb 3*protein spots (4,045 individual Mtb proteins) with the M-HD-NAPPA array. The array image shows color intensity from blue (no binding) to red (with very high antibody binding). Four selected binding spots on this image are highlighted, named 1–4, respectively. The inset below the array image shows a zoomed view of the four selected spots. B, The median normalized serological response of the multiplex protein spots, 96 Mtb genes, the 7 viral control genes, human IgG and master mix are shown as a dot plot. The red dots in the multiplex column represent the normalized reactivity of the 4 selected spots in A. C, Image of the Ab binding to the 870 single Mtb protein HD-NAPPA array. From the 4 spots in Fig. 2A, we now resolve the response to 12 individual proteins (zoomed view highlighted in inset under the HD NAPPA image). Within each 3 protein set, 1 out of 3 proteins showed responses to serum probing. D, The median normalized serological response of the single Mtb protein spots, 7 viral proteins, human IgG and master mix are shown in the dot plot. The 4 responsive proteins are highlighted in red.
We identified 95 (US/HIV-), 47 (US/HIV+), 15 (SA/HIV-) and 30 (SA/HIV+) multispots reactive with IgG and 41 (US/HIV-), 24 (US/HIV+), 21 (SA/HIV-) and 41 (SA/HIV+) multispots reactive with IgA with more than 10% sensitivity at 70% specificity. When combining all groups, 202 multispots in IgG and 144 multispots in IgA analysis showed higher than 5% sensitivity. Taken together, 163 multispots from the subgroup analysis and 259 multispots from the merged group analysis, together with 2 extra hits from visual analysis resulted in a total of 272 multispots (792 individual genes) selected for deconvolution.
HD-NAPPA - Deconvolution
In addition to the 792 candidate proteins identified in the M-HD-NAPPA screen, we included the 96 Mtb proteins (from unpublished data and published studies) to create 870 individual arrays for printing onto HD-NAPPA. Quality control assessments of these arrays are presented in supplemental Fig. S3. These arrays were probed initially against the same samples tested in the M-HD-NAPPA discovery analysis to allow for the identification of the specific reactive proteins that were responsible for the signal at the multispots. A representative image of a subject's serum binding to the deconvolution array is presented in Fig. 2C. Three hundred and sixteen single proteins that showed higher than 10% sensitivity and 70% specificity in the subgroup analysis were selected for further validation.
HD-NAPPA- Validation
Arrays with the same genes generated for the deconvolution were also used for validation experiments with 124 biologically independent samples (Table II). For biomarker candidate analysis, we used sensitivity and specificity as the first criteria. In addition, we used an odd's ratio higher than 1.5; an AUC value higher than 0.55. From the combined criteria, we identified 34 IgG hits and 8 IgA hits (Fig. 3A–3B, respectively) of potential biomarker targets with a sensitivity higher than 20%, an odd's ratio >1.5 and AUC value >0.55. The responses of these targets is shown in (supplemental Table S1) by geographic and HIV status. We performed a combined analysis of these hits with a data set that combined all of the deconvolution and validation data. Eight IgG hits (Table III) with a sensitivity higher than 20%, an odd's ratio>1.5 and an AUC value>0.55 in the combined analysis were selected as the biomarkers for ELISA verification testing.
Fig. 3.
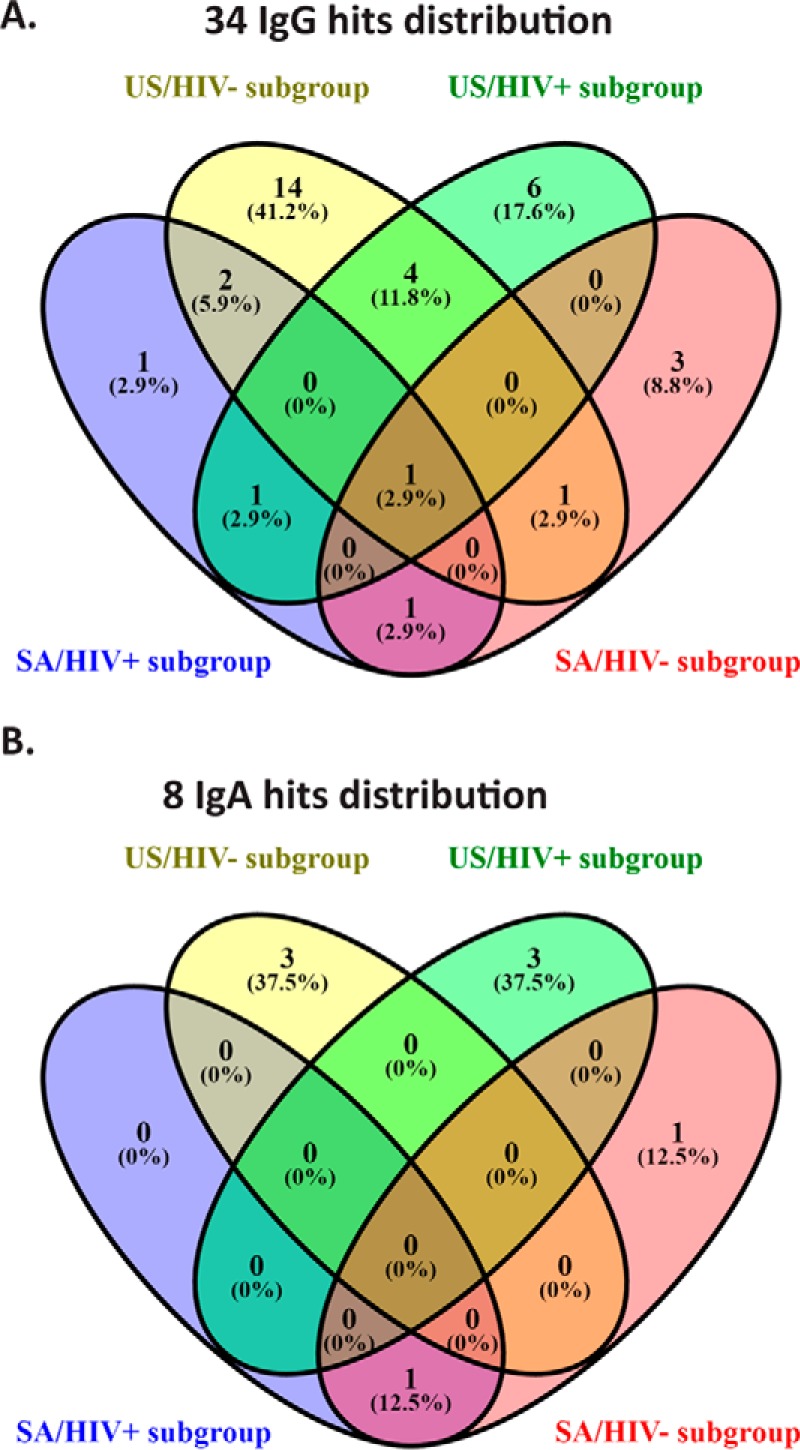
Validated IgG and IgA hits presented as a Venn Diagram distribution across the four subgroups. A, Venn Diagram of >20% sensitivity IgG hits. B, Venn Diagram of >20% sensitivity IgA hits.
Table III. Known information on candidate proteins.
CFP: culture filtrate proteins; CM: cell membrane; CW: cell wall.
| Gene | Protein name(s) | Cell fraction(s)a | Functiona | Known TB serology antigen | Sensitivity estimates/comments | Selected TB serology references |
|---|---|---|---|---|---|---|
| Rv0054 | ssb | CFP, CM | DNA recombination and repair | Yes | 12–42% | (9, 10, 41) |
| Rv0831c | Rv0831c | CFP, CM, CW, cytosol | Unknown | Yes | 25–76% | (9, 42) |
| Rv2031c | HspX (acr) | CFP, CM, CW, cytosol | Heat shock/ stress protein induced by anoxia | Yes | 39–52% | (9, 10, 43, 44) |
| Rv0222 | echA1 | CFP | Possibly oxidizes fatty acids | Yes | 54–71% | (45, 46) |
| Rv0948c | Rv0948c | CM | Involved in the shikimate pathway | No | ||
| Rv2853 | PE_PGRS48 | Not reported | Unknown | No | ||
| Rv3405c | Rv3405c | Not reported | May be involved in transcriptional mechanism | No | ||
| Rv3544c | fadE28 | Whole cell lysates | Unknown | No# |
a Information on the cellular location and functions of the proteins can be accessed through the TubercuList Database (http://tuberculist.epfl.ch/) under the gene name.
ELISA Verification
In order to verify the Mtb protein performance of the M-HD-NAPPA workflow, we used the rapid antigenic protein in situ display ELISA (25). We tested all available 244 sera from discovery and validation with an additional 41 samples (Table II). We performed an anti-GST quality control expression assessment of all targets prior to performing ELISA (supplemental Fig. S4A–S4B). The sensitivity and specificity of all 8 target proteins were calculated according to the four subgroups (Fig. 4). We also conducted ROC analysis and calculated the AUC values (Table IV). There were 1–4 proteins in each subgroup that showed an AUC value of 0.7 or higher (supplemental Fig. S5). Because the specificity at fixed cutoff varied because of the heterogeneity of responses between subgroups, we also evaluated the sensitivity at 80% specificity and the specificity at 80% sensitivity (Table IV). The proteins with the highest sensitivity at 80% specificity for the four subgroups were Rv0831c (60.0%, US/HIV-), Rv0054 (52.4%, US/HIV+), Rv0831c/Rv0222 (76.9%, SA/HIV-) and Rv3405c (57.3%, SA/HIV+). The proteins with the highest specificity at 80% sensitivity for the four subgroups were Rv2031 (45.5%, US/HIV-), Rv3405c (71.7%, US/HIV+), Rv0831c (72.0%, SA/HIV-) and Rv3405c (54.2%, SA/HIV+). Although Rv0831c showed an AUC value = 0.917 for the SA/HIV- subgroup, none of the other subgroups had any single protein with an AUC response above 0.9.
Fig. 4.

Rapid ELISA verification of the selected 8 proteins across the four subgroups. US/HIV-(A), US/HIV+(B), SA/HIV-(C) and SAHIV+(D). Protein sensitivity and specificity analysis under fixed cutoff = 4 × 10⁴ arbitrary units (a.u.). Those higher than 20% sensitivity proteins were highlighted in red. Blue bars represent median normalized IgG reactivity.
Table IV. ROC Statistics for ELISA Verification Markers and Panels.
| Gene | AUC | p value | % Sens at 80% Spec | % Spec at 80% Sens |
|---|---|---|---|---|
| US/HIV− (22 TB− 45 TB+) | ||||
| Rv2853 | .610 | 0.1475 | 31.1 | 40.9 |
| Rv2031c | .774 | 0.0003 | 62.2 | 45.5 |
| Rv0054 | .652 | 0.0409 | 53.3 | 31.5 |
| Rv0831c | .725 | 0.0029 | 60.0 | 36.4 |
| Rv3405c | .594 | 0.2144 | 33.3 | 27.3 |
| Rv3544c | .490 | 0.8932 | 28.9 | 14.9 |
| Rv0222 | .462 | 0.6165 | 20.0 | 27.3 |
| Rv0948c | .366 | 0.0757 | 8.9 | 9.1 |
| PANEL* | .807 | <0.0001 | 64.4 | 72.7 |
| US/HIV+ (46 TB− 21 TB+) | ||||
| Rv2853 | .620 | 0.1169 | 14.3 | 47.8 |
| Rv2031c | .507 | 0.9238 | 14.3 | 15.7 |
| Rv0054 | .749 | 0.0011 | 52.4 | 56.5 |
| Rv0831c | .516 | 0.8393 | 19.0 | 28.3 |
| Rv3405c | .732 | 0.0025 | 42.9 | 71.7 |
| Rv3544c | .518 | 0.8162 | 28.6 | 19.8 |
| Rv0222 | .596 | 0.2108 | 47.6 | 19.6 |
| Rv0948c | .705 | 0.0074 | 47.6 | 37.0 |
| PANEL* | .782 | 0.0002 | 61.9 | 71.7 |
| SA/HIV− (25 TB− 13 TB+) | ||||
| Rv2853 | .546 | 0.6444 | 15.4 | 24.0 |
| Rv2031c | .712 | 0.0337 | 61.5 | 28.0 |
| Rv0054 | .697 | 0.0479 | 69.2 | 17.3 |
| Rv0831c | .917 | 0.0000 | 76.9 | 72.0 |
| Rv3405c | .702 | 0.0439 | 61.5 | 68.0 |
| Rv3544c | .622 | 0.2212 | 53.8 | 13.0 |
| Rv0222 | .831 | 0.0009 | 76.9 | 64.0 |
| Rv0948c | .705 | 0.0406 | 69.2 | 28.0 |
| PANEL* | .868 | <0.0001 | 85.3 | 84.0 |
| SA/HIV+ (24 TB− 89 TB+) | ||||
| Rv2853 | .521 | 0.7574 | 13.5 | 12.5 |
| Rv2031c | .512 | 0.8519 | 15.7 | 20.8 |
| Rv0054 | .497 | 0.9661 | 22.5 | 14.3 |
| Rv0831c | .594 | 0.1582 | 34.8 | 41.7 |
| Rv3405c | .747 | 0.0002 | 57.3 | 54.2 |
| Rv3544c | .570 | 0.2923 | 30.3 | 16.9 |
| Rv0222 | .525 | 0.7072 | 27.0 | 20.8 |
| Rv0948c | .567 | 0.3118 | 34.8 | 20.8 |
| PANEL* | .723 | 0.0008 | 53.9 | 50.0 |
Multimarker Panels
Optimal markers under BIC for the US/HIV- subgroup were Rv2031c, Rv0831c and Rv0948c. This classifier had an AUC of 0.807 under leave-one-out cross validation. For the US/HIV+ subgroup, the optimal markers were Rv0054 and Rv0948c, and the classifier had an AUC of 0.782. For the SA/HIV- subgroup, the optimal markers were Rv2853, Rv0054, Rv0831c, Rv3544c and Rv0222. The AUC under cross validation for the SA/HIV- subgroup was 0.868. Finally, for the SA/HIV+ subgroup, only Rv3405c was selected for use in the classifier, which had an AUC of 0.723 under cross validation. The ROC curves for each classifier is shown in Fig. 5 and the statistics presented in Table IV.
Fig. 5.

ROC analysis for TB diagnostic panels developed for each subgroup. A, US/HIV-: Rv2031c, Rv0831c and Rv0948c. B, US/HIV+: Rv0054 and Rv0948c. C, SA/HIV-: Rv2853, Rv0054, Rv0831c, Rv3544c and Rv0222. D, SA/HIV+: Rv3405c; CV: cross-validation.
DISCUSSION
Here we present the generation and validation of a new whole-proteome Mtb HD-NAPPA and show its value for detecting novel biomarkers for TB serodiagnosis. We further demonstrate the feasibility, efficiency, and accuracy of multiplexing proteins into a single spot for expedited high-throughput screening for Ab responses to the Mtb proteome. Using these new methods, we discovered several novel proteins that elicit Ab responses in TB. We created multimarker panels to distinguish TB patients from noninfected or latently infected subjects, with and without HIV coinfection across two geographic regions. With this initial evaluation, we identified 8 proteins that show potential as TB diagnostic biomarkers.
We originally introduced HD-NAPPA for its capability of achieving up to 8000–10,000 high density spots, as compared with standard flat-glass NAPPA with ∼ 2300 spots per slide (16). This increase in density reduces screening costs and processing time. In addition, HD-NAPPA provides a higher signal to noise ratio for Ab biomarker discovery as compared with flat-glass NAPPA (15, 16). Using M-HD-NAPPA arrays, where the screen utilizes multiplexing of targets, can further accelerate Ab biomarker screening. To perform serum Ab profiling over the whole Mtb proteome (around 4000 genes), flat-glass based NAPPA requires two slides per sample. In contrast, HD-NAPPA requires only a half slide and the M-HD-NAPPA (using 3-target multiplex per spot) requires only a quarter of a slide. Thus, the capacity to process 8 times more samples than flat-glass based NAPPA would not only facilitate the Ab discovery speed, but also result in significant reagent cost savings.
The possibility that low protein expression levels, from one of the three proteins in the mix, could mask detection was a concern. The concept validation experiments (supplemental Fig. S1) alleviated this concern. The results showed that 100% of high and medium signal intensity responses and 91.5% of low-signal intensity responses were detected when proteins were mixed in all possible combinations. In addition, we had previously demonstrated adequate individual protein expression levels using glass-based NAPPA (13, 15, 16, 30). To print the 4,045 plasmids required creating two glass arrays, termed TB array 01 and TB array 02. With these arrays of individually-printed Mtb plasmids, we performed expression and demonstrated expression Mtb proteins by detection of the fusion partner with anti-GST staining. As shown in supplemental Fig. S6, TB array 01 and TB array 02 contained 4,045 Mtb proteins and the display rate for TB array 01 were from 91.3% to 93.7% whereas the TB array 02 were 99.8% separately and the overall display rates were 96.1%.
Consistent with other studies, we observed a high level of heterogeneity in Ab responses to Mtb proteins, including those with biomarker value (6, 7, 9, 10, 31). Hence, our data are consistent with the notion that a single biomarker will not be sufficient for distinguishing TB status in various patient groups (6, 32). Further consistent with prior studies by us and others, we observed qualitatively different host responses in HIV coinfected compared with HIV uninfected TB patients (32–34), as well as quantitatively different Ab levels in proportion to extent of disease (6, 34). We also observed clear regional differences with limited overlap in the proteins recognized by US versus SA within each of the respective HIV-infected and uninfected subgroups. Of note, the expression of Mtb proteins as well as the human Ab response to Mtb is dynamic and dependent on the state of infection and disease (reviewed in (35)). It remains to be explored whether some or all of the observed regional differences in Ab responses were predominately driven by regional difference in disease state—with TB patients from resource-limited TB endemic settings typically being diagnosed at more advanced stages than those living in the US (33), or whether the regional differences could be driven in part by infection with different Mtb strains. We therefore developed individual panels for the four subject subgroups, depending on the geographic region (US or SA) and HIV status (HIV−/+). This approach shows promise and warrants further validation in larger studies within the same and other geographic regions.
The eight candidate immunoreactive Mtb proteins that we identified have varied characteristics. Four of these proteins are secreted and have been identified in Mtb culture filtrates (CFPs; Rv0054, Rv0831c, Rv2031c and Rv0222) (36, 37), with three of these (Rv0054, Rv0831c, Rv2031c) also identified in the cell membrane (38, 39) and two (Rv0831c, Rv2031c) in the cell wall (39, 40). One (Rv0948c (39)) has only been associated with the Mtb membrane fraction. The cellular location for two of the proteins (Rv3405c and Rv3544c) has not been identified. All of the four CFPs (Rv0054 (9, 10, 41), Rv0831c (9, 42), Rv2031c (9, 10, 43, 44) and Rv0222 (45, 46)), have already been reported in TB serology studies. Rv2031c (hspX) was also previously identified using a Mtb proteomic level microarray with printing of unpurified Mtb proteins generated in E. coli lysate (6). Interestingly, we did not identify shared candidate proteins with an independent recent microarray study that was based on printing proteins generated in a Saccharomyces cerevisiae system (47). Overall, we have validated the value of some previously known serological biomarkers and further identified some new TB biomarker candidates.
Advantages of TB serodiagnostic assays over currently available gold standard tests include their independence of a respiratory tract sample, their suitability for all forms of TB, and their ability to be scaled up into rapid, robust, low-cost dip-stick formats for use in remote and very resource-limited settings. Except for the SA/HIV- group, none of our identified biomarker panels provided sufficiently high sensitivity and specificity within each subgroup to replace any of the currently available simple rapid methods, such as the sputum smear microscopy. Nevertheless, our identified protein biomarkers contribute further to the spectrum of already identified Ab targets, and provide the basis for further exploration with other candidate proteins as well as other nonprotein type of Mtb antigens such as lipids, polysaccharides or glycolipids, some of which have also shown diagnostic potential (reviewed in (8, 34)). We thus anticipate that the NAPPA-based identified candidate antigens, if validated in larger studies in diverse TB endemic regions, could contribute to the generation of simple lateral-flow tests. Such simple tests exist already for the diagnosis of other complex and difficult to diagnose infectious diseases such as leprosy or crytococcosis (48, 49). Such simple tests could further be evaluated as screening tools as well as in combination with other diagnostic methods, especially in those groups that are particularly challenging to diagnose, such as HIV coinfected and/or extrapulmonary TB patients, patients with insipient or culture-negative TB, or pediatric TB patients (50–54).
We note that our work focused on the generation of the HD-NAPPA and M-HD-NAPPA with preliminary screening of samples and validation of candidate proteins. Our study was limited by a small sample size in some groups such as the SA/HIV- TB+ group, the lack of evaluation of samples from patients with other respiratory diseases than TB, and the testing of patients from a broad range of geographic regions. However, the majority of TB patients diagnosed in the US had emigrated from various TB endemic regions, including Asia, South America and Africa, regions where they were likely infected originally. It was further beyond the scope of the present study to generate and express Mtb proteins in M. smegmatis or eukaryotic cells to assure preservation of post-translational modification of our identified candidate proteins. Further studies are thus needed to validate our findings and expand them to a larger scale including various patient populations enrolled in diverse TB endemic regions that include populations with high numbers of multi drug-resistant (MDR) TB cases.
In summary, we demonstrate that our newly developed Mtb proteome HD-NAPPA has the potential to identify proteins whose immunogenicity has been previously unknown. We demonstrate that the multiplexing of protein genes into a single spot allows for expedited reliable high-throughput screening for Ab responses and has value for detecting novel biomarker for TB serodiagnosis. Our findings highlight the heterogeneity of Ab responses to Mtb and indicate that clinically useful serodiagnostic tests might have to be developed for specific target patient groups. Larger studies, especially in combinations with other antigens, biomarkers, and/or diagnostic tests are needed to further explore the value of our identified biomarker proteins.
Supplementary Material
Footnotes
Author contributions: L.S., X.Y., J.Q., J.L., D.M.M., and J.M.A. designed research; L.S., G.W., X.Y., M.H., J.V., J.S., P.W., P.K., A.B., D.M.M., and J.M.A. performed research; L.S., G.W., J.P., P.W., P.K., A.B., D.W., E.R.J., J.Q., J.L., D.M.M., and J.M.A. contributed new reagents or analytic tools; L.S., G.W., D.M.M., and J.M.A. analyzed data; L.S., G.W., J.L., D.M.M., and J.M.A. wrote the paper.
* This work was supported by a grant from the National Institute of Health (NIH)/the National Institute of Allergy and Infectious Diseases (NIAID) RO1AI096213 (to DMM, JMA and JL,) and in part by the grants AI105684 (to JMA) and R01AI117927 (to JMA and MM), and Small Business Innovation Research Grant (SBIR) R42GM106704 (PW, PK, JQ, DMM, JL). The content is solely the responsibility of the authors and does not necessarily represent the official views of the National Institutes of Health.
 This article contains supplemental material.
1 The abbreviations used are:
- TB
- Tuberculosis
- Ab
- Antibody
- AFB
- Acid-fast Bacilli
- AUC
- Area under the curve
- BIC
- Bayes Information Criteria
- BS3
- Bis(sulfosuccinimidyl)suberate
- CM
- Cell membrane
- CW
- Cell Wall
- CFP
- Culture filtrate protein
- DEPC
- Diethylpyrocarbonate
- EBNA
- Epstein Barr Nuclear Antigen
- EBV
- Epstein Barr Virus
- GST
- Glutathione-S-transferase
- HIV
- Human Immunodefiency virus
- IgA
- Immunoglobulin A
- IgG
- Immunoglobulin G
- mAb
- Monoclonal Antibody
- Mtb
- Mycobacterium tuberculosis
- MM
- Master Mix
- NAPPA
- Nucleic Acid Programmable Protein Array
- HD-NAPPA
- High Density NAPPA
- M-HD-NAPPA
- Multiplex HD-NAPPA
- NAA
- Nucleic Acid Amplification
- NTBD
- Nontuberculosis Disease
- PBST
- Phosphate buffered saline with tween20
- PCR
- Polymerase chain reaction
- POC
- Point of care
- pROC
- Display and analyze ROC, curve
- ROC
- Receiver operating characteristic curve
- S/B
- Signal to Background
- TST
- Tuberculin skin test.
REFERENCES
- 1. Organization W. H. (2016) Global tuberculosis report 2016. Switzerland [Google Scholar]
- 2. Pai M. (2015) Innovations in tuberculosis diagnostics: progress and translational challenges. EBioMed. 2, 182–183 [DOI] [PMC free article] [PubMed] [Google Scholar]
- 3. Denkinger C. M., Kik S. V., Cirillo D. M., Casenghi M., Shinnick T., Weyer K., Gilpin C., Boehme C. C., Schito M., Kimerling M., and Pai M. (2015) Defining the needs for next generation assays for tuberculosis. J. Infect. Dis. 211, S29-S38 [DOI] [PMC free article] [PubMed] [Google Scholar]
- 4. Steingart K. R., Flores L. L., Dendukuri N., Schiller I., Laal S., Ramsay A., Hopewell P. C., and Pai M. (2011) Commercial serological tests for the diagnosis of active pulmonary and extrapulmonary tuberculosis: an updated systematic review and meta-analysis. PLoS Med. 8, e1001062. [DOI] [PMC free article] [PubMed] [Google Scholar]
- 5. Steingart K. R., Henry M., Laal S., Hopewell P. C., Ramsay A., Menzies D., Cunningham J., Weldingh K., and Pai M. (2007) Commercial serological antibody detection tests for the diagnosis of pulmonary tuberculosis: a systematic review. PLoS Med. 4, e202. [DOI] [PMC free article] [PubMed] [Google Scholar]
- 6. Kunnath-Velayudhan S., Salamon H., Wang H. Y., Davidow A. L., Molina D. M., Huynh V. T., Cirillo D. M., Michel G., Talbot E. A., Perkins M. D., Felgner P. L., Liang X., and Gennaro M. L. (2010) Dynamic antibody responses to the Mycobacterium tuberculosis proteome. Proc. Natl. Acad. Sci. U.S.A. 107, 14703–14708 [DOI] [PMC free article] [PubMed] [Google Scholar]
- 7. Lyashchenko K., Colangeli R., Houde M., Al Jahdali H., Menzies D., and Gennaro M. L. (1998) Heterogeneous antibody responses in tuberculosis. Infect. Immun. 66, 3936–3940 [DOI] [PMC free article] [PubMed] [Google Scholar]
- 8. Steingart K. R., Dendukuri N., Henry M., Schiller I., Nahid P., Hopewell P. C., Ramsay A., Pai M., and Laal S. (2009) Performance of purified antigens for serodiagnosis of pulmonary tuberculosis: a meta-analysis. Clin. Vaccine Immunol. 16, 260–276 [DOI] [PMC free article] [PubMed] [Google Scholar]
- 9. Burbelo P. D., Keller J., Wagner J., Klimavicz J. S., Bayat A., Rhodes C. S., Diarra B., Chetchotisakd P., Suputtamongkol Y., Kiertiburanakul S., Holland S. M., Browne S. K., Siddiqui S., and Kovacs J. A. (2015) Serological diagnosis of pulmonary Mycobacterium tuberculosis infection by LIPS using a multiple antigen mixture. BMC Microbiol. 15, 205. [DOI] [PMC free article] [PubMed] [Google Scholar]
- 10. Khan I. H., Ravindran R., Krishnan V. V., Awan I. N., Rizvi S. K., Saqib M. A., Shahzad M. I., Tahseen S., Ireton G., Goulding C. W., Felgner P., DeRiemer K., Khanum A., and Luciw P. A. (2011) Plasma antibody profiles as diagnostic biomarkers for tuberculosis. Clin. Vaccine Immunol. 18, 2148–2153 [DOI] [PMC free article] [PubMed] [Google Scholar]
- 11. Morris K. (2011) WHO recommends against inaccurate tuberculosis tests. Lancet 377, 113–114 [DOI] [PubMed] [Google Scholar]
- 12. Yu X., Petritis B., and LaBaer J. (2016) Advancing translational research with next-generation protein microarrays. Proteomics 16, 1238–1250 [DOI] [PMC free article] [PubMed] [Google Scholar]
- 13. Montor W. R., Huang J., Hu Y., Hainsworth E., Lynch S., Kronish J. W., Ordonez C. L., Logvinenko T., Lory S., and LaBaer J. (2009) Genome-wide study of Pseudomonas aeruginosa outer membrane protein immunogenicity using self-assembling protein microarrays. Infect. Immun. 77, 4877–4886 [DOI] [PMC free article] [PubMed] [Google Scholar]
- 14. Anderson K. S., Sibani S., Wallstrom G., Qiu J., Mendoza E. A., Raphael J., Hainsworth E., Montor W. R., Wong J., Park J. G., Lokko N., Logvinenko T., Ramachandran N., Godwin A. K., Marks J., Engstrom P., and Labaer J. (2011) Protein microarray signature of autoantibody biomarkers for the early detection of breast cancer. J. Proteome Res. 10, 85–96 [DOI] [PMC free article] [PubMed] [Google Scholar]
- 15. Bian X., Wasserfall C., Wallstrom G., Wang J., Wang H., Barker K., Schatz D., Atkinson M., Qiu J., and LaBaer J. (2017) Tracking the antibody immunome in Type 1 diabetes using protein arrays. J. Proteome Res. 16, 195–203 [DOI] [PubMed] [Google Scholar]
- 16. Bian X., Wiktor P., Kahn P., Brunner A., Khela A., Karthikeyan K., Barker K., Yu X., Magee M., Wasserfall C. H., Gibson D., Rooney M. E., Qiu J., and LaBaer J. (2015) Antiviral antibody profiling by high-density protein arrays. Proteomics 15, 2136–2145 [DOI] [PMC free article] [PubMed] [Google Scholar]
- 17. Ramachandran N., Hainsworth E., Bhullar B., Eisenstein S., Rosen B., Lau A. Y., Walter J. C., and LaBaer J. (2004) Self-assembling protein microarrays. Science 305, 86–90 [DOI] [PubMed] [Google Scholar]
- 18. Ramachandran N., Raphael J. V., Hainsworth E., Demirkan G., Fuentes M. G., Rolfs A., Hu Y., and LaBaer J. (2008) Next-generation high-density self-assembling functional protein arrays. Nat. Methods 5, 535–538 [DOI] [PMC free article] [PubMed] [Google Scholar]
- 19. Park J., Throop A. L., and LaBaer J. (2015) Site-specific recombinational cloning using gateway and in-fusion cloning schemes. Curr. Protoc. Mol. Biol. 110, 3 20, 21–23 [DOI] [PMC free article] [PubMed] [Google Scholar]
- 20. Prados-Rosales R., Carreno L. J., Batista-Gonzalez A., Baena A., Venkataswamy M. M., Xu J., Yu X., Wallstrom G., Magee D. M., LaBaer J., Achkar J. M., Jacobs W. R. Jr, Chan J., Porcelli S. A., and Casadevall A. (2014) Mycobacterial membrane vesicles administered systemically in mice induce a protective immune response to surface compartments of Mycobacterium tuberculosis. MBio 5, e01921-e01914 [DOI] [PMC free article] [PubMed] [Google Scholar]
- 21. Ramachandran N., Srivastava S., and Labaer J. (2008) Applications of protein microarrays for biomarker discovery. Proteomics Clin. Appl. 2, 1444–1459 [DOI] [PMC free article] [PubMed] [Google Scholar]
- 22. Bray P. F., Luka J., Bray P. F., Culp K. W., and Schlight J. P. (1992) Antibodies against Epstein-Barr nuclear antigen (EBNA) in multiple sclerosis CSF, and two pentapeptide sequence identities between EBNA and myelin basic protein. Neurology 42, 1798–1804 [DOI] [PubMed] [Google Scholar]
- 23. Wiktor P., Brunner A., Kahn P., Qiu J., Magee M., Bian X., Karthikeyan K., and LaBaer J. (2015) Microreactor array device. Sci. Rep. 5, 8736. [DOI] [PMC free article] [PubMed] [Google Scholar]
- 24. Ziegenbalg A., Prados-Rosales R., Jenny-Avital E. R., Kim R. S., Casadevall A., and Achkar J. M. (2013) Immunogenicity of mycobacterial vesicles in humans: identification of a new tuberculosis antibody biomarker. Tuberculosis 93, 448–455 [DOI] [PMC free article] [PubMed] [Google Scholar]
- 25. Anderson K. S. (2011) Multiplexed detection of antibodies using programmable bead arrays. Methods Mol. Biol. 723, 227–238 [DOI] [PMC free article] [PubMed] [Google Scholar]
- 26. Frith D. (1993) Bias Reduction of Maximum Likelihood Estimates. Biometrika 80, 27–38 [Google Scholar]
- 27. Robin X., Turck N., Hainard A., Tiberti N., Lisacek F., Sanchez J. C., and Muller M. (2011) pROC: an open-source package for R and S+ to analyze and compare ROC curves. BMC Bioinformatics 12, 77. [DOI] [PMC free article] [PubMed] [Google Scholar]
- 28. Zuroff D. C., and Schwarz J. C. (1978) An instrument for measuring the behavioral dimension of social anxiety. Psychol Rep. 42, 371–379 [DOI] [PubMed] [Google Scholar]
- 29. Morgan J. A. (1972) Calculation of the Residual Sum of Squares for all Possible Regressions. Technometrics 14, 317–325 [Google Scholar]
- 30. Anderson K. S., Ramachandran N., Wong J., Raphael J. V., Hainsworth E., Demirkan G., Cramer D., Aronzon D., Hodi F. S., Harris L., Logvinenko T., and LaBaer J. (2008) Application of protein microarrays for multiplexed detection of antibodies to tumor antigens in breast cancer. J. Proteome Res. 7, 1490–1499 [DOI] [PMC free article] [PubMed] [Google Scholar]
- 31. Chen T., Blanc C., Eder A. Z., Prados-Rosales R., Souza A. C., Kim R. S., Glatman-Freedman A., Joe M., Bai Y., Lowary T. L., Tanner R., Brennan M. J., Fletcher H. A., McShane H., Casadevall A., and Achkar J. M. (2016) Association of human antibodies to arabinomannan with enhanced mycobacterial opsonophagocytosis and intracellular growth reduction. J. Infect. Dis. 214, 300–310 [DOI] [PMC free article] [PubMed] [Google Scholar]
- 32. Achkar J. M., Cortes L., Croteau P., Yanofsky C., Mentinova M., Rajotte I., Schirm M., Zhou Y., Junqueira-Kipnis A. P., Kasprowicz V. O., Larsen M., Allard R., Hunter J., and Paramithiotis E. (2015) Host protein biomarkers identify active tuberculosis in HIV uninfected and co-infected individuals. EBioMedicine 2, 1160–1168 [DOI] [PMC free article] [PubMed] [Google Scholar]
- 33. Achkar J. M., Jenny-Avital E., Yu X., Burger S., Leibert E., Bilder P. W., Almo S. C., Casadevall A., and Laal S. (2010) Antibodies against immunodominant antigens of Mycobacterium tuberculosis in subjects with suspected tuberculosis in the United States compared by HIV status. Clin. Vaccine Immunol. 17, 384–392 [DOI] [PMC free article] [PubMed] [Google Scholar]
- 34. Yu X., Prados-Rosales R., Jenny-Avital E. R., Sosa K., Casadevall A., and Achkar J. M. (2012) Comparative evaluation of profiles of antibodies to mycobacterial capsular polysaccharides in tuberculosis patients and controls stratified by HIV status. Clin. Vaccine Immunol. 19, 198–208 [DOI] [PMC free article] [PubMed] [Google Scholar]
- 35. Kunnath-Velayudhan S., and Gennaro M. L. (2011) Immunodiagnosis of tuberculosis: a dynamic view of biomarker discovery. Clin. Microbiol. Rev. 24, 792–805 [DOI] [PMC free article] [PubMed] [Google Scholar]
- 36. de Souza G. A., Leversen N. A., Malen H., and Wiker H. G. (2011) Bacterial proteins with cleaved or uncleaved signal peptides of the general secretory pathway. J. Proteomics 75, 502–510 [DOI] [PubMed] [Google Scholar]
- 37. Mollenkopf H. J., Jungblut P. R., Raupach B., Mattow J., Lamer S., Zimny-Arndt U., Schaible U. E., and Kaufmann S. H. (1999) A dynamic two-dimensional polyacrylamide gel electrophoresis database: the mycobacterial proteome via Internet. Electrophoresis 20, 2172–2180 [DOI] [PubMed] [Google Scholar]
- 38. Gu S., Chen J., Dobos K. M., Bradbury E. M., Belisle J. T., and Chen X. (2003) Comprehensive proteomic profiling of the membrane constituents of a Mycobacterium tuberculosis strain. Mol. Cell. Proteomics 2, 1284–1296 [DOI] [PubMed] [Google Scholar]
- 39. Mawuenyega K. G., Forst C. V., Dobos K. M., Belisle J. T., Chen J., Bradbury E. M., Bradbury A. R., and Chen X. (2005) Mycobacterium tuberculosis functional network analysis by global subcellular protein profiling. Mol. Biol. Cell 16, 396–404 [DOI] [PMC free article] [PubMed] [Google Scholar]
- 40. Rosenkrands I., Weldingh K., Jacobsen S., Hansen C. V., Florio W., Gianetri I., and Andersen P. (2000) Mapping and identification of Mycobacterium tuberculosis proteins by two-dimensional gel electrophoresis, microsequencing and immunodetection. Electrophoresis 21, 935–948 [DOI] [PubMed] [Google Scholar]
- 41. Covert B. A., Spencer J. S., Orme I. M., and Belisle J. T. (2001) The application of proteomics in defining the T cell antigens of Mycobacterium tuberculosis. Proteomics 1, 574–586 [DOI] [PubMed] [Google Scholar]
- 42. Ireton G. C., Greenwald R., Liang H., Esfandiari J., Lyashchenko K. P., and Reed S. G. (2010) Identification of Mycobacterium tuberculosis antigens of high serodiagnostic value. Clin. Vaccine Immunol. 17, 1539–1547 [DOI] [PMC free article] [PubMed] [Google Scholar]
- 43. Lee B. Y., Hefta S. A., and Brennan P. J. (1992) Characterization of the major membrane protein of virulent Mycobacterium tuberculosis. Infect. Immun. 60, 2066–2074 [DOI] [PMC free article] [PubMed] [Google Scholar]
- 44. Verbon A., Hartskeerl R. A., Schuitema A., Kolk A. H., Young D. B., and Lathigra R. (1992) The 14,000-molecular-weight antigen of Mycobacterium tuberculosis is related to the alpha-crystallin family of low-molecular-weight heat shock proteins. J. Bacteriol. 174, 1352–1359 [DOI] [PMC free article] [PubMed] [Google Scholar]
- 45. Rosenkrands I., Aagaard C., Weldingh K., Brock I., Dziegiel M. H., Singh M., Hoff S., Ravn P., and Andersen P. (2008) Identification of Rv0222 from RD4 as a novel serodiagnostic target for tuberculosis. Tuberculosis 88, 335–343 [DOI] [PubMed] [Google Scholar]
- 46. Siev M., Wilson D., Kainth S., Kasprowicz V. O., Feintuch C. M., Jenny-Avital E. R., and Achkar J. M. (2014) Antibodies against Mycobacterial proteins as biomarkers for HIV-associated smear-negative tuberculosis. Clin. Vaccine Immunol. 21, 791–798 [DOI] [PMC free article] [PubMed] [Google Scholar]
- 47. Deng J., Bi L., Zhou L., Guo S. J., Fleming J., Jiang H. W., Zhou Y., Gu J., Zhong Q., Wang Z. X., Liu Z., Deng R. P., Gao J., Chen T., Li W., Wang J. F., Wang X., Li H., Ge F., Zhu G., Zhang H. N., Gu J., Wu F. L., Zhang Z., Wang D., Hang H., Li Y., Cheng L., He X., Tao S. C., and Zhang X. E. (2014) Mycobacterium tuberculosis proteome microarray for global studies of protein function and immunogenicity. Cell Rep. 9, 2317–2329 [DOI] [PubMed] [Google Scholar]
- 48. Duthie M. S., Balagon M. F., Maghanoy A., Orcullo F. M., Cang M., Dias R. F., Collovati M., and Reed S. G. (2014) Rapid quantitative serological test for detection of infection with Mycobacterium leprae, the causative agent of leprosy. J. Clin. Microbiol. 52, 613–619 [DOI] [PMC free article] [PubMed] [Google Scholar]
- 49. Lindsley M. D., Mekha N., Baggett H. C., Surinthong Y., Autthateinchai R., Sawatwong P., Harris J. R., Park B. J., Chiller T., Balajee S. A., and Poonwan N. (2011) Evaluation of a newly developed lateral flow immunoassay for the diagnosis of cryptococcosis. Clin. Infect. Dis. 53, 321–325 [DOI] [PMC free article] [PubMed] [Google Scholar]
- 50. Achkar J. M., and Jenny-Avital E. R. (2011) Incipient and subclinical tuberculosis: defining early disease states in the context of host immune response. J. Infect. Dis. 204, S1179-S1186 [DOI] [PMC free article] [PubMed] [Google Scholar]
- 51. Achkar J. M., Lawn S. D., Moosa M. Y., Wright C. A., and Kasprowicz V. O. (2011) Adjunctive tests for diagnosis of tuberculosis: serology, ELISPOT for site-specific lymphocytes, urinary lipoarabinomannan, string test, and fine needle aspiration. J. Infect. Dis. 204 Suppl 4, S1130-S1141 [DOI] [PMC free article] [PubMed] [Google Scholar]
- 52. Achkar J. M., and Ziegenbalg A. (2012) Antibody responses to mycobacterial antigens in children with tuberculosis: challenges and potential diagnostic value. Clin. Vaccine Immunol. 19, 1898–1906 [DOI] [PMC free article] [PubMed] [Google Scholar]
- 53. Lawn S. D. (2014) Serological diagnostic assays for HIV-associated tuberculosis in sub-Saharan Africa? Clin. Vaccine Immunol. 21, 787–790 [DOI] [PMC free article] [PubMed] [Google Scholar]
- 54. Nguyen M. V., Jenny-Avital E. R., Burger S., Leibert E. M., and Achkar J. M. (2015) Clinical and radiographic manifestations of sputum culture-negative pulmonary tuberculosis. PLoS ONE 10, e0140003. [DOI] [PMC free article] [PubMed] [Google Scholar]
Associated Data
This section collects any data citations, data availability statements, or supplementary materials included in this article.