Abstract
Context:
1,25-Dihydroxyvitamin D (1,25D) administration and long-term increases in phosphate, PTH, and calcium concentrations are associated with increases in circulating fibroblast growth factor 23 (FGF23); however, whether or not acute changes in serum calcium modulate short-term FGF23 release is unknown.
Objective/Design:
To assess the direct effect of acute changes in calcium and PTH on circulating FGF23 levels.
Setting:
A university clinical and translational research center.
Patients/Participants:
Twelve healthy volunteers and 10 dialysis patients.
Interventions:
Calcium gluconate and sodium citrate were infused for 120 minutes on 2 consecutive days.
Main Outcome Measures:
Serum levels of ionized calcium, phosphorus, PTH, 1,25D, and plasma C-terminal FGF23 levels were obtained at 0, 13, 30, 60, 90, and 120 minutes during the infusions.
Results:
During the calcium infusion, serum calcium concentrations increased from 1.33 ± 0.01 to 1.57 ± 0.04 mmol/L (P < .05 from baseline) and from 1.20 ± 0.05 to 1.50 ± 0.03 mmol/L (P < .05 from baseline) in healthy subjects and in dialysis patients, respectively, whereas serum calcium values decreased from 1.33 ± 0.01 to 1.03 ± 0.02 mmol/L (P < .05 from baseline) and from 1.26 ± 0.04 to 1.07 ± 0.03 mmol/L (P < .05 from baseline) in the two groups, respectively during the sodium citrate infusion. PTH levels decreased from 35 (29, 57) to 8 (2,10) pg/mL (healthy subjects) (P < .05 from baseline) and from 292 (109, 423) to 44 (28, 86) pg/mL (dialysis patients) (P < .05 from baseline) during the calcium infusion and rose from 31 (25, 56) to 122 (95, 157) pg/mL and from 281 (117, 607) to 468 (169, 928) pg/mL (P < .05 from baseline) during sodium citrate infusion. Serum 1,25D levels and plasma FGF23 values remained unchanged during both infusions in both groups.
Conclusions:
Short-term changes in calcium and PTH levels do not affect FGF23 concentrations in either healthy volunteers or dialysis patients.
Circulating levels of calcium and phosphorus are regulated by a complex feedback system involving hormones derived from the parathyroid glands (PTH), kidneys (1,25-dihydroxyvitamin D [1,25D]), and bone (fibroblast growth factor 23 [FGF23]). The levels of mineral ions in blood, in turn, affect circulating PTH, 1,25D, and FGF23 concentrations. Indeed, phosphorus has been implicated in the regulation of PTH (1), 1,25D (2), and FGF23 (3, 4), whereas circulating calcium concentrations affect primarily PTH synthesis and secretion (1, 5) and to some extent 1,25D production. Prolonged elevation of phosphorus increases FGF23 levels (3), whereas reductions in phosphorus are associated with decreases in FGF23 (6). The role of calcium in the regulation of FGF23, however, remains less well defined. Serum calcium concentrations have been associated with FGF23 values in cross-sectional studies of dialysis patients (7), hypocalcemia is associated with a blunted FGF23 response to phosphate in rats with normal kidney function (8), and chronic increases in calcium intake and/or absorption are associated with increased FGF23 levels in animals and humans; however, whether these effects may be, in part, mediated by changes in 1,25D remains unclear (9–11). In dialysis patients, acute changes in serum calcium, occurring concomitantly with acute concomitant changes in serum phosphorus, have been associated with increments in circulating FGF23 concentrations (6); however, a direct role for acute changes in serum calcium, independent of changes in phosphorus, in the modulation of FGF23 secretion in humans with normal kidney function and those with chronic kidney disease (CKD) has not been defined.
Current data suggest that FGF23 may increase with long-term stimulation by PTH (12–14); however, in vivo evidence that PTH directly stimulates osteocytic FGF23 secretion is lacking. The interpretation of recent in vivo PTH infusion data, in which FGF23 levels rise in response to PTH exposure, and data from parathyroidectomized patients, in which FGF23 values decline while levels of its cofactor, Klotho, rise (15), are complicated by the fact that simultaneous changes in circulating calcitriol and phosphorus values, which have themselves been implicated in the regulation of FGF23 (13, 14), also occur. Moreover, some data suggest that CKD is marked by deficiency in Klotho (16) and the effect that such CKD-mediated changes may have on skeletal response to changes in mineral ion homeostasis, is unknown. The current study was therefore designed to acutely alter serum calcium and PTH in healthy volunteers and in dialysis patients without increasing serum phosphate concentrations in order to assess whether there is a direct effect of these acute changes on FGF23 values.
Subjects and Methods
Potential subjects for the study were between 18 and 24 years of age and had a body weight greater than 30 kg. Healthy volunteers (n = 12) and stable CKD stage 5 patients who had been treated with maintenance dialysis (peritoneal dialysis, n = 5; or hemodialysis, n = 5) for at least 6 months were recruited for the study. All subjects were admitted to the UCLA Clinical Translational Research Center, after overnight fasting. On day 1, sodium citrate was infused continuously for 120 minutes, and on day 2, calcium gluconate was infused for the same length of time, as previously reported (13). All infusions were initiated between 8 and 9 am. For healthy volunteers, exclusion criteria were: diseases of bone and mineral metabolism, chronic medical illness (including obesity), and the regular ingestion of any type of medication. For dialysis patients, exclusion criteria were: parathyroidectomy within the past 12 months, and treatment with prednisone, immunosuppressive agent, or GH within the preceding 6 months. All dialysis patients were treated with phosphate binders, vitamin D sterols, and/or calcimimetic therapy as prescribed by their treating physicians; calcimimetic therapy, if prescribed by the treating physician, was held for 1 month before the study. Vitamin D therapy was continued up until the time of admission, but was withheld during the days of the infusions. Patients undergoing peritoneal dialysis used a 2.5 mEq/L calcium dialysate concentration, and those treated with hemodialysis received thrice-weekly dialysis treatments with a calcium concentration of 2 mEq/L. Patients did not receive dialysis during the days of the infusions and were fasting for 12 hours before each of the infusions. The study was approved by the UCLA Human Subject Protection Committee, and informed consent was obtained from all patients.
Study protocol
Vital signs were obtained before each infusion and monitored every 10 minutes during infusions. Separate catheters were placed in a superficial vein of each arm—one used for obtaining blood samples, and the other for infusions of either calcium gluconate or sodium citrate—and patency was maintained by periodic flushes with 0.9% saline. On the first day of study, sodium citrate was infused at a rate titrated to lower serum ionized calcium levels by at least 0.2 mmol/L from baseline values, as previously described (17, 18). On the following day, 10% calcium gluconate was infused at a rate titrated to achieve a progressive rise in serum ionized calcium to at least 0.2 mmol/L above baseline values (17, 18). Serum levels of ionized calcium, phosphorus, PTH, and plasma C-terminal FGF23 levels were obtained at 0, 13, 30, 60, 90, and 120 minutes during the infusions. 1,25D and intact FGF23 values were obtained at 0 and 120 minutes.
Serum ionized calcium levels were determined at the bedside using a CRT8 (Nova Biomedical), whereas biochemical determinations for phosphorus were determined using an Olympus AU5400 (Olympus America Inc). PTH levels were measured by a first-generation assay that measures the full-length molecule and amino-terminally truncated fragments primarily composed of PTH(7–84) (19) (normal range, 10 to 65 pg/mL). FGF23 levels were determined in plasma using two different assays: a second-generation ELISA that measures intact FGF23, as well as a C-terminal fragment and is therefore referred to as “cFGF-23” assay; and a second-generation ELISA that measures intact FGF23 alone (the “intact” assay). Measurements of FGF23 by the C-terminal assay are reported in relative units (RU)/mL; intact FGF23 is reported in pg/mL. PTH and FGF23 assays were developed by Immutopics International.
Statistical analysis
Data with a normal distribution are presented as mean and standard error; skewed data are presented as the median (interquartile range). Differences in biochemical parameters between normal controls and dialysis patients at baseline were assessed using the Student t test or the Wilcoxon rank sum, depending on variable distribution. Linear regression was performed to compare changes in biochemical parameters over time. To compare differences between groups in changes in biochemical parameters with repeated measures (calcium, phosphorus, PTH, and C-terminal FGF23) over time, a random coefficient model was developed to fit a regression line for each group, allowing a random intercept and random slope for each individual. Group (healthy volunteer vs dialysis patient), treatment group (calcium vs sodium citrate), time, time by group, and time by treatment group parameters were included in the model. Univariate analysis was used to assess whether significant changes occurred over time in parameters with only baseline and final values (1,25D and intact FGF23). Statistical analysis was performed using SAS software (SAS Institute, Inc), and all tests were two-sided with a significance level P < .05.
Results
Study subject characteristics
All subjects were between 18 and 24 years of age. The average body mass index was 26.3 ± 1.6 kg/m2 and 26.1 ± 2.4 kg/m2, respectively, in the 12 healthy subjects (10 males, two females; ethnicity—three White, five Hispanic, and four Black) and 10 dialysis patients (eight males, two females; ethnicity—two White and eight Hispanic).
Changes in biochemical variables during sodium citrate infusion
As per protocol, serum calcium levels declined by at least 0.2 mmol/L from baseline values in all subjects during the course of the citrate infusion (Figure 1). Serum levels of phosphate were higher at baseline in dialysis patients than in healthy volunteers, and levels declined during the course of the infusion in healthy volunteers while remaining unchanged in dialysis patients. Plasma PTH concentrations were higher in dialysis patients than in healthy volunteers at baseline; values increased in healthy volunteers but did not demonstrate a significant change from baseline in dialysis patients. Baseline FGF23 concentrations, by both the intact and C-terminal assays, were higher in dialysis patients than in healthy subjects. Values by both assays did not change in either group during the course of the sodium citrate infusion (Figures 2–5). Moreover, neither baseline serum calcium, nor phosphorus values, nor the change in calcium and phosphorus levels during the infusion were related to any apparent changes in FGF23 (Supplemental Figures 1–4).
Figure 1. Serum ionized calcium levels rose during calcium and sodium citrate infusions.
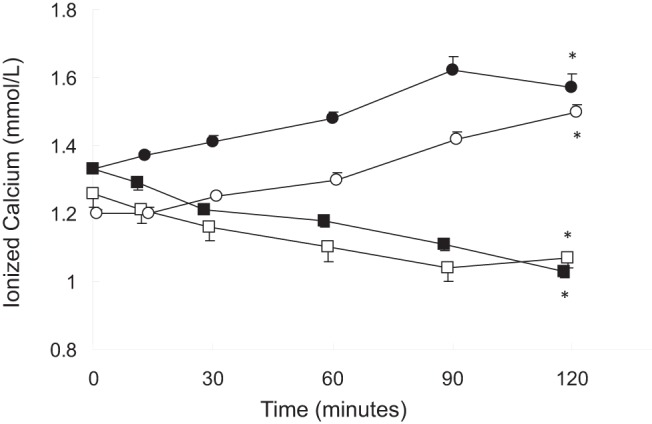
Healthy volunteers receiving calcium, closed circles; dialysis patients receiving calcium, open circles; healthy volunteers receiving sodium citrate, closed squares; dialysis patients receiving sodium citrate, open squares. The asterisk indicates a difference from baseline (P < .05).
Figure 2. Serum phosphorus levels during calcium and sodium citrate infusions.
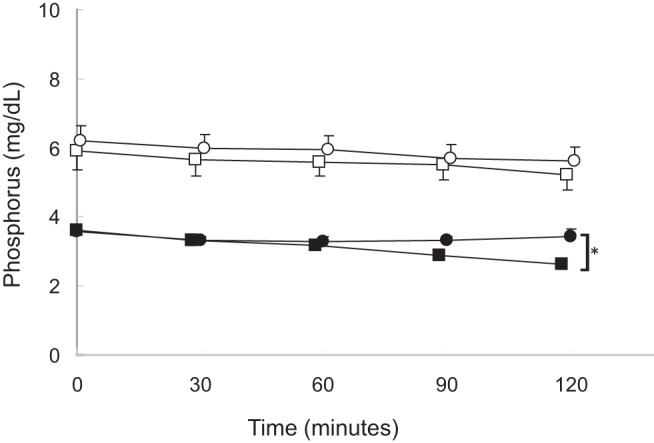
Healthy volunteers receiving calcium, closed circles; dialysis patients receiving calcium, open circles; healthy volunteers receiving sodium citrate, closed squares; dialysis patients receiving sodium citrate, open squares. The asterisk indicates a difference from baseline (P < .05).
Figure 3. First-generation PTH values during calcium and sodium citrate infusions.
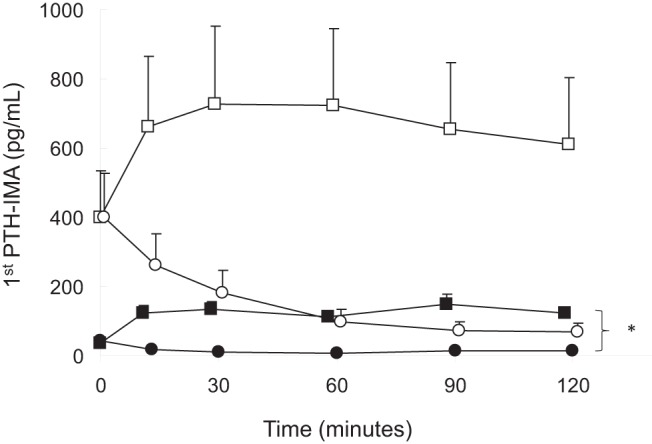
Healthy volunteers receiving calcium, closed circles; dialysis patients receiving calcium, open circles; healthy volunteers receiving sodium citrate, closed squares; dialysis patients receiving sodium citrate: open squares. The asterisk indicates a difference from baseline (P < .05).
Figure 4. A and B, C-terminal FGF23 levels in healthy volunteers (A) and dialysis patients (B) during either calcium infusion (circles) or sodium citrate infusion (squares).
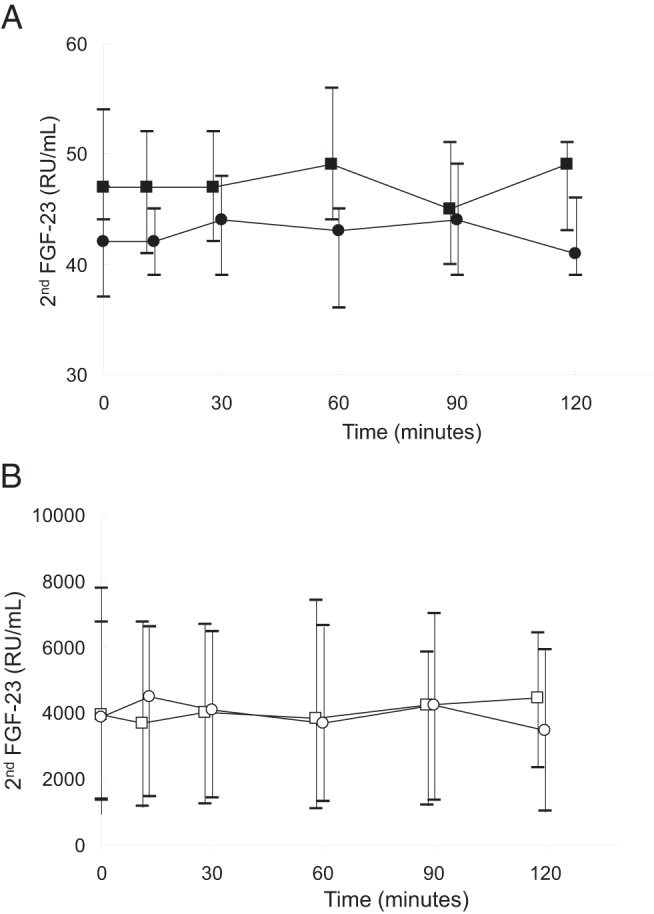
Medians and interquartile ranges are displayed.
Figure 5. Percentage change in C-terminal FGF23 levels from baseline.
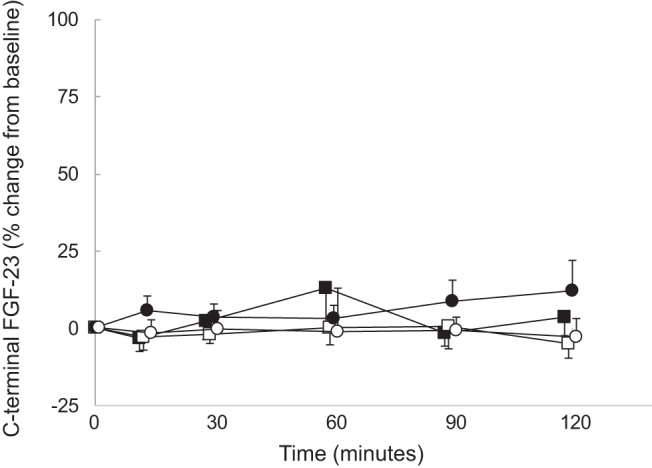
Healthy volunteers receiving calcium, closed circles; dialysis patients receiving calcium, open circles; healthy volunteers receiving sodium citrate, closed squares; dialysis patients receiving sodium citrate, open squares.
Changes in biochemical variables during calcium infusion
Initial and final biochemical values in healthy volunteers and in dialysis patients are displayed in Table 1. At baseline, serum calcium levels were lower in healthy volunteers than in dialysis patients. As dictated by the titration protocol, serum calcium levels rose by at least 0.2 mmol/L from baseline values in all subjects by the end of the infusion (Figure 1). Baseline serum phosphate, plasma PTH, and plasma intact and C-terminal FGF23 concentrations were higher in dialysis patients than in healthy volunteers. Although phosphate and FGF23 levels by both assays remained unchanged in both healthy volunteers and dialysis patients, PTH concentrations declined during the course of the calcium infusion in all subjects (Figures 2–5, respectively). Similar to the findings during citrate infusion, baseline serum calcium, baseline serum phosphorus values, the change in calcium, and the change in phosphorus during the infusion were unrelated to any apparent changes in FGF23 (Supplemental Figures 1–4).
Table 1.
Baseline and Final Biochemical Variables
| Calcium Infusion |
Sodium Citrate Infusion |
|||||||
|---|---|---|---|---|---|---|---|---|
| Healthy Volunteers |
Dialysis Patients |
Healthy Volunteers |
Dialysis Patients |
|||||
| Initial | Final | Initial | Final | Initial | Final | Initial | Final | |
| Ionized calcium, mmol/L | 1.33 ± 0.01 | 1.57 ± 0.04a | 1.20 ± 0.05b | 1.50 ± 0.03a | 1.33 ± 0.01 | 1.03 ± 0.02a | 1.26 ± 0.04 | 1.07 ± 0.03a |
| Phosphate, mg/dL | 3.6 ± 0.1 | 3.4 ± 0.2 | 6.2 ± 0.5b | 5.6 ± 0.4 | 3.6 ± 0.1 | 2.6 ± 0.1a | 5.9 ± 0.5b | 5.2 ± 0.4 |
| PTH, pg/mL | 35 (29, 57) | 8 (2, 10)a | 292 (109, 423)b | 44 (28, 86)a | 31 (25, 56) | 122 (95, 157)a | 281 (117, 607)b | 468 (169, 928) |
| Calcitriol, pg/mL | 36 (32, 40) | 37 (31, 47) | 9 (8, 15) | 8 (6, 16) | 35 (27, 39) | 31 (25, 37) | 9 (7, 17) | 9 (6, 17) |
| C-terminal FGF23, RU/mL | 42 (37, 47) | 43 (39, 47) | 3858 (1391, 6756)b | 3474 (1017, 5904) | 47 (44, 54) | 49 (43, 51) | 3928 (1337, 7783)b | 4455 (2344, 6430) |
| Intact FGF23, pg/mL | 52 (42, 59) | 58 (48, 76) | 2155 (1371, 3578)b | 2489 (1807, 3271) | 59 (44, 77) | 66 (52, 97) | 2810 (818, 3044)b | 2415 (1051, 2904) |
Data are expressed as mean ± SE or median (interquartile range).
Significant (P < .05) change from baseline.
Significant difference (P < .05) from healthy volunteers at baseline.
Discussion
In the current study, serum calcium concentrations increased acutely during calcium infusion in both healthy volunteers and dialysis patients, but to a greater degree in healthy volunteers. Serum calcium values decreased in all subjects during sodium citrate infusion, as previously reported (13). Consistent with the rise in serum calcium levels, PTH levels decreased in all subjects, with values being nearly completely suppressed in healthy volunteers. On the other hand, PTH values rose during sodium citrate infusion, and the increase was more robust in healthy volunteers than in dialysis patients. Serum phosphorus levels declined during sodium citrate infusion in healthy volunteers but remained unchanged in dialysis patients; furthermore, values did not change from baseline in both healthy volunteers and dialysis patients during calcium infusion. Serum 1,25D levels and FGF23 values remained unchanged from baseline values in both groups of subjects during both infusions.
The current study highlights a decreased sensitivity—or increased resistance—of the parathyroid gland to changes in circulating calcium concentration in patients with advanced CKD. Indeed, despite similar decreases in serum calcium concentrations in response to sodium citrate in healthy controls and in dialysis patients, PTH levels rose by a greater percentage in healthy volunteers. The reason behind the decreased sensitivity to changes in serum calcium is likely multifactorial, including increased endogenous PTH secretion at baseline from hyperplastic parathyroid glands combined with decreased calcium-sensing receptor density (19), but other factors such as fragments of the PTH molecule with biological actions distinct from those of the full-length molecule (13, 20) or changes in factors such as Klotho expression (16) may also be involved.
Induction of acute changes in serum calcium concentrations by modification of dialysate calcium concentration has been frequently utilized to assess parathyroid gland function in dialysis patients. Unfortunately, variables such as phosphate that can modify PTH behavior may also change during hemodialysis therapy (13). Indeed, whereas a decrease in serum PTH levels is typically associated with increased circulating calcium concentrations, chelation with sodium citrate resulted in a simultaneous decrease in serum calcium and an increase in plasma PTH concentration in all subjects, as well as, interestingly, either a decrease (healthy volunteers) or no change (dialysis patients) in serum phosphorus levels. This combination of alterations, likely occurring as a result of sodium citrate chelation of phosphate, is unique. Although a primary decrease in calcium will result in increased PTH with subsequent phosphaturia in healthy volunteers, an increase in PTH in dialysis patients typically results in increased phosphate concentration, likely due to the release of phosphate from bone (13). Thus, the use of sodium citrate to simultaneously alter calcium and PTH values may allow for a phosphate “clamp” in subjects with different degrees of kidney function.
Recent data have suggested that PTH may stimulate FGF23 production in vitro; however, direct administration of PTH over a 2-day period resulted in increased 1,25D values in healthy volunteers (13, 14) and increased circulating phosphate concentrations in dialysis patients (13), thus confounding the interpretation of in vivo PTH infusion data. FGF23 values decline, whereas Klotho levels rise after parathyroidectomy, but these data are similarly confounded by changes in calcium, phosphorus, and 1,25D levels and intake (15). FGF23 levels rose in response to PTH exposure in these studies, but an increase in circulating calcitriol values in healthy subjects (13, 14) and an increase in circulating phosphorus values in dialysis patients (13), both of which have also been implicated in the regulation of FGF23 (13, 14), were also observed. Moreover, shorter-term PTH (6-h) infusion at quantities sufficient to raise serum calcium levels by 0.4 mg/dL (or approximately 0.1 mmol/L—ie, half of what was achieved in the current study) in healthy subjects may result in a decrease in circulating FGF23 concentrations, potentially through increased renal phosphate excretion, as previously demonstrated (21). Indeed, acute decreases in serum phosphorus, occurring over the course of 150-minute hemodialysis sessions, are also associated with a reduction in FGF23 concentrations, independent of changes in serum calcium and PTH (6); however, the independent effect of acute changes in calcium and PTH on FGF23 has not been evaluated in humans in vivo. In the current study, sodium citrate prevented a PTH-induced rise in serum phosphate in dialysis patients, thus allowing for the assessment of the direct effect of PTH on FGF23 release. FGF23 levels—as measured either by the C-terminal or the intact assay—did not change during either calcium or sodium citrate infusion, despite marked changes in serum calcium and PTH values. This suggests that acute changes in serum calcium do not directly increase FGF23 secretion and also argues that PTH itself may not, in the acute setting, enhance FGF23 secretion or that its effect on FGF23 may require more than 120 minutes to become apparent (10, 11). Moreover, although some data suggest that CKD is marked by Klotho deficiency (16), the current study suggests that the presence of advanced CKD does not appear to modify the response of FGF23 to acute changes in calcium and PTH.
In conclusion, the use of sodium citrate infusions allows for the evaluation of PTH on FGF23 metabolism in dialysis patients because this method prevents the rise in serum phosphate concentration that occurs during PTH infusion. As determined by short-term calcium and sodium citrate infusions, changes in calcium and PTH do not affect circulating FGF23 concentrations, either in healthy volunteers or in dialysis patients. However, further studies are warranted to assess whether long-term changes in calcium and PTH directly may modify circulating FGF23 concentrations in vivo.
Acknowledgments
This work was supported by U. S. Public Health Service Grants DK-67563, DK-35423, DK-51081, DK-073039, and UL1RR-033176 and funds from the Casey Lee Ball Foundation. K.W.-P. was a recipient of a fellowship award from the National Kidney Foundation and the American Society of Nephrology Norman Siegel Award.
Disclosure Summary: H.J. is named on a patent describing the FGF23 assay that was used in this study. None of the other authors of this paper have any financial interest in the information contained in this manuscript.
Funding Statement
This work was supported by U. S. Public Health Service Grants DK-67563, DK-35423, DK-51081, DK-073039, and UL1RR-033176 and funds from the Casey Lee Ball Foundation. K.W.-P. was a recipient of a fellowship award from the National Kidney Foundation and the American Society of Nephrology Norman Siegel Award.
Footnotes
- CKD
- chronic kidney disease
- 1,25D
- 1,25-dihydroxyvitamin D
- FGF23
- fibroblast growth factor 23
- RU
- relative unit.
References
- 1. Naveh-Many T, Bell O, Silver J, Kilav R. Cis and trans acting factors in the regulation of parathyroid hormone (PTH) mRNA stability by calcium and phosphate. FEBS Lett. 2002;529:60–64. [DOI] [PubMed] [Google Scholar]
- 2. Portale AA, Booth BE, Halloran BP, Morris RC Jr. Effect of dietary phosphorus on circulating concentrations of 1,25-dihydroxyvitamin D and immunoreactive parathyroid hormone in children with moderate renal insufficiency. J Clin Invest. 1984;73:1580–1589. [DOI] [PMC free article] [PubMed] [Google Scholar]
- 3. Antoniucci DM, Yamashita T, Portale AA. Dietary phosphorus regulates serum fibroblast growth factor-23 concentrations in healthy men. J Clin Endocrinol Metab. 2006;91:3144–3149. [DOI] [PubMed] [Google Scholar]
- 4. Perwad F, Azam N, Zhang MY, Yamashita T, Tenenhouse HS, Portale AA. Dietary and serum phosphorus regulate fibroblast growth factor 23 expression and 1,25-dihydroxyvitamin D metabolism in mice. Endocrinology. 2005;146:5358–5364. [DOI] [PubMed] [Google Scholar]
- 5. Moallem E, Kilav R, Silver J, Naveh-Many T. RNA-protein binding and post-transcriptional regulation of parathyroid hormone gene expression by calcium and phosphate. J Biol Chem. 1998;273:5253–5259. [DOI] [PubMed] [Google Scholar]
- 6. Wetmore JB, Santos PW, Mahnken JD, et al. . Elevated FGF23 levels are associated with impaired calcium-mediated suppression of PTH in ESRD. J Clin Endocrinol Metab. 2011;96:E57–E64. [DOI] [PMC free article] [PubMed] [Google Scholar]
- 7. Imanishi Y, Inaba M, Nakatsuka K, et al. . FGF-23 in patients with end-stage renal disease on hemodialysis. Kidney Int. 2004;65:1943–1946. [DOI] [PubMed] [Google Scholar]
- 8. Rodriguez-Ortiz ME, Lopez I, Muñoz-Castañeda JR, et al. . Calcium deficiency reduces circulating levels of FGF23. J Am Soc Nephrol. 2012;23:1190–1197. [DOI] [PMC free article] [PubMed] [Google Scholar]
- 9. Shimada T, Yamazaki Y, Takahashi M, et al. . Vitamin D receptor-independent FGF23 actions in regulating phosphate and vitamin D metabolism. Am J Physiol Renal Physiol. 2005;289:F1088–F1095. [DOI] [PubMed] [Google Scholar]
- 10. Cancela AL, Oliveira RB, Graciolli FG, et al. . Fibroblast growth factor 23 in hemodialysis patients: effects of phosphate binder, calcitriol and calcium concentration in the dialysate. Nephron Clin Pract. 2011;117:c74–c82. [DOI] [PubMed] [Google Scholar]
- 11. David V, Dai B, Martin A, Huang J, Han X, Quarles LD. Calcium regulates FGF-23 expression in bone. Endocrinology. 2013;154:4469–4482. [DOI] [PMC free article] [PubMed] [Google Scholar]
- 12. Lavi-Moshayoff V, Wasserman G, Meir T, Silver J, Naveh-Many T. PTH increases FGF23 gene expression and mediates the high-FGF23 levels of experimental kidney failure: a bone parathyroid feedback loop. Am J Physiol Renal Physiol. 2010;299:F882–F889. [DOI] [PubMed] [Google Scholar]
- 13. Wesseling-Perry K, Harkins GC, Wang HJ, et al. . The calcemic response to continuous parathyroid hormone (PTH)(1-34) infusion in end-stage kidney disease varies according to bone turnover: a potential role for PTH(7-84). J Clin Endocrinol Metab. 2010;95:2772–2780. [DOI] [PMC free article] [PubMed] [Google Scholar]
- 14. Burnett-Bowie SM, Henao MP, Dere ME, Lee H, Leder BZ. Effects of hPTH(1-34) infusion on circulating serum phosphate, 1,25-dihydroxyvitamin D, and FGF23 levels in healthy men. J Bone Miner Res. 2009;24:1681–1685. [DOI] [PMC free article] [PubMed] [Google Scholar]
- 15. Takahashi H, Komaba H, Takahashi Y, et al. . Impact of parathyroidectomy on serum FGF23 and soluble Klotho in hemodialysis patients with severe secondary hyperparathyroidism. J Clin Endocrinol Metab. 2014;99:E652–E658. [DOI] [PubMed] [Google Scholar]
- 16. Lim K, Lu TS, Molostvov G, et al. . Vascular Klotho deficiency potentiates the development of human artery calcification and mediates resistance to fibroblast growth factor 23. Circulation. 2012;125:2243–2255. [DOI] [PubMed] [Google Scholar]
- 17. Ramirez JA, Goodman WG, Gornbein J, et al. . Direct in vivo comparison of calcium-regulated parathyroid hormone secretion in normal volunteers and patients with secondary hyperparathyroidism. J Clin Endocrinol Metab. 1993;76:1489–1494. [DOI] [PubMed] [Google Scholar]
- 18. Sanchez CP, Goodman WG, Ramirez JA, et al. . Calcium-regulated parathyroid hormone secretion in adynamic renal osteodystrophy. Kidney Int. 1995;48:838–843. [DOI] [PubMed] [Google Scholar]
- 19. Kifor O, Moore FD Jr, Wang P, et al. . Reduced immunostaining for the extracellular Ca2+-sensing receptor in primary and uremic secondary hyperparathyroidism. J Clin Endocrinol Metab. 1996;81:1598–1606. [DOI] [PubMed] [Google Scholar]
- 20. Slatopolsky E, Finch J, Clay P, et al. . A novel mechanism for skeletal resistance in uremia. Kidney Int. 2000;58:753–761. [DOI] [PubMed] [Google Scholar]
- 21. Gutiérrez OM, Smith KT, Barchi-Chung A, Patel NM, Isakova T, Wolf M. (1-34) Parathyroid hormone infusion acutely lowers fibroblast growth factor 23 concentrations in adult volunteers. Clin J Am Soc Nephrol. 2012;7:139–145. [DOI] [PMC free article] [PubMed] [Google Scholar]


