

Abstract
Photoactivatable-Ribonucleoside-Enhanced Crosslinking and Immunoprecipitation (PAR-CLIP) in combination with next-generation sequencing is a powerful method for identifying endogenous targets of RNA-binding proteins (RBPs). Depending on the characteristics of each RBP, key steps in the PAR-CLIP procedure must be optimized. Here we present a comprehensive step-by-step PAR-CLIP protocol with detailed explanations of the critical steps. Furthermore, we report the application of a new PAR-CLIP data analysis pipeline to three distinct RBPs targeting different annotation categories of cellular RNAs.
Keywords: Next-generation sequencing, UV RNA-protein crosslinking, Ribonucleoprotein analysis, Photocrosslinking
1. Introduction
Cellular RNAs are subject to post-transcriptional gene regulation (PTGR) from biogenesis to degradation. PTGR is controlled by a variety of RNA-binding proteins (RBPs) and ribonucleoprotein complexes (RNPs), which coordinate the maturation, editing, transport, stability, and translation of cellular RNAs [1–3]. In humans, there are over 1,500 RBPs that interact with at least one category of RNA [4]. Each RBP contains one or more RNA-binding domains (RBDs) that can specifically recognize target transcripts.
To identify endogenous targets of RBPs and their respective binding sites, several high-throughput technologies have been developed that combine immunoprecipitation (IP) [5,6] with life cell UV crosslinking of RNAs to proteins [7,8]. UV crosslinking captures the endogenous binding interactions of a RBP to its targets. Combined with deep RNA sequencing, these approaches allow the transcriptome-wide identification of target RNAs [9,10]. One drawback of RNA-RBP IPs is the inevitable isolation of non-crosslinked but specifically bound RNA targets as well as non-specifically bound RNAs or RBPs and their targets to the IP matrix, which contribute to non-crosslinked or false crosslinked background signal. Furthermore, the efficiency of RNA-protein crosslinking is variable by crosslinking method and RBP. In an effort to improve the efficiency of RNA-RBP crosslinking and separate crosslinked target RNAs from co-immunoprecipitated, non-crosslinked background RNAs, our laboratory developed Photoactivatable-Ribonucleoside-Enhanced Crosslinking and Immunoprecipitation (PAR-CLIP) [11,12].
PAR-CLIP relies on the incorporation of highly photoreactive nucleosides, such as 4-thiouridine (4SU), into newly transcribed RNAs in living cells. Cells are then irradiated at 365 nm, leading to crosslinking of 4SU-labeled RNAs to aromatic amino acid side chains of the interacting RBP. The crosslinked nucleotides will be recognized as cytidine analogs by the reverse transcriptase during conversion of crosslinked RNA into cDNA libraries. Hence PAR-CLIP sequence reads show characteristic thymidine-to-cytidine (T-to-C) conversions distinguishing crosslink from co-isolated non-crosslinked input RNAs.
Alternatively, cells can be cultured in medium supplemented with 6-thioguanosine (6SG). Incorporation of the 6SG into nascent RNA and crosslinking can be followed by observation of guanosine-to-adenosine (G-to-A) conversion [11], however, its frequency is substantially lower compared to 4SU. Additionally, 6SG is more toxic resulting in a lower incorporation rate in nascent RNAs. The distribution of positions of crosslinking transitions in target RNAs allows the computational identification of the underlying RNA recognition element (RRE).
PAR-CLIP is widely used to study RNA-RBP interactions in human cell lines but has also been performed using entire organisms, such as Caenorhabditis elegans [13,14] and Saccharomyces cerevisiae [15,16], and cell lines from other organisms, including Drosophila melanogaster [17,18] and mice [19,20].
Here we present an updated step-by-step PAR-CLIP protocol as used currently in our laboratory incorporating original improvements by us and others as detailed in Figure 1 and Table 1. We highlight critical steps that must be optimized specifically for each RBP. We further describe our computational analysis pipeline that determines the quality of PAR-CLIP cDNA libraries and identifies the major crosslinked target RNA categories of the RBPs of interest. In our pipeline, sequence reads are subjected to hierarchical mapping against all categories of RNAs ordered by their abundance, and the frequencies of T-to-C conversions for each RNA category are individually reported.
Fig. 1.

Workflow of a PAR-CLIP experiment. Cells are grown in the presence of a photoactivatable nucleoside, e.g. 4SU, which is incorporated into nascent transcripts. 4SU-Labeled transcripts are crosslinked in life cells using long-wavelength UV light (365 nm). After cell lysis and RNase treatment, RNA-RBP complexes are immunoprecipitated, radiolabeled, and size-fractionated. Following autoradiography, the crosslinked RNAs are recovered and analyzed for their size distribution. RNA molecules of 20–40 nt are used for 3’ and 5’ adapter ligation and small RNA cDNA library preparation. Crosslinked sites are revealed by thymidine-to-cytidine (T-to-C) transitions in sequence reads.
Table 1.
Improvements to earlier published protocol.
| Original protocol [11] | Optimized protocol | Benefit of the change | Reference |
|---|---|---|---|
| Cell lysis for 10 min in lysis buffer containing 0.5% NP40 |
Cell lysis for 30 min in lysis buffer containing 2% NP40 |
Increased recovery of nuclear/nucleolar RBPs in lysate by increased lysis of the nuclear membrane |
This study |
| RNA digestion by RNase T1 | Optimized RNA digestion using different RNases |
Optimized length distribution of RNA fragments and decrease in sequence bias cause by each nuclease |
[25–27] |
| ANTI-FLAG M2 antibody | Use of ANTI-FLAG M2- coupled magnetic beads as alternative to coupling the ANTI-FLAG M2 antibody to protein G magnetic beads |
Increase in IP efficiency for some proteins |
This study |
| Washing antibody-coupled beads with citrate- phosphate buffer |
Washing antibody-coupled beads with 1× PBS-T buffer |
Avoid destabilization of the protein G-antibody interaction using wash buffer with neutral pH instead of acidic pH |
This study |
| Proteinase K digestion is performed for 30 min at 55 °C |
Proteinase K digestion is performed for 30 min at 50 °C |
Lowering the incubation temperature to 50 °C leads to decreased autodigestion of proteinase K and thereby increased proteinase activity towards immunoprecipitated proteins. |
This study |
| Recovery of RBP-RNA complexes from gel by electroelution |
Alternative recovery of RBP-RNA complexes from gel by transfer to a nitrocellulose membrane |
Removal of unspecifically immunoprecipitated RNA and stringent purification of crosslinked protein–RNA complexes |
[28] |
| 3' adapter ligation to RNAs recovered after proteinase K digestion without size selection |
Size selection of RNAs recovered after proteinase K digestion |
Increased 3’ adapter ligation efficiency of RNA fragments of preselected size range |
This study |
| Reverse transcription is performed for 1 h at 42 °C |
Reverse transcription is performed for 2 h at 50 °C |
High cDNA yield using SuperScript III reverse transcriptase. SuperScript III RT is genetically engineered to increase half-life, reduce RNase activity, and increase thermal stability. |
[12] |
2. Critical steps of PAR-CLIP experiments
2.1. Cell culture and 4SU incorporation in nascent RNAs
We have encountered cell-type-dependent variation of the incorporation rate of 4SU into cellular RNA. Thus, prior to any crosslinking experiments, we recommend to optimize the concentration of photoreactive nucleoside supplementing the cell culture medium and the culture incubation time. We recommend conditions yielding 4SU incorporation rates •1% relative to uridine. To determine the incorporation efficiency of 4SU into RNAs, total RNA is isolated from harvested cells and enzymatically digested to ribonucleosides. The nucleoside ratios are then quantified using high-performance liquid chromatography (HPLC) [21] or quantitative mass spectrometry [14]. For HEK293, HeLa, or MCF-7, 10A, and 12 cells, the tissue culture medium is typically supplemented with 50–100 µM 4SU or 6SG for 16 hours to obtain an incorporation rate of 1–4% [11,13,22,23]. A study using the human embryonic stem cell line WA-09 reduced 4SU exposure time to 6 h to minimize cell culture side effect in the absence of feeder cells [24]. We recently determined that the human monocytic THP1 cell line required 500 µM 4SU supplement for 16 hours to arrive at an incorporation rate similar to HEK293 at 100 µM. Labeling of RNA in whole organisms such as C. elegans required low millimolar concentrations of 4SU to reach a 1% incorporation rate [14]. For cell lines derived from Drosophila melanogaster or mice, the 4SU incorporation was comparable to HEK293 cells [17,20].
2.2. Ribonuclease treatment
The ribonuclease (RNase) treatment is another critical step in a PAR-CLIP experiment. The type of RNase, the RNase and RNA concentration in the cell lysate, and the incubation time and temperature determine the degree of RNA fragmentation, which in turn influences the IP efficiency and the preparation of cDNA libraries, sequencing results, and data analyses. It is necessary to optimize the RNase treatment for each family of RBPs as RBP-RNA interactions tend to be unique and influence RNase accessibility and target RNA fragmentation efficiencies (Fig. 2A). The PAR-CLIP protocol includes two steps of RNase treatment. The first RNase digestion is performed prior to IP in the whole cell lysate to break down large RNA-RBP complexes that are otherwise difficult to immunoprecipitate efficiently. Distinct sequence specificity of RNases can be exploited during PAR-CLIP depending on the target RNAs of the RBP of interest. For example, RNase T1 cleaves predominantly single-stranded RNAs after guanosine, leaving 5’ hydroxyl and 3’ phosphate termini. Consequently, sequence reads of a PAR-CLIP library should be enriched for G at their 3’ ends, as well as for an upstream G in the genomic reference of the 5’ most mapped read position. RNase A cleaves the phosphodiester bond with a similar mechanism but a preference for a pyrimidine residue upstream of the cleavage site, i.e. crosslinked reads are enriched for C and U nucleotides at their 3’ ends. Therefore, if target transcripts of an RBP are enriched in specific nucleosides, certain RNases may be preferentially chosen to achieve optimal RNA digestion. To define the effect of different ribonucleases used in CLIP experiments, Kishore and collaborators analyzed the nuclease signature in CLIP data sets and examined the specific patterns caused by different nuclease digests in the nucleotide composition of the identified binding sites [25]. This and other studies may be used to guide the choice of RNases [10,26–32],.
Fig. 2.

Nuclease treatment is a critical step in PAR-CLIP experiments. A) Phosphorimage of an SDS gel that resolved 32P-labeled RNA-FLAG/HA-SSB/La immunoprecipitates (IPs) prepared from untreated lysates and lysates treated with different concentrations (0, 0.1 and 1 U/µl) of either RNase A or RNase T1. M, molecular weight marker. B) Phosphorimage of recovered crosslinked RNAs (from A) after proteinase K digestion and 15% urea gel electrophoresis. Synthetic and 5’ radiolabeled RNAs of 19 and 35 nt in length served as size markers (M).
The second RNase treatment is performed after IP and might be necessary to minimize the size of RNA fragments. However, excessive second RNase digest can result in RNA fragments that are too short to map uniquely to the reference genome or transcriptome. Hence, this step also needs optimization, and the size distribution of isolated RNAs must be monitored. To maximize the fraction of PAR-CLIP reads that map uniquely, we aim for RNA fragments of 20–40 nt in size. To assess the size distribution of the crosslinked RNA fragments, we subject crosslinked RNAs, after proteinase K digestion of the radiolabeled immunoprecipitate, to denaturing polyacrylamide gel electrophoresis and compare their size range to radiolabeled RNA size markers (Fig. 2B).
2.3. Immunoprecipitation (IP)
An efficient IP is essential for a sufficient recovery of crosslinked RNA-RBP complexes. Our protocol was optimized for immunoprecipitating FLAG/HA-tagged RBPs inducibly expressed in HEK293 cells using the commercial ANTI-FLAG M2 antibody [11]. The IP efficacy is highly dependent on the specific antibody as well as the method used for its matrix-coupling (Fig. 3). Antibodies are typically immobilized on Protein-G-coupled magnetic beads by a short incubation period to allow for binding of the antibody Fc-region to Protein G. Alternatively, the commercial ANTI-FLAG M2 antibody can already be purchased as conjugate to superparamagnetic iron impregnated 4% agarose beads. If antibodies specific to the RBP of interest are available, these may be used without first creating a tagged cell lines, though we find it useful to validate such antibodies first using FLAG/HA-tagged cell lines. A recent study tested 700 and validated 438 (62,5%) commercially available antibodies that interrogate 365 unique RBPs for the usage in IP [33].
Fig. 3.
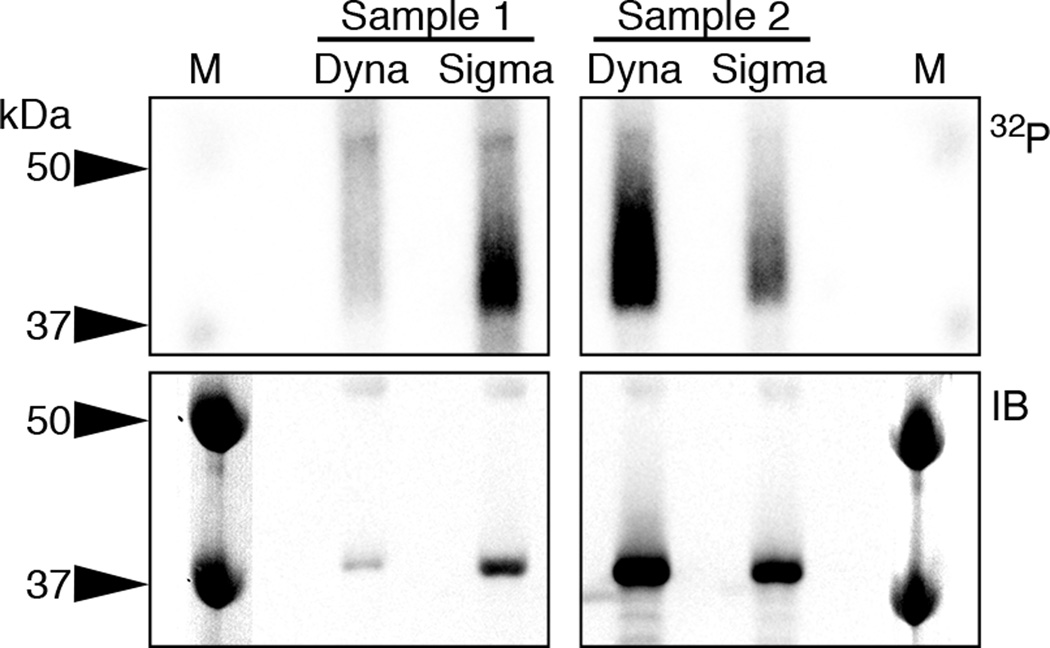
Choice of magnetic beads impacts IP efficiency. Upper panel: Phosphorimage of the SDS gel that resolves 32P-labeled RNA-FLAG/HA-SSB/La IPs using ANTI-FLAG M2 antibody freshly coupled to Dynabeads (Dyna) or commercially pre-conjugated ANTI-FLAG M2 Magnetic Beads (Sigma). Lower panel: Corresponding immunoblot probed with an anti-HA antibody. M, molecular weight marker.
2.4. Radiolabeling of immunoprecipitated RNA
Following IP, RNA fragments are radiolabeled while the RBP is still natively bound to the bead or conjugated matrix and the RNA termini are prepared for adapter ligation. RNase A or T1 leave a 3’ phosphate and a 5' OH termini on the RNA cleavage products, however, cDNA library preparation requires the sequential ligation of 3’ and 5’ adapters to a RNA 3’ OH and 5’ phosphate, respectively. Therefore, a phosphatase treatment is needed to dephosphorylate the 3’ end. The 5’ hydroxyl terminus is subsequently labeled in an enzymatic reaction using a trace amount of -32P-ATP and T4 polynucleotide kinase, followed by a chase with non-radioactive ATP for completion of 5’ end phosphorylation. Some proteins (e.g. translation initiation factors) may occlude the 5’ ends from nucleases or modifying enzymes, in which case the 3’ end of RNA may be labeled using T4 RNA ligase I and [32p]Cp, and 5’ and 3’ termini subsequently modified to be compatible with adapter ligation.
2.5. Multiplexing by barcoding cDNA libraries
Current sequencing methods offer substantial read depth (up to 400 million sequence reads per well for standard Illumina HiSeq). In situations when sequencing depth can be sacrificed, multiplexing libraries is an option to reduce costs and processing time. In our protocols, multiplexing is carried out by ligating distinct pre-adenylated 3’ adapters with unique 5-nt barcodes to the RNA 3’ ends of each sample (Supplementary Table 1) as described by Hafner and collaborators [34]. We recommend to pool uniquely bar-coded libraries only after conversion of individual libraries into DNA at equimolar concentrations. The 20–40 nt size range of PAR-CLIP RNA fragments flanked by the barcode and adapter sequence is covered by 50 nt read length Illumina sequencing. Barcoding by TruSeq Index Sequencing provides an alternative for parallel sequencing of multiple samples. Sorting of reads according to the 3’ barcoded adapter sequences (de-multiplexing) is carried out during the bioinformatics data analysis.
3. Step-by-step protocol
3.1. Material and buffers
The following table lists buffers and reagents according to the time of their use in the protocol.
| Buffer | Composition | Notes |
|---|---|---|
| Growth medium HEK293 cells |
DMEM 10% FBS 2 mM L-glutamine 100 U/ml penicillin 100 U/ml streptomycin |
Adjust growth conditions according to cell lines. |
| 4-thiouridine (4SU) stock solution (1 M) |
260.27 mg 4SU in 1 ml DMSO |
|
| Doxycycline stock solution (10 mg/ml) |
10 mg doxycycline in 1 ml DMSO |
|
| PBS buffer | 137 mM NaCl 2.7 mM KCl 10 mM Na2HPO4 1.8 mM KH2PO4 |
|
| PBS-T buffer | PBS supplied with 0.1% Tween 20 |
|
| 1× NP40 lysis buffer | 50 mM HEPES, pH 7.5 150 mM KCl 2 mM EDTA 1 mM NaF 2% (v/v) NP40 0.5 mM DTT complete EDTA-free Protease Inhibitor Cocktail (Roche) Phosphatase Inhibitor Cocktail tablets PhosSTOP (Roche) |
Prepare a stock of 10× buffer without DTT and protease inhibitors. Add DTT and protease inhibitor directly before the experiment. One Protease Inhibitor Cocktail tablet for 50 ml buffer. One Phosphatase Inhibitor Cocktail tablet for 50 ml buffer. |
| IP-wash buffer | 50 mM HEPES-KOH, pH 7.5 300 mM KCl 0.05% (v/v) NP40 |
Not every antibody will retain its binding ability in 300 mM KCl – adjust the salt concentration accordingly. If in doubt, use lysis buffer instead for washing. |
| High-salt wash buffer | 50 mM HEPES-KOH, pH 7.5 500 mM KCl 0.05% (v/v) NP40 |
Not every antibody will retain its binding ability in 500 mM KCl – adjust the salt concentration accordingly. If in doubt, use lysis buffer instead for washing. |
| Dephosphorylation buffer |
50 mM Tris-HCl, pH 7.9 100 mM NaCl 10 mM MgCl2 1 mM DTT |
Composition is the same as 1× NEB buffer 3 |
| Phosphatase wash buffer |
50 mM Tris-HCl, pH 7.5 20 mM EGTA 0.5% (v/v) NP40 |
|
| Polynucleotide kinase (PNK) buffer without DTT |
50 mM Tris-HCl, pH 7.5 50 mM NaCl 10 mM MgCl2 |
|
| PNK buffer | 50 mM Tris-HCl, pH 7.5 50 mM NaCl 10 mM MgCl2 5 mM DTT |
Composition is the same as 1× NEB PNK buffer |
| 4× SDS PAGE loading buffer |
10% glycerol (v/v) 50 mM Tris-HCl, pH 6.8 2 mM EDTA 2% SDS (w/v) 100 mM DTT 0.1% Bromophenol blue |
|
| 10× SLAB 4 buffer | 250 mM Tris-HCl, pH 8.5 1.9 M glycine 0.5% SDS |
|
| 1× Transfer buffer | 10% 10× SLAB 4 buffer 20% methanol 70% water |
|
| 4× Proteinase K buffer | 200 mM Tris-HCl, pH 7.5 300 mM NaCl 25 mM EDTA 4% (w/v) SDS |
|
| Acidic | 25 ml acidic phenol | |
| Phenol/chloroform/IAA | 24 ml chloroform 1 ml isoamylalcohol |
|
| 10× RNA ligase buffer without ATP |
500 mM Tris-HCl, pH 7.6 100 mM MgCl2 100 mM 2-mercaptoethanol 1 mg/ml acetylated BSA (Sigma, B-8894) |
|
| 10× RNA ligase buffer with ATP |
500 mM Tris-HCl, pH 7.6 100 mM MgCl2 100 mM 2-mercaptoethanol 1 mg/ml acetylated BSA (Sigma, B-8894) 2 mM ATP |
|
| Denaturing PAA gel loading solution |
98.8% formamide 1% (v/v) 0.5 M Na2 H2EDTA, pH 8.0 0.2% Bromophenol blue |
|
| 10× dNTP solution | 2 mM dATP 2 mM dCTP 2 mM dGTP 2 mM dTTP |
|
| 10× PCR buffer | 100 mM Tris-HCl pH 8.0 500 mM KCl 1% Triton-X-100 20 mM MgCl2 10 mM 2-mercaptoethanol |
3.2 Antibodies, enzymes and oligonucleotides
3.2.1. Antibodies
| Antibody | Supplier |
|---|---|
| ANTI-FLAG M2, mouse monoclonal (1 mg/ml) | Sigma, F1804 |
3.2.2. Enzymes and other material
| Product | Supplier | Concentrations |
|---|---|---|
| ANTI-FLAG® M2 Magnetic Beads Dynabeads Protein G |
Sigma, M8823 | |
| ThermoFischer, 100.03D/04D |
||
| 2 ml siliconized tubes | BioPlas 4168SL | |
| 1.5 ml siliconized tubes | BioPlas 4165SL | |
| 5 µm membrane syringe filter | Pall Acrodisc | |
| RNase T1 | ThermoFisher, EN0541 | 1,000 U/µl |
| RNase A | ThermoFisher, EN0531 | 10 mg/ml |
| RNase I | ThermoFisher, EN0601 | 10 U/µl |
| Calf intestinal phosphatase (CIP) | New England Biolabs (NEB), M0290 |
|
| T4 Polynucleotide Kinase (T4 PNK) |
NEB, M0201 | |
| -32P-ATP | Perkin Elmer, NEG002Z001MC |
10 mCi/ml, concentration 1.6 µM |
| Protein size marker, Precision Plus Protein Standard |
BioRad, 161–0374 | |
| D-Tube Dialyzer Midi, cutoff 3.5 kDa |
Novagen, 71506-3 | |
| Nitrocellulose membrane 0.45 µm | Amersham, 10600093 | |
| Proteinase K | Roche, 03 115 879 001 | |
| Glycoblue or glycogen | Ambion or Roche | 10 mg/ml |
| Truncated and mutated RNA ligase 2, T4 Rnl2(1–249) K227Q |
NEB M0351 or plasmid for recombinant expression can also be obtained at addgene.org |
1 mg/ml |
| T4 RNA ligase, T4 Rnl1 | ThermoFischer | 1 mg/ml |
| SuperScript III Reverse | ThermoFischer, 18080- | |
| Transcriptase | 044 | |
| Taq DNA polymerase | Various suppliers | 5 U/µl |
| Qiaquick gel purification kit | Qiagen |
3.2.3. Oligonucleotide sequences
| Oligonucleotide | Sequence |
|---|---|
| RNA size markers: | |
| 19 nt 35-nt |
5’ CGUACGCGGGUUUAAACGA 3’ 5’ CUCAUCUUGGUCGUACGCGGAAUAGUUUAAAC UGU 3’ |
| Adapters: | |
| Pre-adenylated 3’ adapter (DNA) |
5’ AppTCGTATGCCGTCTTCTGCTTGT 3’ |
| 5’ adapter (RNA) | 5’ GUUCAGAGUUCUACAGUCCGACGAUC 3’ |
| Primers: | |
| 3’ primer | 5’ CAAGCAGAAGACGGCATACGA 3’ |
| 5’ primer | 5’ AATGATACGGCGACCACCGACAGGTTCAGAGTTCTA CAGTCCGA 3’ |
3.3. Procedure
3.3.1. Expanding cells
Expand cells in appropriate growth medium in 150-mm tissue culture dishes. We recommend using a number of cells that will result in 1.5–3 ml of wet pellet (for HEK293 cells approximately 100–200 × 106 cells or 10–20 150-mm tissue culture dishes). Grow cells to approximately 80% confluency.
For tagged proteins expressed inducibly only: 24 h before crosslinking induce expression of the FLAG/HA tagged RBP by addition of 1 µg/ml of doxycycline.
16 h before crosslinking add 4SU to a final concentration of 100 µM (1:10,000 v/v of a 1 M 4SU stock solution) directly to the cell culture medium.
3.3.2. UV365-Crosslinking
For adherent cells:
Wash cells once with 5 ml ice-cold PBS per dish and remove PBS completely.
Place dishes on a tray with ice and irradiate uncovered with a dose of 0.15 J/cm2 of 365 nm UV light in a Spectrolinker XL-1500 (Spectronics Corporation) equipped with 365 nm light bulbs or similar device.
Scrape cells off with a rubber policeman (cell scraper) in 1 ml PBS per dish, transfer to 50 ml centrifugation tubes and collect by centrifugation at 500×g at 4 °C for 15 min and discard the supernatant.
Wash cells once with 5 ml ice-cold PBS per 1 ml of wet cell pellet and collect by centrifugation at 500×g at 4 °C for 15 min. Discard the supernatant.
Unless continuing directly with cell lysis, snap freeze the cell pellet in liquid nitrogen and store at −80 °C. Cell pellets can be stored for at least 12 months.
For cells grown in suspension:
Collect cells by centrifugation at 500×g at 4 °C for 15 min.
Wash cells once with 20 ml ice-cold PBS and collect again by centrifugation at 4 °C for 15 min.
Resuspend cells in 2 ml ice-cold PBS and transfer onto one 150-mm tissue culture dish.
Place dish on a tray with ice and irradiate uncovered with a dose of 0.2 J/cm2 of 365 nm UV light in a Spectrolinker XL-1500 (Spectronics Corporation) equipped with 365 nm light bulbs or similar device.
Transfer cells into a 50 ml centrifugation tube and collect by centrifugation at 500×g for 15 min at 4 °C and discard the supernatant.
Unless you want to continue directly with cell lysis, snap-freeze the cell pellet in liquid nitrogen and store at −80 °C. Cell pellets can be stored for at least 12 months.
3.3.3. Cell lysis and RNase digestion
The RNase treatment needs to be optimized for each PAR-CLIP experiment. Different RBPs might respond differently to certain RNase digestion conditions.
Resuspend cell pellet of crosslinked cells in 3 volumes of 1× NP40 lysis buffer and incubate on ice for 30 min.
Clear cell lysate by centrifugation at 13,000×g at 4 °C for 30 min. In the meantime, prepare the magnetic beads (see below).
Add the corresponding RNase to a final concentration of 1 U/µl and incubate at room temperature for 15 min. Cool reaction subsequently for 5 min on ice before proceeding.
3.3.4. Immunoprecipitation and recovery of crosslinked RNA
In our experience, the IP efficiencies strongly depend on the antibody and magnetic beads that are used for IP.
Preparation of Dynabeads Protein G (if necessary)
Transfer 10 µl of Protein G magnetic particles per ml cell lysate (for a typical experiment it should be approx. 60–100 µl of beads) to a 2 ml microtube. Wash beads twice with 1 ml of PBS-T buffer. (NOTE: For experiments with less than 2.5 ml of cell lysate do not use less than 25 µl of magnetic beads as there will be minor loss of magnetic beads due to handling while performing the protocol).
Wash beads three times in 1 ml of PBS-T buffer.
Resuspend the beads in twice the volume of PBS-T buffer relative to the original volume of bead suspension.
Add 0.25 mg of anti-FLAG M2 antibody (1 mg/ml) per ml bead suspension and incubate on a rotating wheel for 60 min at room temperature.
Wash beads twice in 1 ml of PBS-T buffer to remove unbound antibody.
Resuspend beads in 1 volume of PBS-T buffer.
(Optional: Use of conjugated ANTI-FLAG M2 Magnetic Beads)
If pre-conjugated ANTI-FLAG M2 Magnetic Beads will be used, transfer 10 µl of ANTI-FLAG M2 Magnetic Beads per ml cell lysate (for a typical experiment it should be approx. 60–100 µl of beads) to a 2 ml microtube.
Wash beads three times in 1 ml of PBS buffer.
Resuspend beads in 1 volume of PBS buffer.
3.3.5. Immunoprecipitation (IP) and dephosphorylation
Add 10 µl of freshly prepared antibody-conjugated magnetic beads per ml of partial RNase treated cell lysate and incubate in 15 ml centrifugation tubes on a rotating wheel for 2 h at 4 °C.
Collect magnetic beads on a magnetic particle collector for 15 and 50 ml centrifugation tubes and discard supernatant.
Add 1 ml of IP wash buffer and transfer to 2 ml microtubes (NOTE: make sure that you do not exceed the maximal salt concentration at which the antibody recognizes its antigen. It is necessary to determine the maximal tolerated salt concentration before starting the PAR-CLIP, performing an IP and washing with different salt concentrations before the PAR-CLIP experiment.)
Wash beads 3 times in 1 ml of IP wash buffer.
Resuspend beads in one bead volume of IP wash buffer.
Perform second RNase digest. This step is optional and must be carefully optimized. Add RNase to a final concentration of 1–100 U/µl to the bead suspension and incubate for 15 min at •22 °C.
Wash beads 3 times in 1 ml of high salt wash buffer. (NOTE: make sure that you do not exceed the maximal salt concentration at which the antibody recognizes its antigen. It is necessary to determine the maximal tolerated salt concentration before starting the PAR-CLIP by performing an IP and washing with different salt concentrations.)
Resuspend beads in 1 volume of dephosphorylation buffer (1× NEB3 buffer).
Add calf intestinal alkaline phosphatase (10 U/µl) to a final concentration of 0.5 U/µl, and incubate the suspension for 15 min at 37 °C.
Wash beads twice in 1 ml of phosphatase wash buffer.
Wash beads twice in 1 ml polynucleotide kinase (PNK) buffer without DTT (since DTT can damage the magnetic beads, only add DTT to the bead suspension when the enzyme is present).
Resuspend beads in one original bead volume of PNK buffer (with DTT, 1× PNK buffer).
3.3.6. Radiolabeling of immunoprecipitated RNA
To the bead suspension described above, add -32P-ATP (0.01 mCi/µl) to a final concentration of 0.5 µCi/µl (1.6 µM ATP) and T4 PNK (10 U/µl) to 1 U/µl in one original bead volume. Incubate the suspension for 30 min at 37 °C.
Add non-radioactive ATP to obtain a final concentration of 100 µM and incubate for another 15 min at 37 °C.
Wash the magnetic beads 5 times with 1 ml of PNK buffer without DTT.
Transfer beads to a fresh microtube.
Resuspend the beads in 70 µl of 1× SDS-PAGE loading buffer.
Incubate the radiolabeled suspension for 5 min in a heat block at 95 °C to denature and release the immunoprecipitated proteins with crosslinked RNA and vortex.
Remove the magnetic beads on the separator and transfer the supernatant to a clean 1.5 ml microtube.
3.3.7. SDS-PAGE and electroelution of crosslinked RNA-protein complexes from gel slices
Load 40 µl of the supernatant per well of a precast Novex Bis-Tris 4–12% polyacrylamide gel and run the gel for 55 min at 200 V. Keep 5 µl of supernatant for a Western blot to confirm that the IP was efficient.
Disassemble the gel chamber and dismantle the gel, leaving it mounted on one plate. To facilitate the alignment of the gel to the phosphorimager paper printout, we recommend implanting three tiny radioactive gel pieces asymmetrically at three of the four corners of the gel. Radioactive gel pieces can be collected from gels that were previously used to purify radiolabeled synthetic oligonucleotides. Wrap the gel in plastic film (e.g. Saran wrap) to avoid contamination.
Expose the gel to a blanked phosphorimager screen for 1 h and visualize on a phosphorimager.
Align the gel on top of the phosphorimager printout using the implanted gel pieces for orientation. Cut out the bands that correspond to the expected size of RBP.
Add 600 µl of H2O to a D-Tube Dialyzer Midi Tube and let it stand at room temperature for 5 min. Discard the water.
Transfer the excised band to the dialyzer tube and add 600 µl 1× SDS running buffer.
Electroelute the crosslinked RNA-RBP complex in 1× SDS running buffer at 100 V for 2 h.
Transfer the supernatant to a fresh 1.5 ml microtube and electroelute again for extra 2 h.
Transfer the supernatant to a clean 1.5 ml.
3.3.8. Proteinase K digestion
Add 200 µl of 4× Proteinase K Buffer with respect to each of the electroeluate microtube, followed by the addition of Proteinase K to a final concentration of 1.0 mg/ml. Incubate for 30 min at 50 °C.
Recover the RNA by acidic phenol/chloroform/IAA extraction (25:24:1, pH 4.0) followed by a chloroform extraction. Add NaCl to a final concentration of 0.3 M and 1 µl of glycogen (10 mg/ml stock). Precipitate the RNA by adding 3 volumes of ethanol.
Allow the RNA to precipitate by incubation in the freezer for at least 30 min and collect the pellet by centrifugation in a tabletop centrifuge at 4 °C at maximum speed (approx. 14,000×g) for 20 min.
Discard the supernatant. Wash the microtube wall and pellet with 1 ml 75% ethanol and centrifuge at 4 °C at maximum speed (approx. 14,000×g) for 10 min.
Discard the supernatant. Collect residual ethanol by centrifugation at 14,000×g for 1 min and discard the supernatant. Air-dry the RNA pellet for 5 min.
Dissolve the pellet in 10 µl water.
Optional: SDS-PAGE and blotting the RNA-RBP complexes on a nitrocellulose membrane followed by recovery of the crosslinked RNA-protein complexes from the membrane
Load 40 µl of the supernatant per well of a precast Novex Bis-Tris 4–12% polyacrylamide gel and run the gel for 55 min at 200 V. Keep 5 µl of supernatant for a western blotting to confirm that the preceding IP was efficient.
Disassemble the gel chamber and transfer the resolved RNA-RBP complexes to a nitrocellulose membrane with a 0.45 µm pore size. Transfer for 1 h at 250 mA in 1× Transfer buffer.
Implant three tiny radioactive gel pieces asymmetrically at three of the four corners of the membrane.
Expose the gel to a blanked phosphorimager screen for 1 h and visualize on a phosphorimager.
Align the membrane on top of the phosphorimager printout using the implanted gel pieces for orientation. Cut out the bands that correspond to the expected size of RBP.
Add 800 µl of 1× Proteinase K buffer with respect to each of the excised bands, followed by the addition of Proteinase K to a final concentration of 1.0 mg/ml. Incubate for 30 min at 50 °C.
Recover the RNA by acidic phenol/chloroform/IAA extraction (25:24:1, pH 4.0) followed by a chloroform extraction. Add NaCl to a final concentration of 0.3 M and 1 µl of glycogen (10 mg/ml stock) precipitate the RNA by adding 3 volumes of ethanol.
Allow the RNA to precipitate by incubation in the freezer for at least 30 min and collect the pellet by centrifugation in a tabletop centrifuge at 4 °C at maximum speed (approx. 14,000×g) for 15 min.
Discard the supernatant. Wash the microtube wall and pellet with 1 ml 75% ethanol and centrifuge at 4 °C at maximum speed (approx. 14,000×g) for 10 min.
Discard the supernatant. Collect residual ethanol by centrifugation at 14,000×g for 1 min and discard the supernatant. Air-dry the RNA pellet for 5 min.
Dissolve the pellet in 10 µl water.
3.3.9. Preparation of radioactive size markers
Radiolabel the size markers (19 nt and 35 nt) individually in a 10 µl reaction by combining 1 µl of 10 µM oligoribonucleotide, 1 µl of 10× PNK buffer, 1 µl of -32P-ATP (0,01 mCi/µl) and 6 µl of water in a siliconized microtube.
Incubate sample at 90 °C for 1 min.
Incubate sample on ice for 2 min.
Add 1 µl of T4 PNK enzyme (10 U/µl).
Incubate sample for 30 min at 37 °C.
Quench the reaction by addition of 10 µl of denaturing PAA gel loading solution.
Incubate sample at 90 °C for 1 min.
Load 20 µl of each sample in a single well on a 15% denaturing acrylamide gel (15 cm wide, 17 cm long, 0.5 mm tick, 30 ml gel volume). Run the gel approx. 45 min at 30 W using 0.5× TBE buffer until the Bromophenol blue band is close to the bottom of the gel.
Dismantle the gel, leaving it mounted on one glass plate. Implant three tiny radioactive gel pieces asymmetrically at three of the four corners of the gel, to facilitate the alignment of the gel to the phosphorimager paper printout. Wrap the gel in plastic film (e.g. Saran wrap) to avoid contamination. Expose the gel for 1 min and image the gel on a phosphoimager.
Align the gel on glass plate over the printed phosphoimage. Cut out the radioactive bands corresponding to the size marker and transfer the gel slices into pre-weighed 1.5 ml siliconized microtubes (one for each marker).
Add 400 µl of 0.3 M NaCl to each microtube and elute the RNA from the gel by incubating the microtube for at least 1 h at 37 °C under constant agitation (on the thermomixer shaking at 1,000 rpm).
Collect the supernatant and add 1200 µl of absolute ethanol (volume of ethanol is calculated based on the volume of 0.3 M NaCl used in step 11). Keep sample at −20 °C for at least 30 min.
Collect the RNA by centrifugation in tabletop centrifuge at 4 °C at maximum speed (approx. 14,000×g) for 15 min.
Discard the supernatant. Collect residual ethanol by centrifugation at 14,000×g for 10 s. Air-dry the RNA pellet for 5 min.
Dissolve each pellet in 10 µl of water.
Add 1 µl of each size marker to 100 µl water.
3.3.10. Purification of RNA fragments of appropriate length
Use siliconized microtubes while working with trace amounts of small RNAs to prevent the absorption of nucleic acids to the tube.
Add 10 µl of denaturing PAA gel loading solution to the RNA recovered in the previous step as well as to the microtube containing the combined size marker.
Denature sample for 1 min at 90 °C.
Load the sample in a well on a 15% denaturing acrylamide gel with 7.5 M urea. Make sure to space different samples appropriately, typically at a two-well distance, to avoid cross-contamination. Load size markers on opposite ends of the gel, framing the PAR-CLIP samples, keeping a two-well distance from them to avoid cross-contamination. For a standard PAR-CLIP experiment we use a mixture of the 19 nt and the 35 nt size marker). The size markers define the size range of the RNA fragments that need to be recovered from the gel.
Run the gel for 35 min at 30 W using 1× TBE buffer.
Dismantle the gel, leaving it mounted on one glass plate. Implant three tiny radioactive gel pieces asymmetrically at three of the four corners of the gel, to facilitate the alignment of the gel to the phosphorimager paper printout. Wrap the gel in plastic film (e.g. Saran wrap) to avoid contamination.
Expose the gel for at least 1 h to a phosphorimager screen. If the radioactivity of the recovered RNA is weak, you can expose the gel overnight, placing the cassette in a −20 °C freezer.
Align the gel on top of a printout scaled to 100% according to the position of the three radioactive gel pieces. Excise the RNA between 19 nt and 35 nt. The size markers do not need to be excised.
Elute the ligation product from the gel slices for 1 h at 37 °C with constant agitation with at least 400 µl of 0.3 M NaCl. Repeat the elution step.
Take off the supernatant, add 1 µl of glycogen solution and precipitate the small RNAs by adding 3 volumes of ethanol to the collected supernatant.
Precipitate the ligation products by incubation in a −20 °C freezer for 30 min and collect the pellet by centrifugation in a tabletop centrifuge at 4 °C at maximum speed (approx. 14,000×g) for 15 min.
Discard the supernatant. Wash with 75% ethanol and centrifuge at 4 °C at maximum speed (approx. 14,000×g) for 10 min.
Discard the supernatant. Collect residual ethanol by centrifugation at 14,000×g for 1 min and discard the supernatant. Air-dry the RNA pellet for 5 min.
Dissolve the pellet in 10 µl water.
3.3.11. cDNA library preparation and deep sequencing
3’ Adapter ligation
Prepare the following reaction mixture for ligation of the 3’ adenylated adapter, multiplying the volumes by the number of ligation reactions to be performed plus one extra volume to account for pipetting error: 2 µl of 10× RNA ligase buffer without ATP), 6 µl 50% DMSO and 1 µl of 100 µM adenylated 3’adapter. The number of ligation reactions is the number of samples plus two for the combined size markers (see 3.3.9), which control for successful ligation and indicate the size range of the ligated RNA fragments that need to be recovered from the gel. Use 10 µl of combined size markers for each reaction.
Denature the RNA by incubating the microtubes for 1 min at 90 °C. Place the microtube immediately on ice for 2 min.
Add 1 µl of Rnl2 (1–249) K227Q ligase (1 µg/µl), mix gently and incubate overnight on ice in the cold room.
Add 20 µl of denaturing PAA gel loading solution.
Denature sample for 1 min at 90 °C.
Load samples in two wells on a 15% denaturing acrylamide gel. Space samples appropriately, typically at a two-well distance, to avoid cross-contamination. Load unligated markers and the marker ligation reactions on each end of the gel, framing the PAR-CLIP samples, keeping a two-well distance between each sample to avoid cross-contamination.
Run the gel for 45 min at 30 W using 1× TBE buffer until the Bromophenol blue band is close to the bottom of the gel.
Dismantle the gel, leaving it mounted on one glass plate. Implant three tiny radioactive gel pieces asymmetrically at three of the four corners of the gel, to facilitate the alignment of the gel to the phosphorimager paper printout. Wrap the gel in plastic film (e.g. Saran wrap) to avoid contamination.
Expose the gel for at least 1 h to a phosphorimager screen. If the radioactivity of the recovered RNA is weak, you can expose the gel overnight, placing the cassette in a −20 °C freezer.
Align the gel on top of a printout scaled to 100% according to the position of the three radioactive gel pieces. Cut out the RNA fragments ligated to the 3’ adapter using the ligated size markers as size range. Cut out the ligated size markers as well and proceed together with the other samples.
Elute the ligation product from the gel slices for 1 h at 37 °C with constant agitation with at least 400 µl of 0.3 M NaCl. Repeat the elution step.
Take off the supernatant, add 1 µl of glycogen solution and precipitate the small RNAs by adding 3 volumes of ethanol to the collected supernatant.
Allow the ligation products to precipitate by incubation in the freezer for 30 min and collect the pellet by centrifugation in a tabletop centrifuge at 4 °C at maximum speed (approx. 14,000×g) for 15 min.
Discard the supernatant. Wash with microtube walls and pellet with 1 ml 75% ethanol and centrifuge at 4 °C at maximum speed (approx. 14,000×g) for 10 min.
Discard the supernatant. Collect residual ethanol by centrifugation at 14,000×g for 1 min and discard the supernatant. Air-dry the RNA pellet for 5 min.
Dissolve the pellet in 9 µl water.
5’ Adapter ligation
Prepare the following reaction mixture by combining 1 µl of 100 µM 5' adapter oligoribonucleotide, 2 µl of 10× RNA ligase buffer with ATP and 6 µl 50% aqueous DMSO. Add the 9 µl of this mixture to the sample. Prepare a ligation for only one of the ligated markers. Keep the other one to control the success of the ligation.
Denature the RNA by incubation for 1 min at 90 °C. Place the microtube immediately on ice for 2 min.
Add 2 µl of Rnl1, mix gently, and incubate for 1 h at 37 °C. Repeat this step twice.
Add 20 µl of denaturing PAA gel loading solution and incubate the samples for 2 min at 95 °C. Load the samples in two adjacent wells of a 20-well 12% acrylamide gel. Make sure to space different samples appropriately, typically at a two-well distance, to avoid cross-contamination. As controls, load the unligated, 3’ adapter ligated and 3’ and 5’ adapter ligated size markers on the ends of the gel, framing the PAR-CLIP samples.
Run the gel for 45 min at 30 W using 1× TBE buffer until the Bromophenol blue band is close to the bottom of the gel. Image the gel as described above and excise the new ligation product.
Elute the ligation product from the gel slices with 400 µl of 0.3 M NaCl by constant shaking 1 h at 37 °C. Repeat the elution step.
Take off the supernatant, add 1 µl of glycogen solution and precipitate the small RNAs by adding 3 volumes of ethanol to the collected supernatant.
Allow the ligation products to precipitate by incubation in the freezer for 30 min and collect the pellet by centrifugation in a tabletop centrifuge at 4 °C at maximum speed (approx. 14,000×g) for 15 min.
Discard the supernatant. Wash with microtube walls and pellet with 1 ml 75% ethanol and centrifuge at 4 °C at maximum speed (approx. 14,000×g) for 10 min.
Discard the supernatant. Collect residual ethanol by centrifugation at 14,000×g for 1 min and discard the supernatant. Air-dry the RNA pellet for 5 min.
Dissolve the pellet in 4.6 µl water.
Reverse Transcription
Prepare the following reaction mix: 1 µl of 100 µM 3' primer, 1.5 µl 0.1 M DTT, 3 µl 5× first-strand synthesis buffer, 4.2 µl 10× dNTPs.
Denature the RNA by incubating the microtube for 30 s at 90 °C and transfer the microtube to a 50 °C incubator.
Add 8.7 µl of the prepared reaction mix to each sample and incubate for 3 min at 50 °C. Add 0.75 µl of Superscript III reverse transcriptase and incubate for 2 h at 50 °C.
Prepare 150 mM KOH/20 mM Tris base and 150 mM HCl and use pH paper to verify that a 1:1 mixture results in a pH between 7.0 and 9.5. If not, change the ratios until the •pH is within that range. •
To hydrolyze the RNA, add 40 µl of 150 mM KOH/20 mM Tris base and incubate at •90 °C for 10 min. •
Neutralize the solution by adding 40 µl of 150 mM HCl (the exact volume depends on •the ratio determined in step 4) and check the pH of the mixture by spotting 1 µl on pH paper. The pH should be between 7.0 and 9.5 to ensure that the subsequent PCR is not inhibited. If necessary, readjust the pH by adding more base or acid.
PCR amplification
Prepare the following mix multiplied with number of samples: 40 µl of the 10× PCR buffer, 40 µl 10× dNTPs, 2 µL of 100 µM 5’ primer, 2 µl of 100 µM 3’ primer, 272 µl H2O. Perform a standard 100 µl PCR with Taq polymerase (5 U/µl). 89 µl of the reaction mix will be used in a pilot PCR reaction and rest of the mixture will be used for the large scale PCR.
To 89 µl of the reaction mix add 10 µl from the cDNA solution and 1 µl of the Taq polymerase. Use the following cycle conditions: 45 s at 94 °C, 85 s at 50 °C, 60 s at 72 °C.
To determine the necessary number of cycles for amplifying of the cDNA library, remove 10 µl aliquots every third cycle starting with cycle number 12 up to cycle number 30. To remove aliquots from the PCR tube, temporarily pause the PCR cycler at the end of the 72 °C step.
Analyze the samples on a 2.5% agarose gel. The PCR-product might appear as a double band with the higher band running at the expected length of about 95–110 nt and a lower band at 65 nt corresponding to the direct ligation/template switch products of the 3' adapter and 5' adapter. Define the optimal cycle number for cDNA amplification, which should be within the exponential amplification phase of the PCR, approx. 3 cycles away from reaching the saturation level of PCR amplification.
Perform a 300 µl PCR with the optimal cycle number and analyze the product again on a 2.5% agarose gel.
Concentrate the DNA by ethanol precipitation and resuspend the pellet in 60 µl of 1× DNA loading dye.
Run the sample on two wells of a 2.5% agarose gel stained with 0.4 µg/ml ethidium bromide to remove any amplified products resulting form insertless 5’ adapter-3’ adapter products. Do not overload the gel to not compromise the separating capacity of the agarose gel.
Visualize the DNA on a UV transilluminator and excise the band corresponding to 85–110 nt with a clean scalpel.
Purify the DNA using the gel extraction kit according to the instructions of the manufacturer. Use 30 µl elution buffer to recover the cDNA.
Check the nucleic acid quality and quantity at an Agilent 2200 TapeStation with a High Sensitivity D1000 ScreenTape system. The size range of the sample should be around 95–110 nt in length.
Submit the amplified and purified cDNA for Illumina sequencing. The minimum amount is 10 µl of a 2 nM cDNA solution. We recommend using 50 bp sequencing on a HiSeq 2500machine. Our adapters are compatible with the Illumina small RNA sequencing kit.
4. Computational analysis
Computational analyses of PAR-CLIP RNAseq datasets should reveal the category or categories of target RNAs, the members within each category, and specific binding sites within targets. We developed an analysis pipeline based on a curated and annotated reference RNA collection, which we organized into categories, such as rRNA, tRNA, snoRNA, mRNAs, etc. This pipeline is available at https://rnaworld.rockefeller.edu/PARCLIP_suite/. The pipeline maps the sequence reads and calculates the T-to-C conversion frequency for each annotated category of RNA and read length. This approach allows us to assess the quality of each PAR-CLIP cDNA library, to identify the RNA categories that the protein of interest predominantly interacts with, and to select an appropriate range of read lengths for further analyses. In all CLIP experiments, fragments derived from non-crosslinked, abundant cellular RNAs (rRNA and tRNAs), are co-purified and sequenced. It is not uncommon to observe in experiments with low capture of crosslinked RNA that the majority of sequence reads of a library are non-crosslinked reads of such categories. Important features of PAR-CLIP are T-to-C substitutions when 4SU is used as the photo-activatable ribonucleoside. By scoring the T-to-C conversion frequency we can distinguish crosslinked RNAs from background RNAs. Our pipeline assesses the contribution of all RNA categories to the target spectrum of an RBP of interest and it allows researchers to account for the degree of background RNAs isolated with the experiment.
After the identification of the predominant category of targeted RNA(s), a higher resolution approach may be conducted to identify specific binding sites. We recommend the usage of the kernel density algorithm PARalyzer, which investigates the local density of T-to-C transitions in PAR-CLIP reads on RNA transcripts and calculates based on these the enrichment of binding sites [35]. Target RNA binding sites returned by PARalyzer have been used to perform motif enrichment analysis thereby revealing the RRE essential for binding [36]. Apart from PARalyzer, a variety of other computational pipelines can be used, such as CLIPZ [37], starBase [38], WavclusteR [39], doRina [40], Piranha [41], miRTarCLIP [42], PIPE-CLIP [43], and dCLIP [44]. After RRE have been identified computationally, biochemical studies may be conducted with recombinant RBP and synthetic wild-type and mutant RNAs to confirm their validity [45,46].
Here, we describe the computational analysis of a PAR-CLIP sequence read library starting with the raw Illumina sequencing output file in fastq format until the identification of potential binding sites as illustrated in Figure 4A. The size of a fastq file depends on the RNA isolation method, multiplexing, cDNA concentration, and the platform used for sequencing. We recommend PAR-CLIP library sizes of 40 to 200 million sequence reads.
Fastq to fasta. Convert the Illumina sequencing output file from fastq into fasta format using a customized Perl script. At this step the quality scores from the fastq file are omitted. Converting the data file to fasta format allows for faster trimming of the adapter sequences (and demultiplexing, if necessary, see steps 2 and 3).
-
Adapter trimming. Sequencing is performed unidirectionally. An oligonucleotide with the sequence of the 5’ adapter immobilized on the flow cell of the sequencer serves as binding site for complimentary strand of the PAR-CLIP cDNA library. Therefore, sequencing starts directly after the constant 5’ adapter region, with the first nucleotide of the sequencing read matching to the original RNA (Fig. 4A). Since the majority of PAR-CLIP sequence reads shows an insert size distribution of about 19–35 nucleotides, we commonly use 50 nt as read length. Consequently, most of the sequence reads continue into the 3’ adapter used for cDNA library preparation (Fig. 4A). These 3’ adapter sequences need to be removed prior to sequence read alignment. Multiple programs can be used for trimming adapter sequences, such as cutadapt [http://cutadapt.readthedocs.io/en/stable/], the fastx package [http://hannonlab.cshl.edu/fastx_toolkit/], Trimmomatic [http://www.usadellab.org/cms/?page=trimmomatic], or many other ad hoc scripts.
If barcodes were introduced in PAR-CLIP libraries to multiplex samples for sequencing, sorting of reads into subsamples and removal of barcoded 3’ adapter sequences is also carried out at this step. Different bioinformatics tools have been developed for this purpose, such as cutadapt [http://cutadapt.readthedocs.io/en/stable/], trimLRPatterns [https://bioconductor.org/packages/release/bioc/html/Biostrings.html], novoalign [http://www.novocraft.com/documentation/novoalign-2/], or Adapter Remover [http://srna-workbench.cmp.uea.ac.uk/tools/helper-tools/adapter-removal/] [24,47]. To avoid barcode mis-assignment due to sequencing errors, we do not allow any mismatch, insertion, or deletion within the barcode, nor any mismatch in the first common position of the 3’ adapter next to the barcode.
Note: The 3’ adapter trimming requires the recognition of at least 3 nt of the 3’ adapter. Read containing less than 3 nt of the 3’ adapter sequence will not be recognized and remain untrimmed. Although these reads enter the read mapping process, only those with 2 mismatches or less to the reference will be annotated.
Generate a collapsed fasta file (Fig. 4A). Generate a list of non-redundant (unique) sequence reads. The resulting fasta file contains a unique identifier in the header of the read along with the read count. Collapsed fasta files containing only non-redundant reads allow faster mapping and more efficient computation, especially in regard to the millions of sequence reads generated in each sequencing run.
Removal of reads containing “N”. Reads containing ambiguous DNA symbols other than A, T, G or C, such as "N", must be discarded since these reads may interfere with optimal alignments. Additionally, these ambiguous base calls will impede downstream analyses, especially when T-to-C enrichments are calculated.
-
Length-filter reads of the collapsed fasta file. Reads shorter than 5 nt need to be removed from the collapsed fasta file because the Bowtie aligner during sequence read annotation (see next step) is not prepared to handle those. During adapter trimming, many short reads or even empty (insert length 0) reads are generated and originate from ligation/template switch among 5’ and 3’ adapters used during cDNA library preparation from crosslinked RNA.
We usually set the cutoff value to 20 nt when processing reads from organisms with large transcriptomes, such as human, because shorter reads multi-map increasingly frequent and the unique identification of the crosslinked/mismatched nucleotide position is compromised. For organisms with smaller transcriptomes the likelihood for multimapping is less and shorter length cut-offs might be considered.
Annotation of sequence reads. We generated an annotation pipeline including a variety of Perl scripts and the Bowtie [48] aligner to hierarchically map reads against a curated and annotated RNA reference transcriptome including sequence sets for common byproducts and artifacts of small RNA cDNA library preparation. We allow reads to map to the reference with error distance 0 (d0), error distance 1 (d1), or error distance 2 (d2), including insertions, or deletions. For each d1 mismatched read we also record the sequence change and report the T-to-C versus all other sequence changes. The pipeline is readily modified to report other nucleotide changes if alternative photoreactive nucleosides, e.g. 6SG, were used. The annotation of sequence reads by RNA categories is carried out in a hierarchical manner where conflicting cases (when a read can be assigned to two or more categories) are resolved by hierarchical assignment, typical in order of cellular abundance (Fig. 4B). The hierarchical order can be re-adjusted by the user. Sequence reads mapped to common by-products of small RNA cDNA library preparation such as size markers, adapter concatamers, and bacterial RNA contaminants residing in recombinant RNA ligase preparations, are assigned the highest priority. Thereafter, mapped reads are typically assigned to RNA categories according to their cellular abundance (rRNA, tRNA, etc.). For any RNA category subdivided in mature and precursor transcripts, the mature sequence receives higher priority (Fig. 4B). The lowest level of annotation reports matches to genome. The annotation pipeline contains additional scripts to retrieve reads by length, by annotation category, or by type of mismatches to the reference database for further analysis.
Fig. 4.

Bioinformatic pipeline A) Workflow of PAR-CLIP sequencing data analysis and assignment of the target RNA categories. B) List of RNA categories represented in our reference transcriptome in their default hierarchical order used after the mapping process. Mature RNA categories are labeled by the RNA category name and their respective precursors are referred to by adding the prefix prec.
Below, we present the tabular output of the analysis of a PAR-CLIP experiment for the nuclear localized RBP FUS (accession SRR070448) [45]. Table 2 shows the total number of reads resolved by length and separated into annotated and non-annotated reads, where the annotated reads are further split up into d0, d1, and d2 reads. Table 3 organizes the annotated reads (sum of d0, d1 and d2) by RNA category, and points the user to which category needs to be examined for crosslinking evidence. In the case of FUS, “mRNA precursor” was the most abundant category. Table 4 breaks down the read composition of this category by length and error distance d0, d1 T-to-C, d1 other than T-to-C, or d2.
Table 2.
Mapping statistics for 3’ adapter extracted sequence reads of a 36-nt read length FUS PAR-CLIP dataset. The number of extracted reads mapping perfectly (d0), with one mismatch (d1), or 2 mismatches (d2) to the human transcriptome were resolved by length within a user-specified min-max (5–36) nt window. The adapter extraction program minimally requires detection of the 3-nt 5’ terminus of the 3’ adapter or otherwise leaves the original read untrimmed.
| read length |
total reads | non- annotated |
annotated | d0 | d1 | d2 |
|---|---|---|---|---|---|---|
| 5 | 20637 | 0 | 20637 | 20637 | 0 | 0 |
| 6 | 4039 | 0 | 4039 | 4039 | 0 | 0 |
| 7 | 6167 | 0 | 6167 | 6167 | 0 | 0 |
| 8 | 10250 | 0 | 10250 | 10250 | 0 | 0 |
| 9 | 17148 | 0 | 17148 | 17148 | 0 | 0 |
| 10 | 29001 | 0 | 29001 | 29001 | 0 | 0 |
| 11 | 57522 | 0 | 57522 | 57522 | 0 | 0 |
| 12 | 103147 | 0 | 103147 | 103134 | 13 | 0 |
| 13 | 146996 | 0 | 146996 | 146733 | 263 | 0 |
| 14 | 195787 | 0 | 195787 | 194037 | 1750 | 0 |
| 15 | 268026 | 0 | 268026 | 255681 | 12309 | 36 |
| 16 | 380167 | 0 | 380167 | 323456 | 55990 | 721 |
| 17 | 472550 | 15 | 472535 | 300073 | 167640 | 4822 |
| 18 | 522408 | 80 | 522328 | 200253 | 303631 | 18444 |
| 19 | 668821 | 1839 | 666982 | 216394 | 387830 | 62758 |
| 20 | 646062 | 19071 | 626991 | 136695 | 343363 | 146933 |
| 21 | 663339 | 58756 | 604583 | 133802 | 272680 | 198101 |
| 22 | 652187 | 104333 | 547854 | 155816 | 211699 | 180339 |
| 23 | 556700 | 137330 | 419370 | 116042 | 165852 | 137476 |
| 24 | 502753 | 154737 | 348016 | 105624 | 135374 | 107018 |
| 25 | 463772 | 143824 | 319948 | 121434 | 118554 | 79960 |
| 26 | 399600 | 140227 | 259373 | 96965 | 96583 | 65825 |
| 27 | 361817 | 121308 | 240509 | 103375 | 84314 | 52820 |
| 28 | 343641 | 116610 | 227031 | 108026 | 74272 | 44733 |
| 29 | 283648 | 109569 | 174079 | 79110 | 58512 | 36457 |
| 30 | 218082 | 93205 | 124877 | 47194 | 45461 | 32222 |
| 31 | 255043 | 88759 | 166284 | 86963 | 50044 | 29277 |
| 32 | 209653 | 87792 | 121861 | 59408 | 38015 | 24438 |
| 33 | 295230 | 120475 | 174755 | 98936 | 47057 | 28762 |
| 34 | 0 | 0 | 0 | 0 | 0 | 0 |
| 35 | 0 | 0 | 0 | 0 | 0 | 0 |
| 36 | 779773 | 487232 | 292541 | 120788 | 75817 | 95936 |
| sum: | 9533966 | 1985162 | 7548804 | 3454703 | 2747023 | 1347078 |
| % annotated | 20.82% | 79.18% | 45.76% | 36.39% | 17.84% | |
Table 3.
Sequence read report resolved by RNA category for FUS PAR-CLIP shown in Table 2. Reads mapping at d0, d1, or d2 were combined. The output was limited to categories collecting at least 0.2% of total mapped reads to either mature or its precursor. The predominant RNA category was identified by reads mapped to mRNA precursors.
| read length | mRNA prec. |
mRNA | lincRNA prec. |
lincRNA | rRNA prec. |
rRNA | tRNA prec |
tRNA | piRNA | snRNA | snoRNA prec |
snoRNA | … | genome | mito- genome |
|---|---|---|---|---|---|---|---|---|---|---|---|---|---|---|---|
| 5 | 0 | 0 | 0 | 0 | 0 | 0 | 0 | 0 | 0 | 0 | 0 | 0 | … | 0 | 0 |
| 6 | 0 | 0 | 0 | 0 | 0 | 22 | 0 | 6 | 0 | 0 | 0 | 0 | … | 0 | 0 |
| 7 | 0 | 0 | 0 | 0 | 0 | 622 | 0 | 123 | 0 | 22 | 0 | 122 | … | 0 | 0 |
| 8 | 0 | 251 | 0 | 0 | 0 | 1021 | 0 | 645 | 0 | 369 | 0 | 1909 | … | 0 | 7 |
| 9 | 0 | 5413 | 0 | 0 | 0 | 850 | 0 | 513 | 0 | 483 | 0 | 2958 | … | 0 | 5 |
| 10 | 0 | 20817 | 0 | 0 | 0 | 447 | 0 | 196 | 0 | 373 | 0 | 2099 | … | 0 | 5 |
| 11 | 70 | 49509 | 0 | 0 | 0 | 401 | 0 | 177 | 0 | 218 | 0 | 954 | … | 18 | 16 |
| 12 | 2168 | 87447 | 5 | 0 | 0 | 319 | 0 | 52 | 0 | 131 | 0 | 399 | … | 69 | 41 |
| 13 | 16260 | 119065 | 89 | 0 | 0 | 453 | 0 | 51 | 0 | 242 | 0 | 283 | … | 297 | 31 |
| 14 | 72981 | 106431 | 429 | 0 | 1 | 588 | 0 | 52 | 5 | 135 | 0 | 129 | … | 2209 | 31 |
| 15 | 161328 | 78318 | 2982 | 0 | 0 | 967 | 0 | 69 | 30 | 295 | 0 | 38 | … | 11210 | 35 |
| 16 | 209364 | 75440 | 11227 | 20 | 0 | 2084 | 9 | 157 | 113 | 132 | 0 | 37 | … | 49091 | 35 |
| 17 | 219368 | 89037 | 18888 | 106 | 7 | 6212 | 9 | 214 | 160 | 248 | 21 | 154 | … | 79863 | 98 |
| 18 | 277552 | 101040 | 22479 | 266 | 54 | 10079 | 39 | 412 | 202 | 100 | 0 | 83 | … | 77255 | 241 |
| 19 | 321390 | 99934 | 21397 | 296 | 47 | 111973 | 0 | 664 | 185 | 567 | 0 | 32 | … | 83540 | 261 |
| 20 | 327630 | 94772 | 16591 | 969 | 77 | 56691 | 98 | 1044 | 135 | 652 | 10 | 321 | … | 98714 | 1120 |
| 21 | 302580 | 79640 | 15268 | 510 | 134 | 75535 | 65 | 1291 | 362 | 730 | 6 | 989 | … | 97805 | 1586 |
| 22 | 244244 | 61482 | 13032 | 564 | 128 | 107694 | 30 | 901 | 166 | 532 | 0 | 1934 | … | 82853 | 1207 |
| 23 | 187956 | 49314 | 8605 | 598 | 68 | 79955 | 9 | 710 | 188 | 492 | 27 | 955 | … | 63810 | 1699 |
| 24 | 145668 | 42179 | 6932 | 850 | 64 | 72520 | 15 | 619 | 152 | 3416 | 18 | 216 | … | 50525 | 1276 |
| 25 | 119643 | 35339 | 4805 | 185 | 507 | 99529 | 14 | 478 | 37 | 710 | 19 | 344 | … | 39592 | 1114 |
| 26 | 98381 | 27715 | 3963 | 81 | 34 | 84078 | 14 | 397 | 24 | 1715 | 0 | 439 | … | 30319 | 1947 |
| 27 | 77976 | 23088 | 2620 | 399 | 81 | 82730 | 0 | 438 | 81 | 6993 | 0 | 269 | … | 24390 | 4226 |
| 28 | 59255 | 17875 | 2388 | 329 | 35 | 96331 | 30 | 109 | 35 | 222 | 0 | 353 | … | 20045 | 1238 |
| 29 | 51153 | 13419 | 1950 | 515 | 26 | 42993 | 17 | 484 | 13 | 164 | 0 | 397 | … | 16067 | 590 |
| 30 | 41373 | 12382 | 1658 | 46 | 58 | 45796 | 36 | 476 | 0 | 316 | 0 | 336 | … | 13692 | 711 |
| 31 | 35080 | 9679 | 1203 | 180 | 23 | 100141 | 0 | 773 | 36 | 170 | 0 | 367 | … | 12290 | 702 |
| 32 | 30478 | 9282 | 1238 | 122 | 46 | 63864 | 0 | 1086 | 2 | 263 | 0 | 185 | … | 9801 | 851 |
| 33 | 28231 | 9160 | 1035 | 108 | 52 | 116126 | 0 | 2429 | 6 | 370 | 0 | 827 | … | 9111 | 1077 |
| 34 | 0 | 0 | 0 | 0 | 0 | 0 | 0 | 0 | 0 | 0 | 0 | 0 | … | 0 | 0 |
| 35 | 0 | 0 | 0 | 0 | 0 | 0 | 0 | 0 | 0 | 0 | 0 | 0 | … | 0 | 0 |
| 36 | 61884 | 17354 | 3801 | 165 | 213 | 112332 | 12 | 278 | 34 | 3421 | 1 | 859 | … | 20016 | 4770 |
| sum: | 3092013 | 1335382 | 162585 | 6309 | 1655 | 1372353 | 397 | 14844 | 1966 | 23481 | 102 | 17988 | … | 892582 | 24920 |
| % annotated: | 40.96% | 17.69% | 2.15% | 0.08% | 0.02% | 18.18% | 0.01% | 0.20% | 0.03% | 0.31% | 0.00% | 0.24% | … | 11.82% | 0.33% |
Table 4.
Mapping statistics for sequence reads of the RNA category mRNA precursor of FUS PAR-CLIP shown in Tables 2 and 3, representing 41% of all annotated reads. The read counts are resolved by d0, d1 T-to-C, d1 other than T-to-C, or d2 to isolate the fraction of crosslinked reads.
| read length | d0 | d1 T-to-C | d1 other | d2 |
|---|---|---|---|---|
| 5 | 0 | 0 | 0 | 0 |
| 6 | 0 | 0 | 0 | 0 |
| 7 | 0 | 0 | 0 | 0 |
| 8 | 0 | 0 | 0 | 0 |
| 9 | 0 | 0 | 0 | 0 |
| 10 | 0 | 0 | 0 | 0 |
| 11 | 70 | 0 | 0 | 0 |
| 12 | 2168 | 0 | 0 | 0 |
| 13 | 16234 | 0 | 26 | 0 |
| 14 | 72689 | 8 | 284 | 0 |
| 15 | 159382 | 188 | 1758 | 0 |
| 16 | 193927 | 1019 | 14414 | 4 |
| 17 | 146114 | 6240 | 66296 | 718 |
| 18 | 92610 | 26578 | 152883 | 5481 |
| 19 | 58406 | 57865 | 178394 | 26725 |
| 20 | 41152 | 81590 | 117834 | 87054 |
| 21 | 30763 | 85576 | 62147 | 124094 |
| 22 | 25822 | 78150 | 30347 | 109925 |
| 23 | 21475 | 68266 | 17351 | 80864 |
| 24 | 16953 | 58244 | 10755 | 59716 |
| 25 | 17613 | 49496 | 7510 | 45024 |
| 26 | 14576 | 39628 | 6693 | 37484 |
| 27 | 11691 | 32879 | 4582 | 28824 |
| 28 | 6966 | 25273 | 3495 | 23521 |
| 29 | 5659 | 21704 | 3035 | 20755 |
| 30 | 4740 | 17048 | 2348 | 17237 |
| 31 | 3569 | 14780 | 2168 | 14563 |
| 32 | 3612 | 12802 | 1518 | 12546 |
| 33 | 4030 | 10899 | 1972 | 11330 |
| 34 | 0 | 0 | 0 | 0 |
| 35 | 0 | 0 | 0 | 0 |
| 36 | 6754 | 19882 | 5591 | 29657 |
The tabular outputs may also be visualized graphically and we compared FUS to two other RBPs, the cytosolic mRNA-binding protein FMR1 (accession SRX171147) [46], and the nuclear tRNA biogenesis factor SSB/La (accession SRR4301753). PAR-CLIP of each of these proteins captured a different predominant category of RNA. While nuclear FUS was enriched for mRNA precursor, cytosolic FMR1 was enriched for mature mRNA, and SSB for tRNA precursor (Fig. 5). All three proteins showed a substantial fraction of rRNA annotated reads. To visualize the fraction of crosslinked T-to-C conversion reads from non-crosslinked background in each major RNA category, we prefer a stacked column bar graph resolved by read length and error distance d0, d1 T-to-C, d1 other than T-to-C, or d2. Figure 6 revealed that for read length •19 nt the majority of d1 reads of category mRNA and •21 nt of mRNA precursor were d1 T-to-C crosslink reads for FUS. In contrast, the majority of rRNA reads were d0 non-crosslinked background and d1 reads were not dominated by T-to-C. Similar results were obtained for FMR1 (Fig. 7), although the ratio of crosslinked reads for categories mRNA and its precursor were reversed. Finally, analysis of SSB PAR-CLIP showed that the majority of T-to-C reads originated from crosslinking to tRNA precursors but also mature tRNA and rRNA (Fig. 8), predominantly the 3’ end of 5S rRNA.
Fig. 5.

Graphic presentation of the PAR-CLIP cDNA library composition by RNA categories for A) FUS, B) FMR1, and C) SSB/La. Stacked bar graphs represent the number of reads mapping to each RNA category with up to 2 mismatches resolved by length of adapter-extracted sequence reads. Categories of less than 0.01% of reads were grouped and depicted as “other”.
Fig. 6.

FUS PAR-CLIP sequencing read composition of the most abundant RNA categories. Reads were assigned as d0 (white), d1 T-to-C (red), d1 other than T-to-C, (light grey), and d2 (black) for A) mRNA, B) mRNA prec., and C) rRNA.
Fig. 7.

FMR1 PAR-CLIP sequencing read composition of the most abundant RNA categories. Reads were assigned as d0 (white), d1 T-to-C (red), d1 other than T-to-C, (light grey), and d2 (black) for A) mRNA, B) mRNA prec., and C) rRNA.
Fig. 8.

SSB/La PAR-CLIP sequencing read composition of the most abundant RNA categories. Reads were assigned as d0 (white), d1 T-to-C (red), d1 other than T-to-C, (light grey), and d2 (black) for A) tRNA prec., B) tRNA, and C) rRNA.
When evaluating the T-to-C content of d1 reads in categories of RNA considered as background, the T-to-C frequency should be slightly elevated above 8.3%, which represents the theoretical value assuming unbiased d1 sequencing errors. The T-to-C conversion frequency of a synthetic 4SU-modified oligoribonucleotide was determined at 10–20% at the site of modification, which increased to 50–80% upon crosslinking [11]. Considering an incorporation rate of 4% of 4SU and an upper limit T-to-C conversion frequency of 20%, the background T-to-C conversion frequency would increase by 0.8% per U, or approximately 5% from 8.3 to 13.3% for a 25-mer of random sequence composition.
For practical purposes, we pursue dataset which collect at least 10,000 redundant d1 reads •20 nt in at least one of major RNA annotation categories, d1(T-to-C)/(d0+d1)•30%, and d1(T-to-C)/(d1-d1(T-to-C))•65%. The latter two criteria attempt to disqualify experiments comprising too many non-crosslinked RBP-specifically bound RNAs or co-purified non-crosslinked background RNAs.
5. Conclusions
Since its introduction in 2010 [11], PAR-CLIP has been applied to study over 100 RBP families [11,13–20,22,46]. Accompanied by the continuous improvement in deep sequencing technologies, PAR-CLIP enabled increasingly comprehensive identification of target sites of RBPs, and the interplay between hundreds of RBPs and their target RNAs will be studied in the nearer future. To contribute to this process, we provided a detailed step-by-step PAR-CLIP protocol emphasizing optimization of critical experimental steps, and we introduced a data analysis pipeline to rapidly inform the experimentalists about the quality of their experiments, and the annotation category of their crosslinked RNAs in order to guide downstream data and functional analysis.
Supplementary Material
Acknowledgments
T.T. is an HHMI investigator and acknowledges support from an award by the US National Institutes of Health (R01-GM104962). A.G. held a postdoctoral fellowship from the Basque Government. C.M. was supported by the German Academic Exchange Service (DAAD). M.S. was supported by the MS-ETHIUDA scholarship from National Science Center, Poland.
Footnotes
Publisher's Disclaimer: This is a PDF file of an unedited manuscript that has been accepted for publication. As a service to our customers we are providing this early version of the manuscript. The manuscript will undergo copyediting, typesetting, and review of the resulting proof before it is published in its final citable form. Please note that during the production process errors may be discovered which could affect the content, and all legal disclaimers that apply to the journal pertain.
Accession numbers
The NCBI SRA accession number for the sequencing data reported in this paper is SRR4301753.
References
- 1.Martin KC, Ephrussi A. mRNA localization: gene expression in the spatial dimension. Cell. 2009;136:719–730. doi: 10.1016/j.cell.2009.01.044. [DOI] [PMC free article] [PubMed] [Google Scholar]
- 2.Moore MJ, Proudfoot NJ. Pre-mRNA processing reaches back to transcription and ahead to translation. Cell. 2009;136:688–700. doi: 10.1016/j.cell.2009.02.001. [DOI] [PubMed] [Google Scholar]
- 3.Sonenberg N, Hinnebusch AG. Regulation of translation initiation in eukaryotes: mechanisms and biological targets. Cell. 2009;136:731–745. doi: 10.1016/j.cell.2009.01.042. [DOI] [PMC free article] [PubMed] [Google Scholar]
- 4.Gerstberger S, Hafner M, Tuschl T. A census of human RNA-binding proteins. Nat. Rev. Genet. 2014;15:829–845. doi: 10.1038/nrg3813. [DOI] [PMC free article] [PubMed] [Google Scholar]
- 5.Greenberg JR. Ultraviolet light-induced crosslinking of mRNA to proteins. Nucleic Acids Res. 1979;6:715–732. doi: 10.1093/nar/6.2.715. [DOI] [PMC free article] [PubMed] [Google Scholar]
- 6.Wagenmakers AJ, Reinders RJ, van Venrooij WJ. Cross-linking of mRNA to proteins by irradiation of intact cells with ultraviolet light. Eur. J. Biochem. 1980;112:323–330. doi: 10.1111/j.1432-1033.1980.tb07207.x. [DOI] [PubMed] [Google Scholar]
- 7.Mayrand S, Setyono B, Greenberg JR, Pederson T. Structure of nuclear ribonucleoprotein: identification of proteins in contact with poly(A)+ heterogeneous nuclear RNA in living HeLa cells. The Journal of Cell Biology. 1981;90:380–384. doi: 10.1083/jcb.90.2.380. [DOI] [PMC free article] [PubMed] [Google Scholar]
- 8.Dreyfuss G, Choi YD, Adam SA. Characterization of heterogeneous nuclear RNA-protein complexes in vivo with monoclonal antibodies. Molecular and Cellular Biology. 1984;4:1104–1114. doi: 10.1128/mcb.4.6.1104. [DOI] [PMC free article] [PubMed] [Google Scholar]
- 9.Ascano M, Hafner M, Cekan P, Gerstberger S, Tuschl T. Identification of RNA-protein interaction networks using PAR-CLIP. WIREs RNA. 2011 doi: 10.1002/wrna.1103. n/a–n/a. [DOI] [PMC free article] [PubMed] [Google Scholar]
- 10.Wang T, Xiao G, Chu Y, Zhang MQ, Corey DR, Xie Y. Design and bioinformatics analysis of genome-wide CLIP experiments. Nucleic Acids Res. 2015;43:1–12. doi: 10.1093/nar/gkv439. [DOI] [PMC free article] [PubMed] [Google Scholar]
- 11.Hafner M, Landthaler M, Burger L, Khorshid M, Hausser J, Berninger P, et al. Transcriptome-wide identification of RNA-binding protein and microRNA target sites by PAR-CLIP. Cell. 2010;141:129–141. doi: 10.1016/j.cell.2010.03.009. [DOI] [PMC free article] [PubMed] [Google Scholar]
- 12.Hafner M, Lianoglou S, Lianoglou S, Tuschl T, Betel D. Genome-wide identification of miRNA targets by PAR-CLIP. Methods. 2012;58:94–105. doi: 10.1016/j.ymeth.2012.08.006. [DOI] [PMC free article] [PubMed] [Google Scholar]
- 13.Lebedeva S, Jens M, Theil K, Schwanhäusser B, Selbach M, Landthaler M, et al. Transcriptome-wide analysis of regulatory interactions of the RNA-binding protein HuR. Mol Cell. 2011;43:340–352. doi: 10.1016/j.molcel.2011.06.008. [DOI] [PubMed] [Google Scholar]
- 14.Jungkamp A-C, Stoeckius M, Mecenas D, Grün D, Mastrobuoni G, Kempa S, et al. In vivo and transcriptome-wide identification of RNA binding protein target sites. Mol Cell. 2011;44:828–840. doi: 10.1016/j.molcel.2011.11.009. [DOI] [PMC free article] [PubMed] [Google Scholar]
- 15.Creamer TJ, Darby MM, Jamonnak N, Schaughency P, Hao H, Wheelan SJ, et al. Transcriptome-wide binding sites for components of the Saccharomyces cerevisiae non-poly(A) termination pathway: Nrd1, Nab3, and Sen1. PLoS Genet. 2011;7:e1002329. doi: 10.1371/journal.pgen.1002329. [DOI] [PMC free article] [PubMed] [Google Scholar]
- 16.Baejen C, Torkler P, Gressel S, Essig K, Söding J, Cramer P. Transcriptome maps of mRNP biogenesis factors define pre-mRNA recognition. Mol Cell. 2014;55:745–757. doi: 10.1016/j.molcel.2014.08.005. [DOI] [PubMed] [Google Scholar]
- 17.Hansen HT, Rasmussen SH, Adolph SK, Plass M, Krogh A, Sanford J, et al. Drosophila Imp iCLIP identifies an RNA assemblage coordinating F-actin formation. Genome Biol. 2015;16:123. doi: 10.1186/s13059-015-0687-0. [DOI] [PMC free article] [PubMed] [Google Scholar]
- 18.Xiong X-P, Vogler G, Kurthkoti K, Samsonova A, Zhou R. SmD1 Modulates the miRNA Pathway Independently of Its Pre-mRNA Splicing Function. PLoS Genet. 2015;11:e1005475. doi: 10.1371/journal.pgen.1005475. [DOI] [PMC free article] [PubMed] [Google Scholar]
- 19.Flores O, Nakayama S, Whisnant AW, Javanbakht H, Cullen BR, Bloom DC. Mutational inactivation of herpes simplex virus 1 microRNAs identifies viral mRNA targets and reveals phenotypic effects in culture. J. Virol. 2013;87:6589–6603. doi: 10.1128/JVI.00504-13. [DOI] [PMC free article] [PubMed] [Google Scholar]
- 20.Wagschal A, Najafi-Shoushtari SH, Wang L, Goedeke L, Sinha S, deLemos AS, et al. Genome-wide identification of microRNAs regulating cholesterol and triglyceride homeostasis. Nat Med. 2015;21:1290–1297. doi: 10.1038/nm.3980. [DOI] [PMC free article] [PubMed] [Google Scholar]
- 21.Spitzer J, Hafner M, Landthaler M, Ascano M, Farazi TA, Wardle G, et al. PAR-CLIP (Photoactivatable Ribonucleoside-Enhanced Crosslinking and Immunoprecipitation): a step-by-step protocol to the transcriptome-wide identification of binding sites of RNA-binding proteins. Meth. Enzymol. 2014;539:113–161. doi: 10.1016/B978-0-12-420120-0.00008-6. [DOI] [PMC free article] [PubMed] [Google Scholar]
- 22.Llobet-Navas D, Rodríguez-Barrueco R, de la Iglesia-Vicente J, Olivan M, Castro V, Saucedo-Cuevas L, et al. The microRNA 424/503 cluster reduces CDC25A expression during cell cycle arrest imposed by transforming growth factor in mammary epithelial cells. Molecular and Cellular Biology. 2014;34:4216–4231. doi: 10.1128/MCB.00611-14. [DOI] [PMC free article] [PubMed] [Google Scholar]
- 23.Farazi TA, Ten Hoeve JJ, Brown M, Mihailovic A, Horlings HM, van de Vijver MJ, et al. Identification of distinct miRNA target regulation between breast cancer molecular subtypes using AGO2-PAR-CLIP and patient datasets. Genome Biol. 2014;15:R9. doi: 10.1186/gb-2014-15-1-r9. [DOI] [PMC free article] [PubMed] [Google Scholar]
- 24.Lipchina I, Elkabetz Y, Hafner M, Sheridan R, Mihailovic A, Tuschl T, et al. Genome-wide identification of microRNA targets in human ES cells reveals a role for miR-302 in modulating BMP response. Genes Dev. 2011;25:2173–2186. doi: 10.1101/gad.17221311. [DOI] [PMC free article] [PubMed] [Google Scholar]
- 25.Kishore S, Jaskiewicz L, Burger L, Hausser J, Khorshid M, Zavolan M. A quantitative analysis of CLIP methods for identifying binding sites of RNA-binding proteins. Nat Meth. 2011;8:559–564. doi: 10.1038/nmeth.1608. [DOI] [PubMed] [Google Scholar]
- 26.Chi SW, Zang JB, Mele A, Darnell RB. Argonaute HITS-CLIP decodes microRNA-mRNA interaction maps. Nature. 2009;460:479–486. doi: 10.1038/nature08170. [DOI] [PMC free article] [PubMed] [Google Scholar]
- 27.Wang Z, Tollervey J, Briese M, Turner D, Ule J. CLIP: construction of cDNA libraries for high-throughput sequencing from RNAs cross-linked to proteins in vivo. Methods. 2009;48:287–293. doi: 10.1016/j.ymeth.2009.02.021. [DOI] [PubMed] [Google Scholar]
- 28.Wang Z, Kayikci M, Briese M, Zarnack K, Luscombe NM, Rot G, et al. iCLIP Predicts the Dual Splicing Effects of TIA-RNA Interactions. Plos Biol. 2010;8:e1000530–e1000516. doi: 10.1371/journal.pbio.1000530. [DOI] [PMC free article] [PubMed] [Google Scholar]
- 29.Krell J, Stebbing J, Carissimi C, Dabrowska AF, de Giorgio A, Frampton AE, et al. TP53 regulates miRNA association with AGO2 to remodel the miRNA-mRNA interaction network. Genome Res. 2016;26:331–341. doi: 10.1101/gr.191759.115. [DOI] [PMC free article] [PubMed] [Google Scholar]
- 30.Szczepi ska T, Kalisiak K, Tomecki R, Labno A, Borowski LS, Kulinski TM, et al. DIS3 shapes the RNA polymerase II transcriptome in humans by degrading a variety of unwanted transcripts. Genome Res. 2015;25:1622–1633. doi: 10.1101/gr.189597.115. [DOI] [PMC free article] [PubMed] [Google Scholar]
- 31.Schönemann L, Kühn U, Martin G, Schäfer P, Gruber AR, Keller W, et al. Reconstitution of CPSF active in polyadenylation: recognition of the polyadenylation signal by WDR33. Genes Dev. 2014;28:2381–2393. doi: 10.1101/gad.250985.114. [DOI] [PMC free article] [PubMed] [Google Scholar]
- 32.Ping X-L, Sun B-F, Wang L, Xiao W, Yang X, Wang W-J, et al. Mammalian WTAP is a regulatory subunit of the RNA N6-methyladenosine methyltransferase. Cell Res. 2014;24:177–189. doi: 10.1038/cr.2014.3. [DOI] [PMC free article] [PubMed] [Google Scholar]
- 33.Sundararaman B, Zhan L, Blue SM, Stanton R, Elkins K, Olson S, et al. Resources for the Comprehensive Discovery of Functional RNA Elements. Mol Cell. 2016;61:903–913. doi: 10.1016/j.molcel.2016.02.012. [DOI] [PMC free article] [PubMed] [Google Scholar]
- 34.Hafner M, Renwick N, Farazi TA, Mihailovic A, Pena JTG, Tuschl T. Barcoded cDNA library preparation for small RNA profiling by next-generation sequencing. Methods. 2012;58:164–170. doi: 10.1016/j.ymeth.2012.07.030. [DOI] [PMC free article] [PubMed] [Google Scholar]
- 35.Corcoran DL, Georgiev S, Georgiev S, Mukherjee N, Gottwein E, Skalsky RL, et al. PARalyzer: definition of RNA binding sites from PAR-CLIP short-read sequence data. Genome Biol. 2011;12:R79. doi: 10.1186/gb-2011-12-8-r79. [DOI] [PMC free article] [PubMed] [Google Scholar]
- 36.Mukherjee N, Jacobs NC, Hafner M, Kennington EA, Nusbaum JD, Tuschl T, et al. Global target mRNA specification and regulation by the RNA-binding protein ZFP36. Genome Biol. 2014;15:R12. doi: 10.1186/gb-2014-15-1-r12. [DOI] [PMC free article] [PubMed] [Google Scholar]
- 37.Khorshid M, Rodak C, Zavolan M. CLIPZ: a database and analysis environment for experimentally determined binding sites of RNA-binding proteins. Nucleic Acids Res. 2011;39:D245–D252. doi: 10.1093/nar/gkq940. [DOI] [PMC free article] [PubMed] [Google Scholar]
- 38.Yang J-H, Li J-H, Shao P, Zhou H, Chen Y-Q, Qu L-H. starBase: a database for exploring microRNA-mRNA interaction maps from Argonaute CLIP-Seq and Degradome-Seq data. Nucleic Acids Res. 2011;39:D202–D209. doi: 10.1093/nar/gkq1056. [DOI] [PMC free article] [PubMed] [Google Scholar]
- 39.Sievers C, Schlumpf T, Sawarkar R, Comoglio F, Paro R. Mixture models and wavelet transforms reveal high confidence RNA-protein interaction sites in MOV10 PAR-CLIP data. Nucleic Acids Res. 2012;40:e160–e160. doi: 10.1093/nar/gks697. [DOI] [PMC free article] [PubMed] [Google Scholar]
- 40.Anders G, Mackowiak SD, Jens M, Maaskola J, Kuntzagk A, Rajewsky N, et al. doRiNA: a database of RNA interactions in post-transcriptional regulation. Nucleic Acids Res. 2012;40:D180–D186. doi: 10.1093/nar/gkr1007. [DOI] [PMC free article] [PubMed] [Google Scholar]
- 41.Uren PJ, Bahrami-Samani E, Burns SC, Qiao M, Karginov FV, Hodges E, et al. Site identification in high-throughput RNA-protein interaction data. Bioinformatics. 2012;28:3013–3020. doi: 10.1093/bioinformatics/bts569. [DOI] [PMC free article] [PubMed] [Google Scholar]
- 42.Chou C-H, Lin F-M, Chou M-T, Hsu S-D, Chang T-H, Weng S-L, et al. A computational approach for identifying microRNA-target interactions using high-throughput CLIP and PAR-CLIP sequencing. BMC Genomics. 2013;14(Suppl 1):S2. doi: 10.1186/1471-2164-14-S1-S2. [DOI] [PMC free article] [PubMed] [Google Scholar]
- 43.Chen B, Yun J, Kim MS, Mendell JT, Xie Y. PIPE-CLIP: a comprehensive online tool for CLIP-seq data analysis. Genome Biol. 2014;15:R18. doi: 10.1186/gb-2014-15-1-r18. [DOI] [PMC free article] [PubMed] [Google Scholar]
- 44.Wang T, Xie Y, Xiao G. dCLIP: a computational approach for comparative CLIP-seq analyses. Genome Biol. 2014;15:R11. doi: 10.1186/gb-2014-15-1-r11. [DOI] [PMC free article] [PubMed] [Google Scholar]
- 45.Hoell JI, Larsson E, Larsson E, Runge S, Nusbaum JD, Duggimpudi S, et al. . RNA targets of wild-type and mutant FET family proteins. Nature Publishing Group. 2011:1–4. doi: 10.1038/nsmb.2163. [DOI] [PMC free article] [PubMed] [Google Scholar]
- 46.Ascano M, Mukherjee N, Bandaru P, Miller JB, Nusbaum JD, Corcoran DL, et al. FMRP targets distinct mRNA sequence elements to regulate protein expression. Nature. 2012;492:382–386. doi: 10.1038/nature11737. [DOI] [PMC free article] [PubMed] [Google Scholar]
- 47.Skalsky RL, Corcoran DL, Gottwein E, Frank CL, Kang D, Hafner M, et al. The viral and cellular microRNA targetome in lymphoblastoid cell lines. PLoS Pathog. 2012;8:e1002484. doi: 10.1371/journal.ppat.1002484. [DOI] [PMC free article] [PubMed] [Google Scholar]
- 48.Langmead B. Aligning short sequencing reads with Bowtie. Curr Protoc Bioinformatics. 2010 doi: 10.1002/0471250953.bi1107s32. Chapter 11 Unit 11.7. [DOI] [PMC free article] [PubMed] [Google Scholar]
Associated Data
This section collects any data citations, data availability statements, or supplementary materials included in this article.