Abstract
SETD7 is associated with multiple diseases related signaling pathways. (R)-PFI-2 is the first SETD7 inhibitor with nanomolar inhibitory potency. The activity of (R)-PFI-2 is about 500 times over that of (S)-PFI-2. Understanding the mechanism behind this difference will be helpful to discovery and design of more potent SETD7 inhibitors. A computational study combining molecular dynamics simulation, binding free energy calculations, and residue interaction network (RIN) was performed on the (S)-PFI-2/SETD7 and (R)-PFI-2/SETD7 complexes to explore the molecular mechanism behind the different inhibition activity. The results from Molecular Mechanics/Generalized Born Surface Area (MM/GBSA) calculation show (R)-PFI-2 has lower binding free energy. Residues H252, D256, L267, Y335, G336 and H339 are responsible for the binding of SETD7 to the (R)-PFI-2. RIN analysis indicates van der Waals interaction is critical for the binding of (R)-PFI-2. The results from adaptive basing force (ABF) simulation confirm that the free energy barrier of (R)-PFI-2 dissociating from the SETD7 is larger than that of (S)-PFI-2. (S)-PFI-2 and (R)-PFI-2 dissociate from the SETD7 binding site along different reaction coordinate and have potential mean of force (PMF) depth. Our simulations results will be useful to understand molecular mechanism of activity difference between PFI-2 enantiomers against SETD7.
SETD7 (SET domain-containing lysine methyltransferase 7, also called SET7, SET9, KMT7) functions in transcriptional regulation1,2,3, cell cycle control4,5,6, differentiation7, DNA repair8 and DNMT19,10. Increasing evidences suggest that SETD7 is closely associated with various diseases and. the epigenetic changes induced by SETD7 contribute to vascular dysfunction in patients with type 2 diabetes11. As SETD7 is a promising target in several diseases, including diabetes, alopecia areata, cancers and virus infection, several attempts have been made to discovery of SETD7 inhibitors12,13,14,15,16,17,18,19, but the majority of these inhibitors have weak inhibitory activity. (R)-PFI-220 is a potent and selective inhibitor targeting SETD7 in MCF7 cells. Meanwhile, (R)-PFI-2 shows a much higher inhibiting activity (IC50 ≈ 2.0 ± 0.2 nM) with respect to the (S)-PFI-2(IC50 ≈ 1.0 ± 0.1 μM). (R)-PFI-2 is the first SETD7 inhibitor with nanomolar inhibitory potency and known mechanism. Therefore, a good understanding of the interaction of each enantiomer with their target protein SETD7 could provide insights to improve their efficacy and is important for designing more potent inhibitors.
Currently, molecular dynamics (MD) combined with binding free energy calculated by Molecular Mechanics/Generalized Born Surface Area (MM/GBSA)21,22,23,24 have been successfully used to explore the ligand-receptor interaction. This method can provide not only abundant dynamics structural information on the ligand-SETD7 complex structures in equilibrium phase but also the binding free energy between the ligand and the SETD7 protein. Such information is of importance to understand the detail of ligand-SETD7 interaction and the different inhibitory mechanisms. In addition to the thermodynamics, the binding kinetics between the ligand and the SETD protein is also important to assess the drug efficacy. The adaptive biasing force (ABF) method25,26 method can markedly improve the accuracy of the free energy calculation, which adds biasing force on the ligand for the purpose of canceling the local barrier acted on the ligand, so the ligand can go with a free-diffusion-like behavior along the reaction coordinate (RC). Residues interaction network (RIN) analysis of the protein-ligand complex can provide some information about the residue interactions to discover possible mechanisms of inhibitory activity. As a result, the combination uses of binding free energy calculations by binding free energy calculation, and network analysis approaches should be effective to understand the inhibition and enantiomer-selectivity mechanism of SETD7.
In our work, we performed a molecular modeling study combining molecular dynamics (MD), MM/GBSA calculations, ABF calculations, and RIN analysis to investigate the mechanism of enantiomer of (S)-PFI-2 and (R)-PFI-2 binding on the SETD7. The MM/GBSA calculations could calculate the binding free energy of the two ligands binding with the SETD7 protein and also identify the key residues for the SETD7 binding to (R)-PFI-2. The RIN analysis could illustrate that the (R)-PFI-2 and (S)-PFI-2 are different in the key interaction residues. The PMF profiles calculated by the ABF could give the information that the difficulty of the two ligands unbinding from the active pocket of the SETD7 protein. Our simulation results show that the higher affinity of the (R)-PFI-2 relative to the (S)-PFI-2 can be related to the different binding mode, binding affinity and different free energy barriers dissociating from the SETD7 binding pocket.
Materials and Methods
Preparation of complex systems
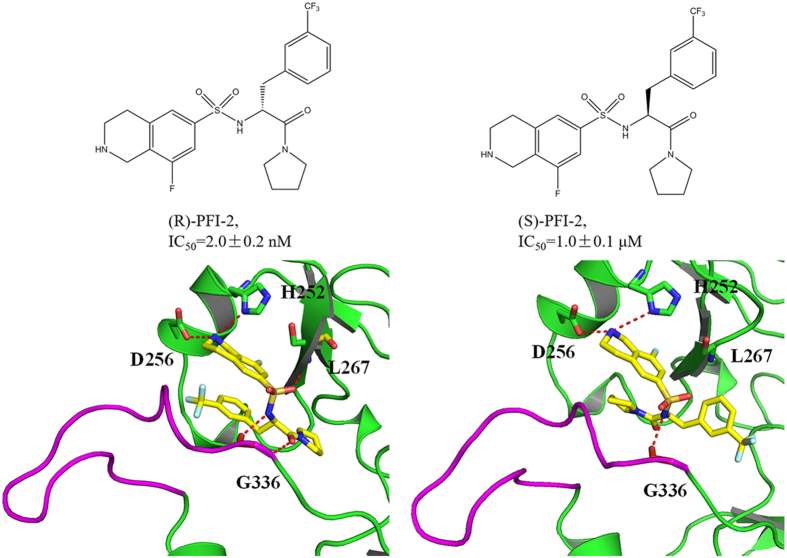
The initial atomic co-ordinates for R-PFI-2/SETD7 complex were obtained from the RCSB Protein Data Bank (PDB ID code: 4JLG20). The missing residues were fixed and aligned together using Discovery Studio 2.527. We docked the ligand (S)-PFI-2 to the active site of the SETD7 protein by molecular docking to get the structure of (S)-PFI-2/SETD7 complex in Schrödinger 200928 and then the structures of the two complexes were prepared. The 2D structure of the two ligands and the binding mode with the SETD7 protein were shown in Fig. 1. The partial charges of the (S)-PFI-2 and (R)-PFI-2 were calculated at the HF/6-31 G(d) level of theory and fixed using the RESP methodology29,30,31. Each receptor-ligand construct was finally parametrized using the AMBER99SB32 and GAFF force fields33. Then, the complexes were solvated with TIP3P water models34 in a 10 Å cubic box using Leap, and Na+ ions were added to neutralize the net charge of the system.
Figure 1. Overview the 2D structure of (R)-PFI-2 and (S)-PFI-2 as well as the binding mode with the SETD7 protein.
Left: the (R)-PFI-2 and the binding mode of (R)-PFI-2 with the SETD7; Right: the (S)-PFI-2 and the binding mode of (S)-PFI-2 and SETD7.
Conventional MD simulations parameters and protocols
All of the MD simulations were performed with the NAMD 2.9 simulation package35. The energy of the two systems was minimized by a steepest-descent minimization scheme for 40000 steps initially and then the temperature of these two systems rose gradually in the NVT ensemble from 0 to 310 K in 100 ps, and during the process a constant force of 10 kcal/mol·Å2 was applied to the protein backbone. The restrain decreased from 10 to 0.01 kcal/mol·Å2 gradually within 0.9 ns. 100 ns MD simulations were carried out without any restrain. During the whole process of the conventional molecular dynamics (CMD) simulation, the time step, the temperature, the pressure were set 2 fs, 310 K, 1 atm., respectively. The SHAKE36 algorithm was used to restrain all bonds involving hydrogen atoms. The cutoff of 10 Å was set to calculate the short-range nonbonded interactions, while the long-range electrostatic interactions was treated by the Particle Mesh Ewald (PME) algorithm37.
MM/GBSA calculations
Although thermodynamic integration (TI)38,39,40 and free energy perturbation (FEP)41 are more theoretically rigorous, MM/GBSA42,43,44,45 also shows the obvious advantage that the binding free energy can be decomposed into several terms, including the van der Waals, angle, torsion, bond, and electrostatic terms. In MM/GBSA, the binding free energy can be calculated as follows:
 |
Where 〈ΔGbind〉 represents the average free energy, and 〈ΔEMM〉 is the average molecular mechanical energy.
 |
 |
〈ΔGsolvation〉, 〈ΔGGB〉, and 〈ΔGSA〉 are the desolvation free energy upon ligand binding, polar, and nonpolar contributions, respectively. The Generalized Born (GB) model (igb = 2)46 is used to calculate the polar contribution of desolvation. The dielectric constants for solvent and solute were set to 80 and 1, respectively. The solvent accessible surface area (SASA) determines the nonpolar contribution of desolvation using the LCPO method33:ΔGSA = ΔSASA × 0.0072. The normal-mode analysis47 is used to calculate the conformational entropy contribution (−T 〈ΔS〉) in AMBER1048.
To determine the contribution of individual residue to the total binding free energy between the two inhibitors and the SETD7, the MM/GBSA binding free energy decomposition process was used to decompose the interaction energy to each residue involved in the interaction by considering molecular mechanics and solvation energy without consideration of the contribution of entropy.
Residue interaction network calculation
The average structure derived from the last 20 ns MD simulation trajectory of each system was used for constructing the residue interaction network (RIN). The Ring49 web server is convenient for identifying of covalent and noncovalent bonds in protein structures, including π-π stacking and π-cation interactions. The software Cytoscape50 was used to visualize the residue interaction network with protein residues and their noncovalent interactions represented by nodes and edges, respectively.
Adaptive biasing force (ABF) simulation
The adaptive biasing force (ABF) method25,51,52 is a powerful tool for determining free energy profile along a chosen reaction coordinate (RC), based on the probability to find the system in the thermodynamic state characterized by a particular value of the reaction coordinate26. Therefore, ABF method was employed to study the change of free energy of the two ligands moving out the SETD7 binding pocket along the RC. In details, the reaction coordinate was defined by the distance between the atoms CB of the residue T266 and the atom S of (R)-PFI-2 and (S)-PFI-2. In order to guarantee the direction of the RC, the elastic constant of 5 kcal/mol.Å2 was applied to the residues out of 10 Å of the ligand. The details about the parameters setting can refer our previous works53,54.
Results and Discussion
Convergence of the simulation systems
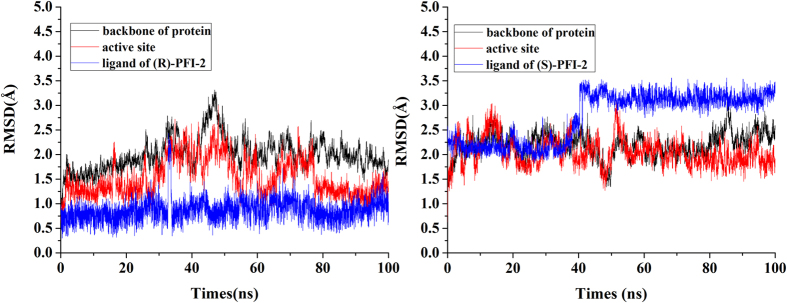
MD simulations for the two complexes in solution are run for duration of 100 ns. To explore the dynamic stability of complexes and to ensure the rationality of the sampling method, the root-mean-square (RMS) deviations values of the Cα atoms of the protein, the heavy atoms of the ligand and the Cα atoms within 5 Å of the binding pocket were monitored. As can be seen in Fig. 2, after 50 ns, the RMSD of each system tends to be convergent, indicating the two systems are equilibrated.
Figure 2. The monitoring of MD trajectories.
Left: The (R)-PFI-2/SETD7 complex; Right: The (S)-PFI-2/SETD7 complex. The values reflect the equilibration of each of the systems relative to the initial structures.
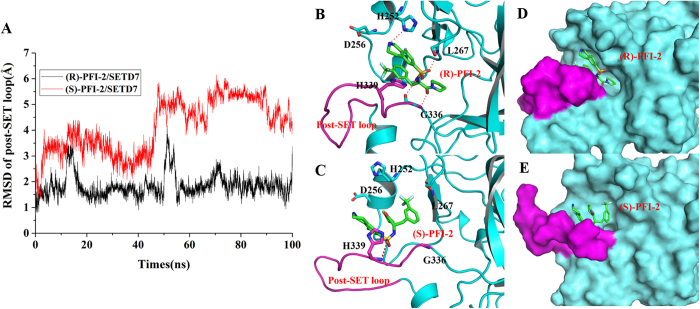
We also monitored the RMSD of the post-SET loop (residues 336–349) and the results were shown in Fig. 3. The RMSD value of the post-SET loop of the (S)-PFI-2/SETD7 complex is larger than that of (R)-PFI-2/SETD7complex. In order to analyze the reason behind this conformational change, we obtained the average structures from the equilibrium CMD trajectory (Fig. 3B–E). The detailed binding mode of (S)-PFI-2 and (R)-PFI-2 with the SETD7 protein reveals that the post-SET loop of (R)-PFI-2/SETD7 complex moves out compared with that of the (R)-PFI-2/SETD7 complex,, which. makes (S)-PFI-2 expose more in solvents.
Figure 3. The RMSD fluctuation of the post-SET loop and the average structure of the two complexes from the last 50 ns of CMD trajectories.
Figure 1 shows that the post-SET loop of the SETD7 exhibits an optimized shape match and forms hydrophobic interaction with the trifluoromethyl moiety of (R)-PFI-2, but this interaction disappears in the (S)-PFI-2/SETD7 complex. The H-bond formed between the residues H252, as well as L267 and G336, and (S)-PFI-2 disappears and the intramolecular π-π stacking interaction between the phenyl group and the droisoquinoline core of the ligand (S)-PFI-2 is also broke up due to the different binding mode of the (S)-PFI-2 with SETD7. The higher inhibitory activity of the (R)-PFI-2 is mainly related to the presence in its complex of a direct H-bond interaction with the residue H252, L267 and G336 while there is only one hydrogen bond interaction between (S)-PFI-2 and the residue H339.
Binding free energy calculated by the MM/GBSA method
The MM/GBSA method22,55 has been widely employed to study the ligand and receptor interaction in many cases56,57,58,59,60,61. The calculated binding free energy of (S)-PFI-2 and (R)-PFI-2 binding to SETD7 by the MM/GBSA protocol is shown in Table 1. The calculated contributions favoring to the inhibitors (R)-PFI-2 and (S)-PFI-2 binding include the electrostatic interactions (〈ΔEele〉), ranging from −374.97 kcal·mol−1 for (R)-PFI-2/SETD7 complex to −356.80 kcal·mol−1 for (S)-PFI-2/SETD7 complex, and the intermolecular van der Waals energy (〈ΔEvdw〉) ranging from −53.44 to −46.85 kcal·mol−1. Nonpolar polar solvation terms (ΔGnonpolar, are ranging from −60.01 to −53.63 kcal·mol−1), which corresponds to the burial of solvent accessible surface area (SASA) upon binding. The polar solvation contribution (ΔGpolar, ranging from 10.20 to 15.67 kcal·mol−1) has unfavorable contribution to the (R)-PFI-2 binding. The value of entropic contributions (−TΔS) are 18.58 kcal·mol−1 for (R)-PFI-2/SETD7 complex and 15.84 kcal·mol−1 for (S)-PFI-2/SETD7 complex, indicating that conformational change of the system is responsible for SETD7-ligand interaction. The total binding free energies (ΔGbind) predicted for (S)-PFI-2 and (R)-PFI-2 binding with the SETD7 protein are different, with values ranging from −23.23 to −15.84 kcal·mol−1. The results prove that the theoretical calculated binding free energies agree with that from experimental values.
Table 1. Binding free energy between PFI-2 and SETD7 predicted by MM/GBSA method.
| Contribution | (R)-PFI-2/SETD7 | (S)-PFI-2/SETD7 |
|---|---|---|
| ΔEele | −374.97 ± 3.67c | −356.80 ± 3.81 |
| ΔEvdw | −53.44 ± 2.02 | −46.85 ± 2.50 |
| ΔGSA | −6.57 ± 0.48 | −6.78 ± 0.47 |
| ΔGGB | 385.17 ± 2.22 | 365.67 ± 2.28 |
| ΔGnonpolara | −60.01 ± 4.04 | −53.63 ± 2.54 |
| ΔGpolarb | 10.20 ± 4.29 | 15.67 ± 4.44 |
| ΔGtotal,GB | −49.81 ± 5.89 | −37.96 ± 5.11 |
| −TΔS | 18.58 ± 2.18 | 22.12 ± 3.40 |
| ΔGbind | −23.23 ± 6.28 | −15.84 ± 6.14 |
aΔGnonpolar = ΔEvdw + ΔGSA.
bΔGpolar = ΔEele + ΔGGB.
cstandard deviations calculated through 10 times of repeated sampling from last 50 ns trajectory.
Identification of the key residues for SETD7 binding to (R)-PFI-2
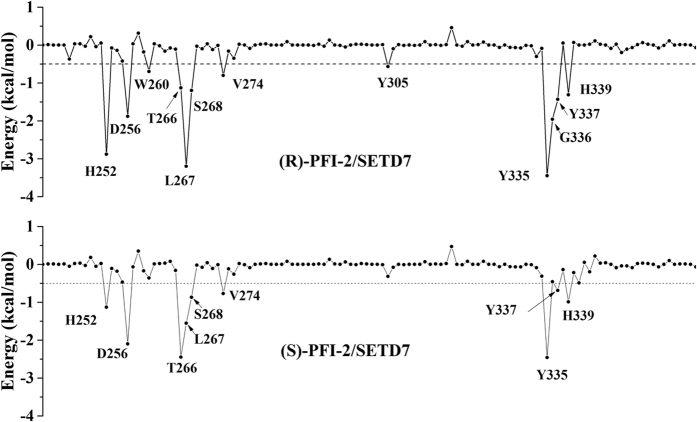
To obtain a more detailed thermodynamic description of the residue contributions to the binding free energy, we decomposed the enthalpy value (ΔGtotal,GB) into a per-residue level depicted in Fig. 4. On the basis of the individual residue contribution to the interaction energy, we identified residues contributing to the binding of (S)-PFI-2 and (R)-PFI-2: H252, D256, W260, T266, L267, S268, Y305, Y335, Y337 and H339 with their contributions varing from −0.57 to −3.45 kcal·mol−1 (Fig. 4).
Figure 4. Per-residue decomposition of binding free energy contributions of (R)-PFI-2/SETD7 and (S)-PFI-2/SETD7 complexes.
By comparing the individual residue contribution to the binding free energy of (S)-PFI-2/SETD7 and (R)-PFI-2/SETD7 systems (Fig. 4), we analyzed the molecular basis of the difference between the potency changes of (S)-PFI-2 and (R)-PFI-2. We found that the contributions from residues H252, W260, L267, S268, Y305, Y335, Y337 and H339 increased in (R)-PFI-2/SETD7 complex. In contrast, the contributions from residues D256, T266 and G336 decreased. Furthermore, the residues H252 and L267 form hydrogen bond and their contributions decreased in (S)-PFI-2/SETD7 complex. The residues G336, Y337 and H339 are located in the post-SET loop. Their contributions are different in (S)-PFI-2/SETD7 and (R)-PFI-2/SETD7 complexes due to the structure rearrangements of the active site of the (S)-PFI-2/SETD7 complex caused by the conformational change of the post-SET loop. Barsyte-Lovejoy et al.20 reported the importance of the residues H252, D256 and V274 by site-directed mutagenesis. They conform that the residues H252, D256 and V274 make important contributions to the mode of inhibition by (R)-FPI-2.
Results from residue interaction network analysis
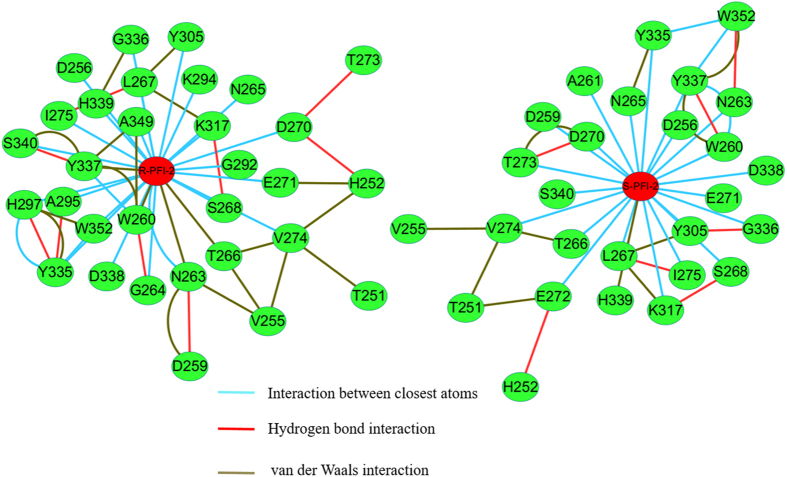
Exploration and analysis of the residues and their ligand interaction network are crucial for understanding protein structure-function relationships62,63,64. Recent studies indicate that exploration and analysis of the network of interacting residues can provide additional insights into the structural and role of residues65,66,67. To explore the binding mechanism of the two ligands with SETD7, we analyzed the information about RIN and the features of the network topologies. In order to clearly explore the interaction between the key residues in the binding site and the ligand, the residues within 5 Å of the ligand were used to generate the representative RIN. In Fig. 5, different types of non-covalent residue interactions including interatomic contacts, hydrogen bonds, and van der Waals overlaps were displayed. The residues W260, L267, Y337 and H339 located in the SETD7 active site could be easily identified as the nodes with the highest number of connections (node degree) in the RIN. (R)-PFI-2 has more connections with its neighboring residues than that of (S)-PFI-2 and connects with the residues N263, T266 and Y337 through van der Waals interaction. (S)-PFI-2 only has the van der Waals interaction with the residue L267. This may explained why the inhibitory potency of (R)-PFI-2 against SETD7 is better than that of (S)-PFI-2.
Figure 5.
RIN of the (R)-PFI-2 (A) and (S)-PFI-2(B) binding to the SETD7.
PMF calculations and the details of the two ligands dissociation from the SETD7 binding pocket by ABF simulation
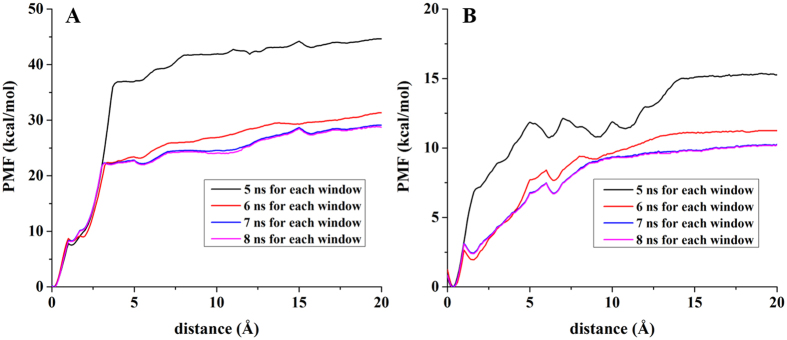
The calculated PMF profiles for (S)-PFI-2/SETD7 and (R)-PFI-2/SETD7 complexes are depicted in Fig. 6. In order to guarantee the convergence of the PMF profiles, we performed the simulation with different times for each window68. PMF profiles reach convergent when the simulation time was 8 ns for each window. The free energy curve reveals the information about unbinding of the two ligands. With the departure of the inhibitor from the initial equilibrium position, the free energy value rapidly increases. As can be seen from Fig. 6(A), the initial position of the (R)-PFI-2 is in the most stable binding state of the SETD7. Conversely, in Fig. 6(B), with lower distance, the energy curve sharply decreases. The free energy value rapidly increases with the departure of the inhibitor from the equilibrium position. The free energy barrier (the PMF depth, ΔGPMF,lowest − ΔGPMF,highest) of the inhibitor (R)-PFI-2 unbinding from the SETD7 binding site is around −28.40 kcal mol−1 and that of the inhibitor (S)-PFI-2 is around −10.08 kcal mol−1. Thus, (R)-PFI-2 needs to overcome a higher energy barrier than (S)-PFI-2 to escape from the SETD7 binding site.
Figure 6. The PMF profiles of the two complexes calculated by ABF. Left: (R)-PFI-2/SETD7 complex; Right: (S)-PFI-2/SETD7 complex.
The results show that the PMF is convergent with 8 ns simulation time for each window.
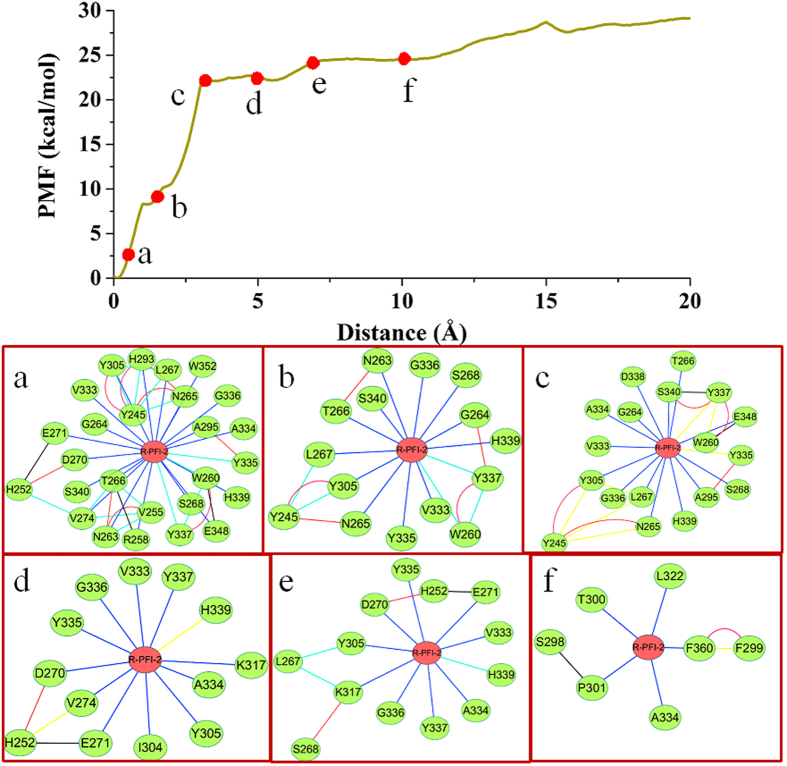
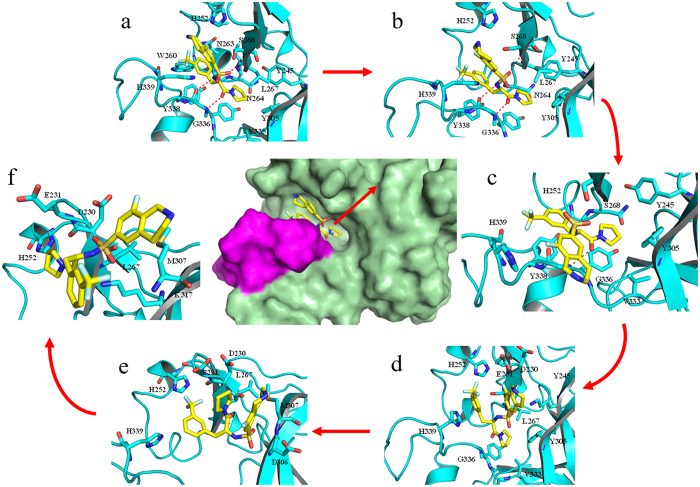
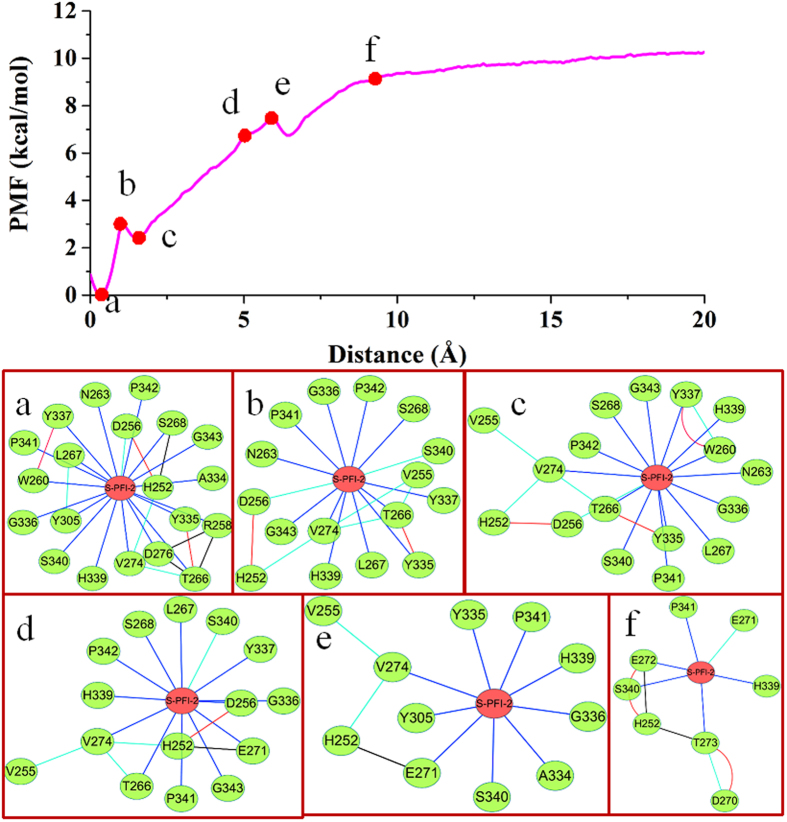
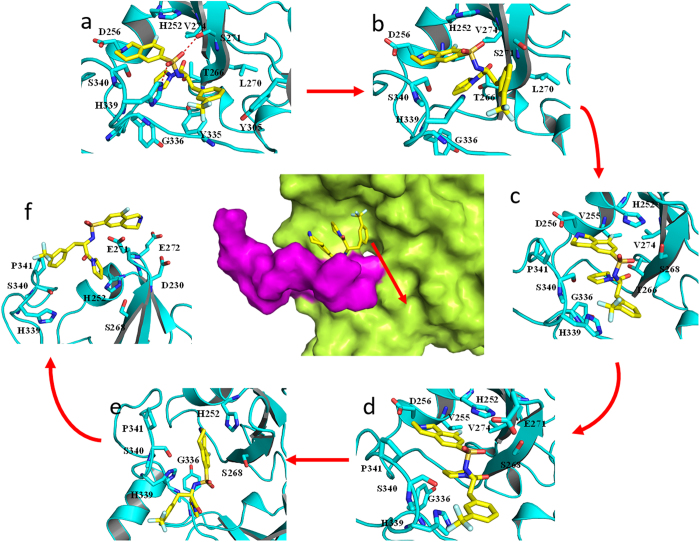
The above PMF calculation provides important information on energy changes during the unbinding process of the ligand. To explore the atomic essence underlying the energy changes, we carefully investigated the ABF simulation trajectories of the dissociation of the two ligands (S)-PFI-2 and (R)-PFI-2 from SETD7. As shown in Figs 7 and 8, at the beginning the (R)-PFI-2 is the binding site of the SETD7, and the PMF increases until ~3 Å, at this process the system first break up the intramolecular π-stacking interaction between the phenyl group and the droisoquinoline core of the ligand (Figs 7A–C and 8A–C). After ~3 Å, the PMF profile slowly increases and at ~10 Å, the PMF profile shows equilibrium. We could see that the (R)-PFI-2 mainly overcome polar interaction after ~10 Å from Fig. 8D–F.
Figure 7. The RIN change of (R)-PFI-2/SETD7 complex along the reaction coordinate in the SETD7 protein.
Top: the PMF profile change along the reaction coordinate. Bottom: The corresponding representative RIN of the (R)-PFI-2/SETD7.
Figure 8. The conformational changes of (R)-PFI-2 along the reaction coordinate.
It is different for (S)-PFI-2 unbinding from the SETD7 active site, at first the PMF profile decreases (Figs 9A and 10A), and then it increased as the ligand (S)-PFI-2 departure from the SETD7 active site. The PMF profile reaches equilibrium at ~10 Å. The Fig. 10A shows that the reason why the PMF profile decreases at the beginning, is that the stable interaction of the (S)-PFI-2 and the SETD7 due to the post-SET loop movement. As a result, the (R)-PFI-2 and (S)-PFI-2 dissociate from the SETD7 active site along the different reaction coordinate.
Figure 9. The RIN change of (S)-PFI-2/SETD7 complex along the reaction coordinate in the SETD7 protein.
Top: the PMF profile change along the reaction coordinate. Bottom: The corresponding representative RIN of the (S)-PFI-2/SETD7.
Figure 10. The conformational changes of the (S)-PFI-2 along the reaction coordinate.
Conclusions
In this work, a computational study combining MD simulation, MM/GBSA calculations and ABF simulation were applied to gain insights into the inhibitory activity differences between two PFI-2 enantiomers against SETD7. The calculated binding free energies predicted by MM/GBSA are in good agreement with the experimental values. The binding free energy decomposition reveals that the binding difference between (R)-PFI-2 and (S)-PFI-2 to SETD7 is mainly from the residues H252, D256, L267, Y335, G336 and H339. RIN analysis illustrates that (R)-PFI-2 has more connections with its neighboring residues than that of (S)-PFI-2. (R)-PFI-2 has van der Waals interaction with the residues N263, T266 and Y337, while (S)-PFI-2 only has the van der Waals interaction with the residue L267.
Analyzing the conformation change of (R)-PFI-2/SETD7 and (S)-PFI-2/SETD7 reveals that the post-SETD7 loop is different in the two complexes. The post-SET7 loop makes the ligand (S)-PFI-2 more exposed to the solvent. Results from residue interaction network analysis in ABF trajectories of the two ligands unbinding from the active site show that (S)-PFI-2 and (R)-PFI-2 have different reaction coordinates. Our computational results clarify why the inhibitory activity of (R)-PFI-2 is better than that of its enantiomer (S)-PFI-2. The results will be helpful to design more potent SETD7 inhibitors. The inhibitors targeting SETD7 should have interactions with the residues H252, L267, G336 and H339, and H-bond between the residues L267, G336.
Additional Information
How to cite this article: Niu, Y. et al. Revealing inhibition difference between PFI-2 enantiomers against SETD7 by molecular dynamics simulations, binding free energy calculations and unbinding pathway analysis. Sci. Rep. 7, 46547; doi: 10.1038/srep46547 (2017).
Publisher's note: Springer Nature remains neutral with regard to jurisdictional claims in published maps and institutional affiliations.
Acknowledgments
This work was supported by the National Natural Science Foundation of China (Grant No. 21475054), the Fundamental Research Funds for the Central Universities (Grant No. lzujbky-2014-191).
Footnotes
The authors declare no competing financial interests.
Author Contributions Y. N. and X. Y. conceived the project. Y. N., H. L., and X. Y. designed the experiment. Y. N., D. S., L. L., J.G. carried out the research and analysis of data. Y. N., H. L., and X. Y. wrote the paper.
References
- Keating S. T. & El-Osta A. Transcriptional regulation by the Set7 lysine methyltransferase. Epigenetics 8, 361–372 (2013). [DOI] [PMC free article] [PubMed] [Google Scholar]
- Deering T. G., Ogihara T., Trace A. P., Maier B. & Mirmira R. G. Methyltransferase Set7/9 maintains transcription and euchromatin structure at islet-enriched genes. Diabetes 58, 185–193 (2009). [DOI] [PMC free article] [PubMed] [Google Scholar]
- Francis J., Chakrabarti S. K., Garmey J. C. & Mirmira R. G. Pdx-1 links histone H3-Lys-4 methylation to RNA polymerase II elongation during activation of insulin transcription. J. Biol. Chem. 280, 36244–36253 (2005). [DOI] [PMC free article] [PubMed] [Google Scholar]
- Carr S. M. & La Thangue N. B. Cell cycle control by a methylation-phosphorylation switch. Cell cycle 10, 733–734 (2011). [DOI] [PMC free article] [PubMed] [Google Scholar]
- Carr S. M., Munro S., Kessler B., Oppermann U. & La Thangue N. B. Interplay between lysine methylation and Cdk phosphorylation in growth control by the retinoblastoma protein. EMBO J. 30, 317–327 (2011). [DOI] [PMC free article] [PubMed] [Google Scholar]
- Munro S., Carr S. M. & La Thangue N. B. Diversity within the pRb pathway: is there a code of conduct? Oncogene 31, 4343–4352 (2012). [DOI] [PubMed] [Google Scholar]
- Tao Y. et al. The histone methyltransferase Set7/9 promotes myoblast differentiation and myofibril assembly. J. cell Biol. 194 (2011). [DOI] [PMC free article] [PubMed] [Google Scholar]
- Wang D. et al. Methylation of SUV39H1 by SET7/9 results in heterochromatin relaxation and genome instability. Proc. Natl. Acad. Sci. USA 110, 5516–5521 (2013). [DOI] [PMC free article] [PubMed] [Google Scholar]
- Esteve P. O. et al. Regulation of DNMT1 stability through SET7-mediated lysine methylation in mammalian cells. Proc. Natl. Acad. Sci. USA 106, 5076–5081 (2009). [DOI] [PMC free article] [PubMed] [Google Scholar]
- Wang J. et al. The lysine demethylase LSD1 (KDM1) is required for maintenance of global DNA methylation. Nat. Genet. 41, 125–129 (2009). [DOI] [PubMed] [Google Scholar]
- Paneni F. et al. Adverse epigenetic signatures by histone methyltransferase Set7 contribute to vascular dysfunction in patients with type 2 diabetes mellitus. Circ. Cardiovasc. Genet. 8, 150–158 (2015). [DOI] [PubMed] [Google Scholar]
- Mori S. et al. Development of novel bisubstrate-type inhibitors of histone methyltransferase SET7/9. Bioorg. Med. Chem. 18, 8158–8166 (2010). [DOI] [PubMed] [Google Scholar]
- Niwa H. et al. Structures of histone methyltransferase SET7/9 in complexes with adenosylmethionine derivatives. Acta. Crystallogr. D Biol. Crystallogr. 69, 595–602 (2013). [DOI] [PubMed] [Google Scholar]
- Dowden J., Hong W., Parry R. V., Pike R. A. & Ward S. G. Toward the development of potent and selective bisubstrate inhibitors of protein arginine methyltransferases. Bioorg. Med. Chem. Lett. 20, 2103–2105 (2010). [DOI] [PubMed] [Google Scholar]
- Bissinger E. M. et al. Acyl derivatives of p-aminosulfonamides and dapsone as new inhibitors of the arginine methyltransferase hPRMT1. Bioorg. Med. Chem. 19, 3717–3731 (2011). [DOI] [PubMed] [Google Scholar]
- Verma S. K. et al. Identification of Potent, Selective, Cell-Active Inhibitors of the Histone Lysine Methyltransferase EZH2. ACS Med. Chem. Lett. 3, 1091–1096 (2012). [DOI] [PMC free article] [PubMed] [Google Scholar]
- Kashyap S., Sandler J., Peters U., Martinez E. J. & Kapoor T. M. Using ‘biased-privileged’ scaffolds to identify lysine methyltransferase inhibitors. Bioorg. Med. Chem. 22, 2253–2260 (2014). [DOI] [PMC free article] [PubMed] [Google Scholar]
- Cheng D. et al. Novel 3,5-bis(bromohydroxybenzylidene)piperidin-4-ones as coactivator-associated arginine methyltransferase 1 inhibitors: enzyme selectivity and cellular activity. J. Med. Chem. 54, 4928–4932 (2011). [DOI] [PMC free article] [PubMed] [Google Scholar]
- Mai A. et al. Synthesis and biological validation of novel synthetic histone/protein methyltransferase inhibitors. Chem. Med. Chem. 2, 987–991 (2007). [DOI] [PubMed] [Google Scholar]
- Barsyte-Lovejoy D. et al. (R)-PFI-2 is a potent and selective inhibitor of SETD7 methyltransferase activity in cells. Proc. Natl. Acad. Sci. USA 111, 12853–12858 (2014). [DOI] [PMC free article] [PubMed] [Google Scholar]
- Bea I., Gotsev M. G., Ivanov P. M., Jaime C. & Kollman P. A. Chelate effect in cyclodextrin dimers: A computational (MD, MM/PBSA, and MM/GBSA) study. J. Org. Chem. 71, 2056–2063 (2006). [DOI] [PubMed] [Google Scholar]
- Lyne P. D., Lamb M. L. & Saeh J. C. Accurate prediction of the relative potencies of members of a series of kinase inhibitors using molecular docking and MM-GBSA scoring. J. Med. Chem. 49, 4805–4808 (2006). [DOI] [PubMed] [Google Scholar]
- Zoete V., Meuwly M. & Karplus M. Study of the insulin dimerization: Binding free energy calculations and per-residue free energy decomposition. Proteins: Struct. Funct. Bioinf. 61, 79–93 (2005). [DOI] [PubMed] [Google Scholar]
- Zoete V. & Michielin O. Comparison between computational alanine scanning and per-residue binding free energy decomposition for protein-protein association using MM-GBSA: Application to the TCR-p-MHC complex. Proteins: Struct. Funct. Bioinf. 67, 1026–1047 (2007). [DOI] [PubMed] [Google Scholar]
- Darve E., Rodriguez-Gomez D. & Pohorille A. Adaptive biasing force method for scalar and vector free energy calculations. J. Chem. Phys. 128 (2008). [DOI] [PubMed] [Google Scholar]
- Henin J. & Chipot C. Overcoming free energy barriers using unconstrained molecular dynamics simulations. J. Chem. Phys. 121, 2904–2914 (2004). [DOI] [PubMed] [Google Scholar]
- Discovery Studio. version 2.5.5; Accelrys, Inc.: San Diego, CA (2010).
- prime. version 2.0, Schrödinger, LLC, New York (2008).
- Cieplak P., Cornell W. D., Bayly C. & Kollman P. A. Application of the multimolecule and multiconformational RESP methodology to biopolymers: Charge derivation for DNA, RNA, and proteins. J. Comput. Chem. 16, 1357–1377 (1995). [Google Scholar]
- Bayly C. I., Cieplak P., Cornell W. & Kollman P. A. A well-behaved electrostatic potential based method using charge restraints for deriving atomic charges: the RESP model. J. Phys. Chem. 97, 10269–10280 (1993). [Google Scholar]
- Fox T. & Kollman P. A. Application of the RESP Methodology in the Parametrization of Organic Solvents. J. Phys. Chem. 102, 8070–8079 (1998). [Google Scholar]
- Lindorff‐Larsen K. et al. Improved side‐chain torsion potentials for the Amber ff99SB protein force field. Proteins: Struct. Funct. Bioinf. 78, 1950–1958 (2010). [DOI] [PMC free article] [PubMed] [Google Scholar]
- Wang J., Wolf R. M., Caldwell J. W., Kollman P. A. & Case D. A. Development and testing of a general amber force field. J. Comput. Chem. 25, 1157–1174 (2004). [DOI] [PubMed] [Google Scholar]
- Jorgensen W. L., Chandrasekhar J., Madura J. D., Impey R. W. & Klein M. L. Comparison of simple potential functions for simulating liquid water. J. Chem. Phys. 79, 926–935 (1983). [Google Scholar]
- Phillips J. C. et al. Scalable molecular dynamics with NAMD. J. Comput. Chem. 26, 1781–1802 (2005). [DOI] [PMC free article] [PubMed] [Google Scholar]
- Ryckaert J.-P., Ciccotti G. & Berendsen H. J. C. Numerical integration of the cartesian equations of motion of a system with constraints: molecular dynamics of n-alkanes. J. Comput. Phys. 23, 327–341 (1977). [Google Scholar]
- Darden T., York D. & Pedersen L. Particle mesh Ewald: An N⋅log(N) method for Ewald sums in large systems. J. Chem. Phys. 98, 10089–10092 (1993). [Google Scholar]
- Mezei M. The finite difference thermodynamic integration, tested on calculating the hydration free energy difference between acetone and dimethylamine in water. J. Chem. Phys. 86, 7084–7088 (1987). [Google Scholar]
- Straatsma T. P. & Berendsen H. J. C. Free energy of ionic hydration: Analysis of a thermodynamic integration technique to evaluate free energy differences by molecular dynamics simulations. J. Chem. Phys. 89, 5876–5886 (1988). [Google Scholar]
- van Gunsteren W. F. & Berendsen H. J. Thermodynamic cycle integration by computer simulation as a tool for obtaining free energy differences in molecular chemistry. J. Comput. Aided. Mol. Des. 1, 171–176 (1987). [DOI] [PubMed] [Google Scholar]
- Rao S. N., Singh U. C., Bash P. A. & Kollman P. A. free-energy perturbation calculations on binding and catalysis after mutating Asn-155 in subtilisin. Nature 328, 551–554 (1987). [DOI] [PubMed] [Google Scholar]
- Hou T., Li N., Li Y. & Wang W. Characterization of domain-peptide interaction interface: prediction of SH3 domain-mediated protein-protein interaction network in yeast by generic structure-based models. J. Proteome Res. 11, 2982–2995 (2012). [DOI] [PMC free article] [PubMed] [Google Scholar]
- Sun H., Li Y., Shen M., Tian S., Xu L., Pan P., Guan Y. & Hou T. Assessing the performance of MM/PBSA and MM/GBSA methods. 5. Improved docking performance using high solute dielectric constant MM/GBSA and MM/PBSA rescoring. Phys. Chem. Chem. Phys. 16, 22035–22045 (2014). [DOI] [PubMed] [Google Scholar]
- Sun H., Li Y., Tian S., Xu L. & Hou T. Assessing the performance of MM/PBSA and MM/GBSA methods. 4. Accuracies of MM/PBSA and MM/GBSA methodologies evaluated by various simulation protocols using PDBbind data set. Phys. Chem. Chem. Phys. 16, 16719–16729 (2014). [DOI] [PubMed] [Google Scholar]
- Xu L., Sun H., Li Y., Wang J. & Hou T. Assessing the performance of MM/PBSA and MM/GBSA methods. 3. The impact of force fields and ligand charge models. J. Phys. Chem. B 117, 8408–8421 (2013). [DOI] [PubMed] [Google Scholar]
- Onufriev A., Bashford D. & Case D. A. Exploring protein native states and large-scale conformational changes with a modified generalized born model. Proteins: Struct. Funct. Bioinf. 55, 383–394 (2004). [DOI] [PubMed] [Google Scholar]
- Levitt M., Sander C. & Stern P. S. protein normal-mode dynamics trypsin inhibitor, crambin, ribonuclease and lysozyme. J. Mol. Biol. 181, 423–447 (1985). [DOI] [PubMed] [Google Scholar]
- Case D. A. et al. The Amber biomolecular simulation programs. J.Comput. Chem. 26, 1668–1688 (2005). [DOI] [PMC free article] [PubMed] [Google Scholar]
- Piovesan D., Minervini G. & Tosatto S. C. The RING 2.0 web server for high quality residue interaction networks. Nucleic Acids Resd. (2016). [DOI] [PMC free article] [PubMed] [Google Scholar]
- Shannon P. et al. Cytoscape: a software environment for integrated models of biomolecular interaction networks. Genome Res. 13, 2498–2504 (2003). [DOI] [PMC free article] [PubMed] [Google Scholar]
- Faller C. E., Reilly K. A., Hills R. D. Jr. & Guvench O. Peptide Backbone Sampling Convergence with the Adaptive Biasing Force Algorithm. J. Phys. Chem. B 117, 518–526 (2013). [DOI] [PMC free article] [PubMed] [Google Scholar]
- Comer J., Phillips J. C., Schulten K. & Chipot C. Multiple-Replica Strategies for Free-Energy Calculations in NAMD: Multiple-Walker Adaptive Biasing Force and Walker Selection Rules. J. Chem. Theory Comput. 10, 5276–5285 (2014). [DOI] [PubMed] [Google Scholar]
- Niu Y. et al. (2015) Influence of Chirality of Crizotinib on Its MTH1 Protein Inhibitory Activity: Insight from Molecular Dynamics Simulations and Binding Free Energy Calculations. PloS one 10, e0145219 (2015). [DOI] [PMC free article] [PubMed] [Google Scholar]
- Niu Y., Pan D., Yang Y., Liu H. & Yao X. (2016) Revealing the molecular mechanism of different residence times of ERK2 inhibitors via binding free energy calculation and unbinding pathway analysis. Chemometrics and Intelligent Laboratory Systems 158, 91–101 (2016). [Google Scholar]
- Kollman P. A. et al. Calculating structures and free energies of complex molecules: Combining molecular mechanics and continuum models. Acc. Chem. Res. 33, 889–897 (2000). [DOI] [PubMed] [Google Scholar]
- Xue W. et al. Identification of the inhibitory mechanism of FDA approved selective serotonin reuptake inhibitors: an insight from molecular dynamics simulation study. Phys. Chem. Chem. Phys. 18, 3260–3271 (2016). [DOI] [PubMed] [Google Scholar]
- Lee T. V., Johnson R. D., Arcus V. L. & Lott J. S. Prediction of the substrate for nonribosomal peptide synthetase (NRPS) adenylation domains by virtual screening. Proteins: Struct. Funct. Bioinf. 83, 2052–2066 (2015). [DOI] [PubMed] [Google Scholar]
- Niu Y., Li S., Pan D., Liu H. & Yao X. Computational study on the unbinding pathways of B-RAF inhibitors and its implication for the difference of residence time: insight from random acceleration and steered molecular dynamics simulations. Phys. Chem. Chem. Phys. 18(7), 5622 (2016). [DOI] [PubMed] [Google Scholar]
- Genheden S. & Ryde U. The MM/PBSA and MM/GBSA methods to estimate ligand-binding affinities. Expert Opin. Drug. Discov. 10, 449–461 (2015). [DOI] [PMC free article] [PubMed] [Google Scholar]
- Pan D., Xue W., Zhang W., Liu H. & Yao X. Understanding the drug resistance mechanism of hepatitis C virus NS3/4A to ITMN-191 due to R155K, A156V, D168A/E mutations: A computational study. Chemom. Intell. Lab. Syst. 1820, 1526–1534 (2012). [DOI] [PubMed] [Google Scholar]
- Pan D. et al. Computational study on the drug resistance mechanism of hepatitis C virus NS5B RNA-dependent RNA polymerase mutants to BMS-791325 by molecular dynamics simulation and binding free energy calculations. Chemom. Intell. Lab. Syst. 154, 185–193 (2016). [Google Scholar]
- Csermely P. Creative elements: network-based predictions of active centres in proteins and cellular and social networks. Trends Biochem. Sci. 33, 569–576 (2008). [DOI] [PubMed] [Google Scholar]
- Vishveshwara S., Ghosh A. & Hansia P. Intra and inter-molecular communications through protein structure network. Curr. Protein Pept. Sci. 10, 146–160 (2009). [DOI] [PubMed] [Google Scholar]
- Welsch C. et al. Ketoamide resistance and hepatitis C virus fitness in val55 variants of the NS3 serine protease. Antimicrob. Agents. Chemother. 56, 1907–1915 (2012). [DOI] [PMC free article] [PubMed] [Google Scholar]
- Xue W., Ban Y., Liu H. & Yao X. Computational Study on the Drug Resistance Mechanism against HCV NS3/4A Protease Inhibitors Vaniprevir and MK-5172 by the Combination Use of Molecular Dynamics Simulation, Residue Interaction Network, and Substrate Envelope Analysis. J.Chem. Inf. Model. 54, 621–633 (2014). [DOI] [PubMed] [Google Scholar]
- Xue W. et al. Exploring the Molecular Mechanism of Cross-Resistance to HIV-1 Integrase Strand Transfer Inhibitors by Molecular Dynamics Simulation and Residue Interaction Network Analysis. J. Chem.Inf. Model. 53, 210–222 (2013). [DOI] [PubMed] [Google Scholar]
- Welsch C. et al. Ketoamide Resistance and Hepatitis C Virus Fitness in Val55 Variants of the NS3 Serine Protease. Antimicrob. Agents. Chemother. 56, 1907–1915 (2012). [DOI] [PMC free article] [PubMed] [Google Scholar]
- Lelievre T., Rousset M. & Stoltz G. Long-time convergence of an adaptive biasing force method. Nonlinearity 21, 1155–1181 (2008). [Google Scholar]


