

ABSTRACT
Many organs form by invaginating and rolling flat epithelial cell sheets into tubes. Invagination of the ventral midline of the neural plate forms the median hinge point (MHP), an event that elevates the neural folds and is essential for neural tube closure (NTC). MHP formation involves dynamic spatiotemporal modulations of cell shape, but how these are achieved is not understood. Here, we show that cell-cycle-dependent BMP and TGFβ antagonism elicits MHP formation by dynamically regulating interactions between apical (PAR complex) and basolateral (LGL) polarity proteins. TGFβ and BMP-activated receptor (r)-SMADs [phosphorylated SMAD2 or SMAD3 (pSMAD2,3), or phosphorylated SMAD1, SMAD5 or SMAD8 (pSMAD1,5,8)] undergo cell-cycle-dependent modulations and nucleo-cytosolic shuttling along the apicobasal axis of the neural plate. Non-canonical TGFβ and BMP activity in the cytosol determines whether pSMAD2,3 or pSMAD1,5,8 associates with the tight junction (PAR complex) or with LGL, and whether cell shape changes can occur at the MHP. Thus, the interactions of BMP and TGFβ with polarity proteins dynamically modulate MHP formation by regulating r-SMAD competition for tight junctions and r-SMAD sequestration by LGL.
KEY WORDS: Apicobasal polarity, Hinge point, LGL, Midbrain, Neural tube closure defects, Organogenesis, PAR3
Summary: By modulating tight junctions, cell-cycle-dependent interactions among the TGFβ, BMP and apicobasal polarity pathways create a dynamic neural epithelium that can be shaped to form a closed neural tube.
INTRODUCTION
Many tubular organs develop from flat epithelial sheets that are invaginated and rolled to form closed tubes (Andrew and Ewald, 2010; Martin-Belmonte et al., 2008; Pilot and Lecuit, 2005). Invagination of the ventral midline of the neural plate leads to the formation of the median hinge point (MHP), a dynamic event which elevates the neural folds, ultimately facilitating their apposition and fusion at the dorsal midline (Colas and Schoenwolf, 2001; Eom et al., 2013; Ybot-Gonzalez et al., 2007). Neural tube closure (NTC) defects (e.g. exencephaly, spina bifida) result in the brain and spinal cord when hinge points do not form correctly (Copp and Greene, 2013; Eom et al., 2013; Ybot-Gonzalez et al., 2007).
Although invagination events are fundamental to the generation of tubular organs, the cellular and molecular mechanisms underlying their formation are not well understood (Lecuit and Lenne, 2007). As with other invagination events, MHP formation requires dynamic and polarized changes in cell shape, which can be induced by cytoskeletal reorganization, polarized endocytosis, cell cycle kinetics or a combination of these behaviors (Colas and Schoenwolf, 2001; Eom et al., 2013; Lee and Harland, 2010; Nishimura et al., 2012; Suzuki et al., 2012). Recent studies suggest that cell-shape changes at the MHP can also result from junctional remodeling, which occurs in the planar axis during convergent extension, as it narrows and elongates the neural plate (Eom et al., 2013; Nishimura et al., 2012). However, many polarized cell behaviors involved in MHP formation (apical constriction, basal nuclear translocation, changes in apicobasal length), occur along the apicobasal axis and a role for the apicobasal polarity pathway in MHP formation and NTC has recently begun to emerge (Eom et al., 2013; Klezovitch et al., 2004; Lee and Harland, 2010).
The apicobasal polarity pathway establishes tight junctions and segregates the apical and basolateral compartments of epithelial cells (Margolis and Borg, 2005). This segregation is mediated in part by apical polarity proteins such as the PAR [PAR3–atypical protein kinase C (aPKC)–PAR6] and the Crumbs (Crumbs–PATJ–Stardust) complexes. These associate with, and maintain tight junction integrity by excluding basolateral proteins such as Lethal giant larva (LGL), Disks large and Scribble from the apical compartment (Bilder, 2004; Yamanaka et al., 2006, 2003). Although this segregation is important for the maintenance of a stable epithelium, tissues undergoing three-dimensional shape changes require modulations of the apicobasal polarity pathway to create a flexible and dynamic epithelium (Andrew and Ewald, 2010; Eom et al., 2012, 2011; Martin-Belmonte et al., 2008; Mostov et al., 2003).
An interesting and unresolved question is how dynamic modulations of the apicobasal polarity pathway are achieved in vivo, and how this pathway intersects with the signaling cascades (e.g. SHH, BMP, WNT) that govern early tissue specification and morphogenesis. In this study, we have explored the interactions between the apicobasal polarity pathway and the TGFβ and BMP signaling cascades in the amniote midbrain. Mutant mice with defective BMP or TGFβ signaling (Bmp2+/−, Bmp5−/−, Bmp7−/−, Smad5−/−, Nog−/−, Rgma−/−, Tgif1−/−, Ski−/−) frequently display cranial NTC defects, which cannot be attributed to defects in cell fate specification alone (Castranio and Mishina, 2009; Chang et al., 1999; McMahon et al., 1998; Solloway and Robertson, 1999; Berk et al., 1997; Harris and Juriloff, 2010; Kuang et al., 2006; Niederkofler et al., 2004). Instead, evidence from diverse systems has begun to accumulate suggesting that TGFβ and BMP signaling directs tissue shape, size and three-dimensional morphogenesis by regulating epithelial organization (Eom et al., 2012, 2011; Gibson and Perrimon, 2005; von der Hardt et al., 2007; Shen and Dahmann, 2005; Zavadil and Böttinger, 2005).
We have recently shown that BMP signaling maintains the stability of the neural epithelium by regulating biochemical interactions between phosphorylated SMAD1, SMAD5 or SMAD8 (pSMAD1,5,8) and the PAR polarity protein complex. BMP attenuation reduces these interactions and is required for the induction of cell-shape changes at the MHP (Eom et al., 2011). Sustained BMP blockade can disrupt epithelial organization and induce epithelial-to-mesenchymal transitions (EMTs) in diverse systems (Gibson and Perrimon, 2003; Shen and Dahmann, 2005). However, MHP induction by low BMP signaling at the ventral midline of the neural plate is not accompanied by overt epithelial disorganization. Instead, polarity is modulated along the apicobasal axis by graded pSMAD1,5,8 activity, with neural progenitors cycling between high and low BMP states as they progress through the cell cycle while undergoing interknetic nuclear migration (Eom et al., 2011, 2013; Sauer, 1935). Such a cyclic BMP signal could potentially mediate the cell-shape changes required for NTC without disrupting epithelial organization, but how is such a complex and cell-cycle-dependent BMP profile established?
In this study, we show that a cell-cycle-dependent TGFβ signal modulates BMP activity along the apicobasal axis of the neural plate. BMP–TGFβ antagonism determines whether pSMAD1,5,8 or TGFβ-activated receptor (r)-SMADs (phosphorylated SMAD2 or SMAD3, pSMAD2,3) associate with the PAR complex at apical junctions. We report for the first time that BMP and TGFβ ligands also modulate pSMAD interactions with lethal giant larva (LGL), a basolateral antagonist of PAR3 (Bilder, 2004; Dollar et al., 2005; Plant et al., 2003). pSMAD interactions with polarity proteins occur in the cytosol, are non-canonical and form the molecular bases for creating a dynamic epithelium capable of three-dimensional tissue morphogenesis. Our results provide a novel paradigm for establishing periodic morphogen gradients that are modulated spatially and temporally, and could underlie the formation of repeated tissue patterns (e.g. somites, rhombomeres). They show that antagonistic BMP and TGFβ signals dynamically modulate the neural epithelium by regulating r-SMAD competition for tight junctions and their sequestration in the cytosol by LGL.
RESULTS
Cell-cycle-dependent nucleo-cytoplasmic shuttling of pSMAD proteins
During NTC, high levels of pSMAD2,3 were seen across the mediolateral axis of the neural plate, including the MHP (Fig. S1A; Fig. 1A). This was in contrast to the mediolaterally modulated expression of pSMAD1,5,8, which was low at the MHP and high in lateral neural plate (Fig. S1B,B′) (Eom et al., 2011). The MHP is thus marked by high pSMAD2,3 and low pSMAD1,5,8 expression (Fig. S1A′,B′).
Fig. 1.

Cell-cycle-dependent modulation and nucleo-cytoplasmic shuttling of pSMAD2,3 and pSMAD1,5,8. (A,C) Low-power hemi-sections of HH7 neural plates showing pSMAD2,3 (A) and pSMAD1,5,8 modulation (C) along the apicobasal (a↔b) axis. Blue arrowhead, ventral midline. The location of pHH3+ mitotic (m) cells and interphase (i) nuclei is indicated. Boxed areas in A,C include the MHP and are magnified in B–B″ and D–D″, respectively. The scale bar for A and C is shown in A. The lateral neural plate region demarcated by the blue brackets is magnified in Fig. S1. (B–B″) Colabeling of pSMAD2,3 with pHH3 (B′) and DAPI (B″) shows that pSMAD2,3 expression is high and nuclear during interphase (yellow arrowheads), and low and cytosolic during mitosis (white arrowheads). (D–D″) pSMAD1,5,8 expression is low and nuclear during interphase (yellow arrowheads), and high and ubiquitous (chromatin-associated and cytosolic) during mitosis (white arrowheads). The scale bar for B–B″ and D–D″ is shown in B″. (E,G) Low-power hemi-sections of HH6 neural plates showing colabeling of pSMAD2,3 (E) and pSMAD1,5,8 (G) with acetylated tubulin. Boxed areas in E,G (MHP) are magnified in F–F″ and H–H″, respectively. Blue arrowhead, ventral midline. The scale bar for E and G is shown in E. (F–F″) DAPI, pSMAD2,3 and acetylated tubulin colabeling demonstrate that pSMAD2,3 expression is predominantly nuclear during interphase (yellow arrowhead, inset i in F″) and both chromatin-associated and cytosolic during mitosis (white arrowhead, inset m in F″). (H–H″) DAPI, acetylated tubulin and pSMAD1,5,8 colabeling demonstrate that pSMAD1,5,8 expression is nuclear during interphase (yellow arrowhead, inset i in H″), and both chromatin-associated and cytosolic during mitosis (white arrowhead, inset m in H″). The scale bar for F–F″ and H–H″ is shown in F. (I,J) Quantification of pSMAD fluorescence at the HH6–HH7 MHP; data are presented as mean±s.e.m.; n=35 cells from six brains. pSMAD2,3 (I) and pSMAD1,5,8 (J) fluorescence in the nucleus and cytoplasm of interphase and mitotic cells was compared using the Mann–Whitney test as follows: (1) pSMAD2,3 at mitosis, cytosolic versus chromatin-associated: 4.83×10⁴±9.25×10² versus 3.9×10⁴±5.56×10²; *P≤0.05); (2) pSMAD2,3 at interphase, cytosolic versus nuclear: 3.24×10⁴±1.33×10³ versus 1.44×10⁵±5.11×10²; ****P≤0.0001); (3) pSMAD1,5,8 at mitosis, cytosolic versus chromatin-associated: 1.81×10⁵±5.04×10³ versus 2.37×10⁵±1.59×10⁴; **P≤0.01); (4) pSMAD1,5,8 at interphase, cytosolic versus nuclear: 3.60x10⁴±1.33x10³ versus 1.01×10⁵±2.63×10², ****P≤0.0001). Other relevant comparisons are indicated in the text.
Neural progenitors undergo interkinetic nuclear migration, executing mitosis apically and interphase stages (G1, G2 and S) throughout the thickness (apicobasal axis) of the neural plate (Fig. 1A,C) (Eom et al., 2011; Nakajima et al., 2013; Sauer, 1935). pSMAD2,3 and pSMAD1,5,8 expression at the MHP was reciprocally modulated in a cell-cycle-dependent manner along this axis. Quantitative measurements of fluorescence intensity showed that high levels of pSMAD2,3 were present during interphase, with nearly twice as much pSMAD2,3 in interphase cells as in phosphorylated histone H3 (pHH3)+ mitotic cells (mitosis versus interphase: 4.37×10⁴±1.08×10⁴ versus 8.86×10⁴±5.75×10⁴; P≤0.001; Fig. 1A, yellow and white arrowheads; Fig. 1B–B″, Fig. 1I). By contrast, pSMAD1,5,8 expression was graded in the opposite direction, with 30.7× greater expression in mitotic cells in comparison to interphase cells (mitosis versus interphase: 2.03×10⁶±6.30×10⁴ versus 6.88×10⁴±3.36×10⁴; P≤0.0001; Fig. 1C, yellow and white arrowheads; Fig. 1D–D″, 1J). The overall (chromatin-associated plus cytosolic) levels of pSMAD1,5,8 were 4.7× higher during mitosis than pSMAD2,3 (pSMAD1,5,8 versus pSMAD 2,3: 2.09×10⁵±2.42×10³ versus 4.36×10⁴±4.15×10²; P≤0.0001). By contrast, the overall levels of pSMAD2,3 were 1.3× those of pSMAD1,5,8 during interphase (pSMAD 2,3 versus pSMAD 1,5,8: 8.85×10⁴±1.43×10³ versus 6.88×10⁴±8.41×10²: P<0.0001). This cell-cycle-dependent apicobasal modulation of pSMAD2,3 and pSMAD1,5,8 occurred at the MHP as well as the lateral neural plate, and was independent of mediolateral location (Fig. S1C–F′).
To determine their subcellular localization, we colabeled pSMAD proteins with markers of chromatin (DAPI), mitotic chromatin (pHH3) and the cytosol (acetylated tubulin). Given that acetylated-tubulin was predominantly distributed along the cell cortex, we additionally used the absence of DAPI or pHH3 staining to determine the cytosolic distribution of pSMAD proteins. These data demonstrate that, during interphase, pSMAD expression was mainly nuclear, with 1.44× higher levels of pSMAD2,3, relative to pSMAD1,5,8 (pSMAD1,5,8 versus pSMAD2,3: 1.45×10⁵±1.02×10⁴ versus 1.01×10⁵±5.26×10³; P≤0.0001; yellow arrowheads, Fig. 1B–H″; interphase insets labeled i, Fig. 1F″,H″,I,J; Fig. S1C–F′). By contrast, significant pools of pSMAD proteins were detected in the cytosol during mitosis, although there was 3.7× as much pSMAD1,5,8 as pSMAD2,3 (pSMAD 1,5,8 versus pSMAD 2,3: 1.81×10⁵±6.29×10⁴ versus 4.83×10⁴±1.15×10⁴; P≤0.0001; white arrowheads, Fig. 1A–H″; insets labeled m, Fig. 1F″,″,I,J; Fig. S1C–F′).
It should be noted that relatively low levels of pSMAD2,3 and high levels of pSMAD1,5,8 also colocalized with the pHH3+ mitotic chromatin (white arrowheads, Fig. 1A–H″; insets labeled m, Fig. 1F″,H″; Fig. S1C–F′) (Eom et al., 2011). However, given that mitotic cells are thought to be transcriptionally silent, the functionally relevant pools of pSMAD during this cell cycle phase are likely to be cytosolic (chromatin-independent) as we show below (Caravaca et al., 2013; Michelotti et al., 1997). Taken together, these results suggest that although pSMAD1,5,8 and pSMAD2,3 are modulated in opposite directions in tandem with the cell cycle, pools of pSMAD2,3 and pSMAD1,5,8 are detected in the cytosol during mitosis and are shuttled into the nucleus during interphase.
The opposite effects of BMP and TGFβ signaling in hinge point induction
TGFβ signaling is necessary and sufficient for inducing the MHP
Cell cycle progression in the neural plate is asynchronous and results in a mosaic pattern of pSMAD1,5,8 expression. Together with the results presented in Fig. 1, this suggests that BMP activity at the MHP is low, cyclic and mosaic, features which are essential for MHP formation (Eom et al., 2011, 2012). But how is such a complex BMP profile established during NTC? Given the complementary modulation of pSMAD1,5,8 and pSMAD2,3 in the neural plate, we asked whether TGFβ and BMP signaling might cross-repress each other and affect MHP formation in opposite directions (Fig. 1; Fig. S1).
Unlike controls, constitutively active (ca) Smad2 misexpression at neural plate stages [Hamburger–Hamilton (HH) stage 4–5] induced ectopic hinge points in lateral neural plate when examined at 3 h to 2 days [embryonic day (E)1–E3] after electroporation (Fig. 2A–B″, data not shown). Conversely, TGFβ blockade achieved by Lefty2 misexpression at the ventral midline flattened the endogenous MHP, suggesting that TGFβ signaling is both necessary and sufficient for MHP formation (Fig. 2C–D″) (Schier, 2003; Shen, 2007). Together with previous work, these observations demonstrate that TGFβ and BMP signals regulate MHP formation in opposite directions (summarized in Fig. 2E–G) (Eom et al., 2011). Interestingly, ventral midline TGFβ manipulations, which disrupted MHP formation, also failed to elevate and/or fuse the neural folds and led to NTC defects in 24 out of 26 cases (Fig. S2A–D). These results stress the importance of TGFβ signaling in MHP formation, and the role of MHP formation in NTC.
Fig. 2.

TGFβ signaling induces MHP formation by suppressing BMP activity. (A–D) TGFβ misexpression is necessary and sufficient for MHP formation. (A–A″) EGFP electroporations (ep) at HH5 do not alter the apical contours of the lateral midbrain at HH7. The embryonic ages noted on all micrographs reflect the time points at which brains were examined. The boxed areas in the insets in A–D are magnified in adjacent panels. White and yellow dotted lines mark the apical and basal surfaces. Scale bars for A–B″ and C–D″ are shown in A″ and C″, respectively. (B–B″) caSmad2 misexpression (green) at HH5 induces ectopic hinge points in lateral midbrain (arrowhead). (C–C″) EGFP electroporations at HH5 showing the normal contours of the ventral midline (arrowhead). (D–D″) Lefty2 misexpression (green) at the ventral midline (white arrowhead) flattens the endogenous MHP. NC, notochord. (E–G) Cartoons depicting the opposite effects of TGFβ and BMP signaling on MHP induction. Black arrowheads, ventral midline; red arrowhead, ectopic hinge point. BMP data summarized from Eom et al., 2011. (H–K) Cross-inhibition of r-SMAD phosphorylation underlies TGFβ–BMP antagonism. Top panel, western blotting of electroporated whole-cell midbrain lysates. Electroporated DNA concentration (µg/µl) is indicated above each lane. Bottom panel, loading controls (α-tubulin). (H) Compared to EGFP controls, caSmad2 electroporations reduce, and Lefty2 and BMP4 electroporations increase pSMAD1,5,8 levels. (I) caSmad2 and Noggin electroporations increase, and Lefty2 and BMP4 reduce pSMAD2,3 levels. (J) The total levels of SMAD1 and SMAD2 proteins remain unchanged following BMP and TGFβ manipulations. (K) Cartoon illustrating that TGFβ and BMP phosphorylate their own r-SMADs, while inhibiting the phosphorylation of the r-SMADs from the other pathway.
Cross-repression between TGFβ and BMP signaling cascades
The opposite effects of BMP and TGFβ signaling on MHP formation led us to ask whether the two pathways cross-repressed each other. Western blot analyses of electroporated whole-cell lysates showed that caSmad2 misexpression reduced pSMAD1,5,8 levels, whereas Lefty2 and BMP4 misexpression increased it (Fig. 2H). Conversely, caSmad2 and Noggin misexpression increased pSMAD2,3 levels, whereas Lefty2 and BMP4 misexpression did the opposite (Fig. 2I). Given that these changes were not accompanied by reductions in total (phosphorylated and non-phosphorylated) SMAD levels, they are likely to represent a reduction in SMAD phosphorylation (Fig. 2J). Thus, BMP and TGFβ induce the phosphorylation of their own r-SMADs, while blocking the ability of the other pathway to do so (summarized in Fig. 2K) (Miyazono et al., 2010).
TGFβ signaling regulates cell shape and is a partial regulator of cell fates at the MHP
We next explored the cell behaviors regulated by TGFβ signaling during hinge point formation. Hinge point formation in the neural plate is known to involve apical constriction and the basal localization of cell nuclei (defined in Materials and Methods, Table 1) (Eom et al., 2011; Lee et al., 2007). Ectopic hinge points induced by caSmad2 misexpression displayed non-autonomous, basal nuclear localization (arrowhead, Fig. 3B′) either alone, or in conjunction with the apical constriction of mitotic cells (Figs 3A–D, 2A–B″, Table 1). Both phenotypes were identical to those displayed by the endogenous MHP and by ectopic hinges induced by BMP blockade (Eom et al., 2011).
Table 1.
Identification and quantification of ectopic hinge points
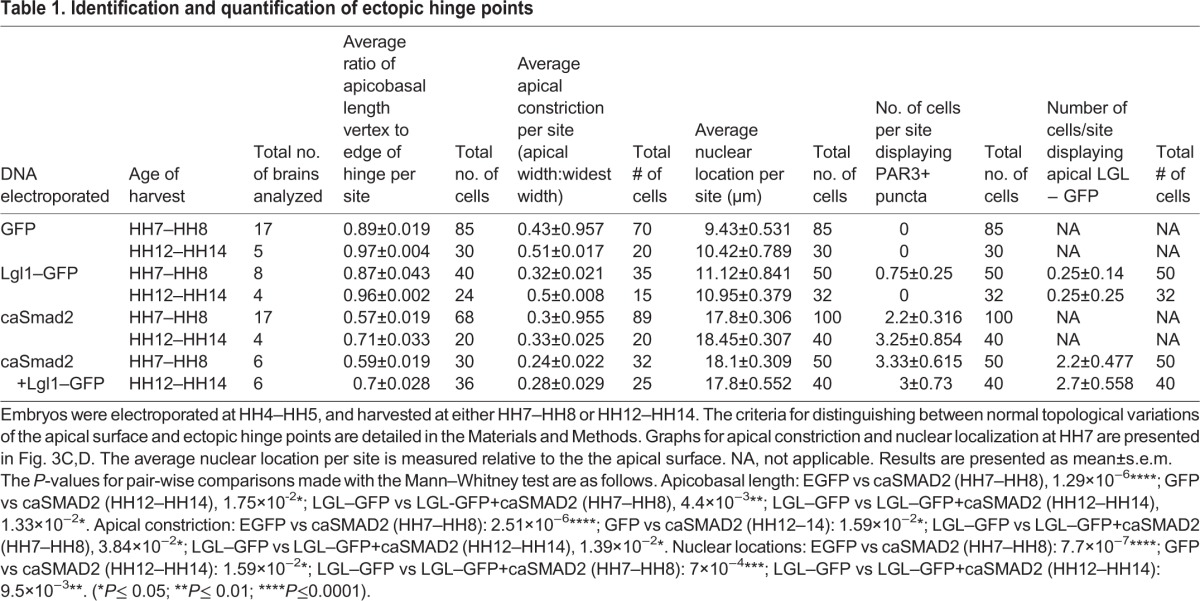
Fig. 3.

TGFβ signaling regulates cell shapes and fates at the MHP. (A–B‴) Compared to controls (A–A‴), caSmad2+mRFP electroporated mitotic cells (B–B‴) display basally located nuclei (arrowhead) and apical constriction, demonstrated by a reduced apical width (aw):widest width (ww) ratio (see Materials and Methods). The boxed area in A″ is magnified in A‴ and shows mitotic cells in cytokinesis (left) and metaphase (right) stages. Scale bar for A and B is shown in A, and for A‴ and B‴ in A‴. (C) Quantification of basal nuclear localization in HH7 brains. Data are presented as mean±s.e.m. Nuclear distances from the apical surface for control (9.43 µm, n=85 cells from 17 brains) and caSmad2 electroporated cells (17.8 µm, n=100 cells from 17 brains) are significantly different. ****P≤0.0001 (Mann–Whitney test). (D) Quantification of apical constriction in HH7 brains. Data are presented as mean±s.e.m. The apical width:widest width (aw/ww) ratio of control cells=0.43 (n=70 cells/17 brains) and caSmad2-electroplated cells=0.3 (n=89 cells/17 brains) are significantly different. ****P≤0.0001 (Mann–Whitney test). (E–F‴) Compared to controls (E–E‴), midbrains electroporated with caSmad2 at HH4–HH5 display ectopic hinge points (arrowhead, F–F‴) with robust FOXA2 expression. E′–E‴ and F′–F‴ are magnified views of the boxes in E and F, respectively. Scale bar for E and F is shown in F, and for E′–E‴ and F′–F‴ is shown in E‴. See also Fig. S2E–H‴.
To determine whether caSmad2 misexpression specifically induced the MHP or generic invaginations of the neural plate, we next determined whether caSmad2 manipulations also induced ventral midline cell fates at ectopic hinge points. Unlike controls, early (HH4–HH5) caSmad2 electropororations induced robust expression of FOXA2, an exclusive marker of the MHP and the future floor plate (Fig. 3E–F‴) (Bayly et al., 2012; Sasaki and Hogan, 1993). By contrast, late (HH8–HH9) caSmad2 electroporations failed to induce FOXA2 expression (data not shown). Finally, early or late caSmad2 electroporations did not induce ventral midline markers such as LMX1A or LMX1B, or SHH (Fig. S2E–H‴). Although TGFβ signaling is a partial and transient regulator of ventral midline cell fates, the robust induction of FOXA2 suggests that it specifically induces the MHP (Bayly et al., 2012). Interestingly, early or late stage BMP manipulations do not induce ventral midline cell fates (Eom et al., 2012, 2011). Thus, although BMP and TGFβ signaling regulate shape changes at the MHP in opposite directions, they do not affect ventral midline cell fate specification in a complementary manner.
TGFβ signaling directs MHP formation by regulating tight junction integrity
Given the apicobasal nature of TGFβ-induced cell behaviors (apical constriction, basal nuclear localization) at ectopic hinge points, we next asked whether TGFβ signaling interacted with apical (PAR3) and basolateral (LGL) polarity proteins during MHP formation. Because suitable LGL antibodies are unavailable, we visualized the apical and basolateral compartments in neural cells by combining PAR3 immunochemistry with non-phenotypic electroporations of Lgl1–GFP (1 µg/µl) (Eom et al., 2011). Such non-phenotypic Lgl1–GFP-electroporated controls displayed smooth apical contours and the complete segregation of apical (PAR3+) and basolateral (LGL1–GFP+) compartments (Fig. 4A–A″). By contrast, caSmad2 and Lgl1–GFP co-electroporations induced ectopic hinges accompanied by the loss of apical PAR3, the ectopic incursion of LGL1–GFP into the apical compartment, and PAR3 and LGL1–GFP overlap (arrowheads, Fig. 4C–C″; Table 1). We noted that when present, endosomes in control brains were not PAR3+ (yellow arrowheads, Fig. 4A–B′). By contrast, caSmad2 electroporations resulted in ectopic endosomes in the cytosol that were both PAR3+ and EEA1+ (Fig. 4C–D′). The removal of PAR3+ apical membranes into the cytosol through endocytosis might partially explain how apical constriction is accomplished by TGFβ signaling (Eom et al., 2011; Lee and Harland, 2010).
Fig. 4.

The TGFß signaling cascade interacts with the PAR polarity complex and regulates the subcellular localization of polarity proteins. (A–B′) Control electroporations (ep) with low, non-phenotypic (1 µg/µl) levels of Lgl1–GFP show a smooth PAR3+ apical contour and complete segregation between the apical (PAR3+) and the basolateral (LGL–GFP+) compartments. The inset in A″ is magnified in B,B′. Note the absence of PAR3 in EEA1+ endosomes (arrowheads) in B–B′. (C–D′) Co-electroporations of caSmad2 with low amounts of Lgl1–GFP result in ectopic hinge points (white arrowheads, C–C″) accompanied by the loss of apical PAR3, ectopic apical LGL–GFP and/or apical overlap between PAR3 and LGL–GFP. The inset in C″ is magnified in D,D′ and unlike controls (B,B′), shows colocalization of PAR3 with EEA1+ endosomes (yellow arrowheads, C″–D′). The scale bar for A–A″ and C–C″ is shown in C, and for B,B′ and D,D′ in B. (E–G′) Biochemical interactions between pSMAD2,3 and the PAR complex in EGFP-electroporated whole-cell lysates immunoprecipitated with anti-PAR3 (E), anti-PAR6 (F) and anti-aPKC (G) antibodies and immunoblotted with the anti-pSMAD2,3 antibody. The co-immunoprecipitations were reversed in E′–G′. (H,H′) Biochemical interactions between pSMAD2,3 and PAR3 in wild-type whole-cell lysates are weaker than those between pSMAD1,5,8 and PAR3. (I–I‴) Non-phenotypic PAR3–GFP electroporations followed by pSMAD2,3 immunohistochemistry show partial overlap between pSMAD2,3 and PAR3–GFP (arrowhead, I‴). The inset in I‴ shows a magnified view of the PAR3-GFP+ apical compartment in the cell marked by arrowhead.
The PAR complex is known to associate with, and stabilize, tight junctions by excluding LGL from the apical compartment (Bilder, 2004; Dollar et al., 2005; Plant et al., 2003; Yamanaka et al., 2003; Zavadil and Böttinger, 2005). The paralateral transfer of LGL–GFP into the apical compartment, and the removal of apical PAR3 into endosomes thus suggests that TGFβ misexpression disrupts tight junction integrity in the neural epithelium by regulating the subcellular localization of apicobasal polarity proteins (Plant et al., 2003; Yamanaka et al., 2003).
TGFβ pathway members biochemically interact with the PAR complex at apical junctions
In previous work, we demonstrated that BMP signaling stabilized tight junctions through biochemical interactions between pSMAD1,5,8 and the PAR complex (Eom et al., 2011). Given the opposite effect of caSmad2 on tight junctions, we next asked whether pSMAD2,3 might also biochemically associate with the PAR complex. Co-immunoprecipitation and western blotting of whole-cell lysates from cells that had been electroporated with EGFP revealed that pSMAD2,3 associated with all members of the PAR polarity complex: PAR3, PAR6 and aPKC (Fig. 4E–H′). However, a comparison between PAR3–pSMAD2,3 and PAR3–pSMAD1,5,8 interactions suggested that the latter interactions are stronger, according well with the overall epithelial characteristics of the neural plate (Fig. 4H,H′).
To further confirm that pSMAD2,3 associates with the PAR complex at apical junctions, we combined pSMAD2,3 immunohistochemistry with low (1 µg/µl) non-phenotypic Par3–GFP expression, which remained apically restricted and resembled wild-type PAR3 expression (Fig. 4I). We confined our analyses to mitotic cells where strong cytosolic pSMAD expression is seen (Fig. 1). Owing to their cell-cycle-dependent modulation, pSMAD proteins displayed variable expression in the mitotic cytosol (see Fig. S3A–A‴). However, 80% of mitotic cells (n=20 out of 25) unexpectedly displayed a partial overlap between pSMAD2,3 and the PAR3–GFP domains, frequently forming a PAR3–GFP-negative ‘sub-apical cap’ immediately basal to the apical domain (Fig. 4I–I‴; see also, Fig. 1B–B″, right, white arrowhead). By contrast, pSMAD1,5,8 fully encompassed apical PAR3–GFP expression and additionally extended throughout the cytosol (Fig. S3D–D‴; Fig. 1D–D″) (Eom et al., 2011). These data confirm the co-immunoprecipitation and western blotting observations that suggest greater association of pSMAD1,5,8 with apical junctions in wild-type neural plates (Fig. 4H–H′). They also point to the presence of non-apical cytosolic pools of pSMAD proteins, which display novel functions as addressed below.
TGFβ and BMP regulate pSMAD–PAR-complex interactions in opposite directions
PAR complex proteins are found exclusively in the cytosol, and together with the data present above, suggest that pSMAD–PAR-complex interactions occur in the cytosol and represent non-canonical BMP or TGFβ activity (Fig. 4I–I‴) (Eom et al., 2011). Co-immunoprecipitation and western blot analyses in EGFP-electroporated cytosolic extracts confirmed that pSMAD2,3 and pSMAD1,5,8 biochemically interact with PAR3 in the cytosol (top rows in Fig. 5A–F′). The ability of phosphorylated r-SMADs to interact with the PAR complex in the cytosol suggested a potentially novel mechanism for BMP and TGFβ cross-repression, where each ligand could negatively regulate interactions between the PAR complex and the r-SMADs for the other pathway. This was demonstrated by caSmad2 misexpression, which increased PAR3–pSMAD2,3 interactions, and reduced PAR3–pSMAD1,5,8 interactions, whereas Lefty2 misexpression did the opposite (Fig. 5A–B′). BMP4 and Noggin misexpression mimicked the effects of Lefty2 and caSmad2, respectively, and suppressed pSMAD2,3–PAR-complex interactions in the cytosol while increasing pSMAD1,5,8–PAR-complex interactions (Fig. 5C–F′).
Fig. 5.

TGFβ and BMP signals modulate pSMAD–PAR3 interactions in opposite directions. Each panel (A–F′) represents a single co-immunoprecipitation (IP) and western blotting (WB) experiment on cytosolic extracts, with lanes cut and aligned vertically for clarity. Experimental lanes in each panel should be compared to their own EGFP controls (top row) and not to EGFP controls in adjacent panels. Co-immunoprecipitation and western blotting in A–F were reversed in A′–F′, respectively. ep, electroporation. (A,A′) Compared to EGFP, caSmad2 increases and Lefty2 reduces PAR3–pSMAD2,3 interactions. (B,B′) caSmad2 reduces and Lefty2 increases PAR3–pSMAD1,5,8 interactions. (C–D′) BMP4 reduces PAR3–pSMAD2,3 interactions (C,C′) and increases pSMAD1,5,8–PAR3 interactions (D,D′). (E–F′) Noggin electroporations increase PAR3–pSMAD2,3 interactions (E,E′) and reduce PAR3–pSMAD1,5,8 interactions. (G) Top panel, western blotting of whole-cell lysates electroporated with EGFP, caSmad2, Lefty2, BMP4 or Noggin display similar levels of PAR3 protein. Bottom panel, loading controls. (H) Western blotting with anti-H1b (nuclear) and anti-α-tubulin (cytosolic) antibodies demonstrating the purity of cytosolic extracts prepared from EGFP and caSmad2-electroporated midbrains. (I) Cartoon summarizing the results shown in A–F.
We next electroporated non-phenotypic levels of Par3–GFP either alone (controls) or with caSmad2 or Noggin and combined these with the immunodetection of pSMAD proteins in mitotic cells as described above (Fig. S3A–F‴; Fig. 4I–I″). Owing to the cell-cycle-dependent modulation of pSMAD proteins, control and experimental brains displayed variable overlap between PAR3-GFP and pSMAD proteins in the cytosol. However, compared to controls, caSmad2 and Noggin-induced ectopic hinge points displayed increased overlap of PAR3–GFP with pSMAD2,3, but not with pSMAD1,5,8, thus confirming the results obtained by co-immunoprecipitation and western blotting (Fig. S3A–F‴; Fig. 5). Interestingly, neither ligand affected PAR3 or total SMAD protein levels, although both altered pSMAD levels (Figs 2J and 5G). Thus, TGFβ and BMP ligands modulate r-SMAD association with apical junctions by regulating their phosphorylation in opposite directions. These interactions differ from previously described mechanisms of BMP–TGFβ antagonism, which are based on atypical heteromerization of r-SMADs and/or altered r-SMAD association with SMAD4 (Grönroos et al., 2012 and references therein). These findings thus represent a novel, non-canonical form of BMP and TGFβ function in the cytosol (summarized in Fig. 5I).
pSMADs biochemically interact with LGL
We noted that pools of cytosolic pSMAD proteins were not associated with apical polarity proteins (Fig. 4I–I‴; Fig. S3A–A‴,D–D‴) (Eom et al., 2011). We therefore asked whether the non-junctional cytosolic pSMAD pools might also play a role in modulating epithelial organization. We focused on potential pSMAD interactions with LGL because LGL can induce ectopic hinge points in lateral neural plate, compete with PAR3 for PAR6 binding, and shuttle between the apical compartment and the cytosol in a BMP- and TGFβ-dependent manner (Fig. 4A–D′) (Betschinger et al., 2003; Dollar et al., 2005; Eom et al., 2011; Plant et al., 2003; Yamanaka et al., 2003).
We confirmed that low, non-phenotypic levels of electroporated Lgl1–GFP remained confined to the cytosol of control brains (Fig. 6A) (Eom et al., 2011). Cytosolic lysates prepared from such control electroporations unexpectedly revealed that LGL–GFP can biochemically interact with pSMAD2,3 and pSMAD1,5,8 in the neural plate (Figs 5H and 6B,C). Low levels of electroporated Lgl1–GFP combined with pSMAD immunohistochemistry also demonstrated a greater degree of LGL1–GFP overlap with pSMAD2,3 than with pSMAD1,5,8 in the mitotic cytosol, confirming the co-immunoprecipitation and western blotting results (Fig. 6B,C).
Fig. 6.

LGL1–pSMAD interactions occur in the cytosol and are ligand dependent. (A) Absence of colocalization with DAPI demonstrates the cytosolic restriction of electroporated (ep) Lgl1–GFP. (B,C) Cytosolic extracts from Lgl1–GFP (1 µg/µl) electroporated cells display biochemical interactions between LGL1–GFP and pSMAD2,3 (B), and LGL1–GFP and pSMAD1,5,8 (C). Lgl1–GFP electroporations combined with pSMAD immunohistochemistry display cytosolic overlap between LGL1–GFP and pSMAD proteins (arrowheads, B,C). (D–K) Panels on the left represent single co-immunoprecipitation (IP) and western blotting (WB) experiments on cytosolic extracts, with lanes cut and aligned vertically for clarity. Experimental lanes in each panel should be compared to their own Lgl1–GFP controls (top row) and not to Lgl1–GFP controls in adjacent panels. Panels on the right provide immunohistochemical evidence of overlap (arrowheads) between LGL1–GFP and pSMAD2,3 or pSMAD1,5,8. (D,E) Compared to Lgl1–GFP controls, caSmad2 reduces and Lefty2 increases LGL1–GFP–pSMAD2,3 interactions. (F,G) Compared to controls (top panel), caSmad2 increases and Lefty reduces pSMAD1,5,8–LGL1–GFP interactions. (H,I) BMP4 increases LGL1–GFP–pSMAD2,3 interactions (H) and reduces pSMAD1,5,8–LGL1–GFP (I) interactions. (J,K) Noggin reduces pSMAD2,3–LGL1–GFP interactions (J) and increases pSMAD1,5,8–LGL1–GFP interactions (K). The scale bar in B applies to all immunohistochemical panels (B–K). (L) Cartoon summarizing data shown in B–K.
Interestingly, compared to controls, caSmad2 misexpression reduced LGL1–GFP and pSMAD2,3 interaction, whereas Lefty2 misexpression did the opposite (Fig. 6D,E). By contrast, caSmad2 misexpression increased pSMAD1,5,8–LGL1 interactions, whereas Lefty2 misexpression produced the opposite results (Fig. 6F,G). BMP4 misexpression mimicked the effects of Lefty2 misexpression by increasing pSMAD2,3–LGL1–GFP interactions and reducing pSMAD1,5,8–LGL1–GFP interactions (Fig. 6H,I). Noggin misexpression did the opposite and mimicked the effects of caSmad2 misexpression by reducing pSMAD2,3–LGL1–GFP interactions and increasing pSMAD1,5,8–LGL1–GFP interactions (Fig. 6J,K). We next examined the colocalization of pSMAD proteins in mitotic cells following non-phenotypic Lgl1–GFP electroporations either alone, or combined with caSmad2, Lefty2, BMP4 or Noggin manipulations (Fig. 6D–K). Unlike controls, caSmad2 and Noggin induced ectopic hinges, and displayed reduced LGL1–GFP–pSMAD2,3 overlap in the cytosol and increased LGL1–GFP–pSMAD1,5,8 overlap, whereas BMP4 and Lefty2 misexpression produced the opposite results (Fig. 6B–K). These observations corroborate the co-immunopreciptation and western blotting results and show for the first time that BMP and TGFβ ligands regulate pSMAD–LGL interactions, although in an opposite direction to their regulation of pSMAD–PAR-complex interactions (summarized in Fig. 6L). Taken together, these results suggest that pSMAD proteins can reciprocally interact with apical and basolateral proteins in a BMP- and TGFβ-dependent manner.
The results presented above demonstrate a non-canonical cytosolic function of pSMADs, but do not exclude a transcriptional role for BMP and TGFβ signaling in regulating epithelial organization during NTC. Interestingly, caSmad2 and Noggin induced ectopic hinges, and caused a substantial and non-cell-autonomous upregulation of SLUG (also known as SNAI2), a transcription factor that can induce the EMT transcriptional cascade and modulate epithelial organization (Fig. S4A–C‴) (Thiery and Sleeman, 2006). SLUG upregulation by caSmad2 and Noggin misexpression was accompanied by the downregulation and/or mislocalization of NCAD (CDH2), an adherens junction constituent involved in maintaining epithelial organization (Fig. S4D–F‴). Taken together, these results suggest that BMP and TGFβ signaling might regulate epithelial organization during NTC through canonical, as well as non-canonical mechanisms.
DISCUSSION
In this study, we describe a novel mechanism by which spatiotemporally dynamic morphogen gradients can be established during embryonic development. We show that cross-regulation between BMP and TGFβ pathways results in complementary, cell-cycle-dependent pSMAD1,5,8 and pSMAD2,3 modulation along the apicobasal axis of the neural plate (Fig. 7). Functionally discrete pSMAD pools are seen in the mitotic cytosol, which differentially interact with apical and basolateral polarity proteins in a ligand-dependent manner. These interactions help establish a dynamic epithelium where polarized cell behaviors (apical constriction, basal nuclear migration or retention, polarized endocytosis) can mediate cell-shape changes along the apicobasal axis. Mediolateral modulation of pSMAD1,5,8 regulates the spatial specificity of such changes, ensuring that the MHP forms at the ventral midline where BMP activity is at its lowest and TGFβ activity is high.
Fig. 7.
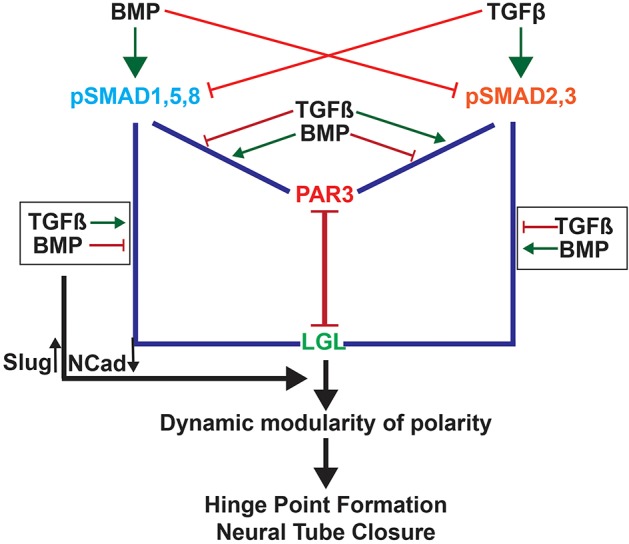
Cartoon summarizing cell-cycle-dependent TGF–BMP polarity interactions in regulating MHP formation. BMP signaling induces SMAD1,5,8 phosphorylation and reduces SMAD2,3 phosphorylation. This increases pSMAD1,5,8–PAR-complex interactions and reduces pSMAD2,3–PAR-complex interactions at apical junctions. BMPs also increase pSMAD2,3–LGL interactions and reduce pSMAD1,5,8–LGL interactions. Together these interactions create a stable epithelium. TGFβ signaling has the opposite effect and can disrupt epithelial organization and tight junction integrity either by increasing pSMAD2,3–PAR-complex interactions or decreasing pSMAD2,3–LGL interactions. Each cell cycles between the two states in a cell-cycle-dependent manner, giving rise to a dynamic epithelium capable of cell-shape changes, while retaining overall epithelial integrity. In addition, BMP and TGFβ signaling can modulate SLUG and NCAD expression in opposite directions, potentially through canonical mechanisms.
Non-canonical BMP–TGFβ interactions modulate apicobasal polarity during MHP formation
A role of TGFβ signaling in the disruption of epithelial organization is well established (Zavadil and Böttinger, 2005). Evidence for a role for BMP signaling in regulating epithelial organization in a variety of tissues and morphogenetic events, including NTC, has also recently begun to emerge (Eom et al., 2013; von der Hardt et al., 2007; Khalsa et al., 1998; Ray and Wharton, 2001; Sela-Donenfeld and Kalcheim, 1999; Shoval et al., 2007). In this study, we show that although BMP and TGFβ regulate epithelial organization in opposite directions, they converge on common downstream signaling mechanisms, which involve regulating the subcellular localization of LGL and PAR complex proteins and modulating their interactions.
TGFβ signaling can disrupt epithelial organization and induce EMT in many tissues using the transcription-dependent upregulation of EMT genes such as Snail, Slug, Zeb1 and Zeb2 (Nieto, 2002; Thiery and Sleeman, 2006; Zavadil and Böttinger, 2005). The current study suggests that similar TGFβ-mediated mechanisms are at play in the neural tube, and upregulate the EMT cascade and downregulate or mislocalize junctional proteins, such as NCAD, whereas BMP signaling does the opposite. Additional transcriptional modulation could involve the regulation of cell adhesion genes or the nucleo-cytosolic shuttling of pSMAD proteins (Candia et al., 1997; Greenwald et al., 2003; Nieto, 2002; Sela-Donenfeld and Kalcheim, 1999; Shoval et al., 2007; Thiery and Sleeman, 2006).
Previously proposed mechanisms of cross-repression between BMP and TGFβ signaling have depended upon ligand-mediated heteromerization between the two classes of r-SMADs or between r-SMADs and SMAD4 (Candia et al., 1997; Greenwald et al., 2003; Khalsa et al., 1998; Oshimori and Fuchs, 2012; Ray and Wharton, 2001). By contrast, our study provides evidence for a novel and non-canonical cytosolic mechanism of BMP–TGFβ antagonism that involves the ligand-dependent recruitment of pSMADs to tight junctions. We show that under high TGFβ and low BMP conditions, pSMAD2,3 levels are increased and pSMAD1,5,8 levels are reduced, without altering the total SMAD protein levels. pSMAD2,3 is recruited to the tight junction and pSMAD1,5,8 is excluded from it (Fig. 7). We show for the first time, that a concurrent increase in pSMAD1,5,8–LGL interactions and reduction in pSMAD2,3–LGL interactions sequesters pSMAD1,5,8 and makes more pSMAD2,3 available for interactions with tight junctions. High BMP and low TGFβ signaling produce the opposite effects, recruiting pSMAD1,5,8 to the tight junction and sequestering pSMAD2,3 away from the tight junction by increasing its association with LGL. Thus, BMP and TGFβ antagonism regulates apicobasal polarity by modulating pSMAD competition for tight junction occupancy and pSMAD sequestration by LGL (Fig. 7). Interestingly, our results suggest that pSMAD proteins associate with tight junctions in preference to LGL. The mechanisms underlying this preference are not understood, but are likely to depend upon additional, ligand-dependent, SMAD-phosphorylation-independent mechanisms.
Cell-cycle-dependent BMP and TGFβ apicobasal polarity interactions establish a dynamic epithelium during NTC
Sustained TGFβ misexpression or BMP blockade results in EMT and abnormal epithelial reorganization, including the formations of ectopic cysts or rosettes (Eom et al., 2012; Gibson and Perrimon, 2005; Shen and Dahmann, 2005). By contrast, increased BMP or reduced TGFβ signaling flatten the neural epithelium presumably because increased pSMAD1,5,8 at apical junctions make the epithelium inflexible and incapable of executing morphogenetic bending. However, the wild-type neural plate occupies neither end of this spectrum and forms a dynamic epithelium capable of undergoing shape changes without undergoing EMT.
We suggest that such a dynamic epithelium is created by cyclic TGFβ and BMP activity, which allows neural cells to shunt between full to partially polarized states as they progress through the cell cycle. When partially polarized, tight junctions are ‘floppy’ and permit the incursion of LGL into the apical compartment, and the removal of apical PAR3 into the cytosol by endocytosis. This type of junctional remodeling results in the removal of apical membranes into endosomes and might partially explain apical constriction, as it does in bottle cells during Xenopus gastrulation (Lee and Harland, 2010). The compromised polarity might also explain the basal retention and/or migration of nuclei because LGL misexpression, which induces PAR3 endocytosis and apical constriction, also induces basal nuclear migration or retention at ectopic hinge points, possibly through the regulation of cell cycle kinetics or the cellular cytoskeleton (Eom et al., 2011).
In the type of dynamic neural epithelium envisaged above, cells would undergo repeated cycles of shape changes, but return to a stable epithelial state in the interim. Given that cell cycle progression in the neural plate is asynchronous, adjacent cells would experience different levels of BMP signaling, as demonstrated by the mosaic expression of pSMAD1,5,8 when viewed apically (Eom et al., 2011). This would permit sets of MHP cells to change shape over time, while adjacent cells would remain integrated within the neural epithelium. Such a neural plate could be bent and shaped by BMP–TGFβ interactions without generalized epithelial disruption.
Despite their reciprocal modulation along the apicobasal axis, both types of pSMAD proteins undergo nucleocytosolic shuttling along the apicobasal axis and are mainly present in the cytosol during mitosis. Thus, shifts in polarity, which facilitate shape changes might occur during mitosis and involve specific mitotic phases. But how polarity shifts might affect events during subsequent phases of the cell cycle is not understood, although novel mechanisms that correlate junctional remodeling with cytokinesis have been recently proposed (Denes et al., 2015).
In vitro studies also demonstrate that when exposed to appropriate signals, epithelial cells grown in three-dimensional cultures can organize into complex repeated structures, such as branched tubules, by combining polarity modulations with cell cycle kinetics (Ewald et al., 2008; Mostov et al., 2003; Zegers et al., 2003). The current study provides mechanistic insight into how such signals might be established and modulated in a cyclic manner in vivo. Such dynamic modulation of morphogen levels might underlie not just three-dimensional tissue morphogenesis, but also the production of repeated tissue patterns (e.g. rhombomeres, somites). Given that such morphogen gradients could also simultaneously regulate other aspects of pattern formation (e.g. cell fate specification, cell proliferation, differentiation) their broad range of actions might ensure that tissue patterning occurs in a coordinated manner in three dimensions.
MATERIALS AND METHODS
Chick embryos
All experiments were conducted in accordance with the guidelines provided by the institutional IACUC. Fertilized Leghorn eggs (Ideal Poultry, Texas) were incubated at 38°C in a humidified forced-draft incubator. Embryos were staged according to Hamburger and Hamilton (1951).
Expression vectors
In vivo gene expression was driven by the pXex, pEFX, pMes or pCS2 expression vectors (Agarwala et al., 2001; Johnson and Krieg, 1994; Swartz et al., 2001). The construction of EGFP, membrane targeted EGFP (mEGFP), Lgl1–GFP, Par3–GFP, BMP4, Noggin, Lefty2 and caSmad2 expression vectors has been described previously (Bayly et al., 2007; Bisgrove et al., 1999; Eom et al., 2011). All experiments were conducted in accordance with biosafety and recombinant DNA protocols approved by the Institutional Biosafety Committee.
In ovo electroporation
1-4 μg/μl DNA was electroporated into HH4–HH9 midbrains according to previously established protocols (Bayly et al., 2007; Brown et al., 2012a,b). Electroporations were classified as early (HH4–HH5) or late (HH8–HH9) based on whether they were conducted prior to, or after midbrain neural tube closure at HH8 (Colas and Schoenwolf, 2001). Embryos were harvested between HH7 and E3.
Immunohistochemistry
Immunohistochemistry was performed as previously described (Eom et al., 2011). Embryos were stained with antibodies against pHH3 (1:500; Upstate, NY, # 07-424), PAR3 (1:500; Upstate, # 07-330), pSMAD1,5,8 (1:1000; Cell Signaling Technology, MA, # 9511S), pSMAD2,3 (1:100; Cell Signaling Technology, # 9743S), EEA1 (1:30; BD Biosciences, NJ, # 610456), FOXA2 (1:200; DSHB, IA, #4c7), SHH (1:200; DSHB, #5E1), LMX (1:200; DSHB, # 50.5A5), acetylated tubulin (1:500; Life Technologies, # 32-2700), N-CAD (1:10; DHSB, IA, # 6B3), SLUG (1:50; DHSB, IA, #62.1E6) and GFP (1:500; Molecular Probes, CA, # A11120). Alexa-Fluor-conjugated secondary antibodies were used for fluorescence detection (Afonso and Henrique, 2006). All antibodies used in the current study were validated for use in chicks in previous studies (Eom et al., 2011, 2012; Afonso and Henrique, 2006; Liem et al., 1995; Nagy et al., 2012; San Miguel-Ruiz and Letourneau, 2014).
Imaging
Confocal images were obtained with an Olympus IX51 spinning disc microscope and data analyses were carried out with Slidebook Pro (3I, CO). Images are presented as single 0.5–0.8-μm thick optical sections.
pSMAD fluorescence intensity measurements
pSMAD2,3 and pSMAD1,5,8 immunohistochemistry was combined with nuclear (DAPI) or cytosolic (acetylated-tubulin-positive) markers in HH6–HH7 midbrains, a period which overlapped with MHP formation (see Fig. 1A–F‴). Confocal midbrain images were collected as described above, and a sampling box subtending 90 µm×90 µm was placed across the MHP. pSMAD fluorescence was measured in 35 cells taken from six brains according to previously established protocols (McCloy et al., 2014; Burgess et al., 2010). Briefly, the strong cortical expression of acetylated tubulin staining along the cell periphery was used to draw cell outlines and DAPI staining was used to draw nuclear or chromatin outlines. Whole-cell and nuclear (chromatin in mitotic cells) pSMAD fluorescence was measured using Fiji software. Cytosolic pSMAD fluorescence was determined by computing the difference between the two measurements. The corrected cell fluorescence for each cellular compartment was obtained by applying a correction for background fluorescence as described in previous studies (McCloy et al., 2014; Burgess et al., 2010). Pair-wise comparisons of pSMAD fluorescence were made as follows: total (cytosolic+nuclear) pSMAD1,5,8 for mitotic versus interphase cells; total pSMAD2,3 for mitotic versus interphase cells; cytosolic pSMAD1,5,8 versus pSMAD2,3 in mitotic cells; nuclear pSMAD1,5,8 versus pSMAD2,3 in interphase cells. The statistical significance of each pair-wise comparison was determined by the Mann–Whitney test (see Fig. 1I,J for details).
Western blotting and immunoprecipitation
Western blotting and immunoprecipitations were carried out using previously established protocols (Eom et al., 2011).
Whole-cell lysates
Midbrains were electroporated at HH4–HH5 with EGFP, caSmad2, Lefty2, Noggin, BMP4, and non-phenotypic concentrations of Lgl1–GFP (1 µg/µl), either alone or in combination with caSmad2 (Eom et al., 2011). Whole-cell lysates were prepared in triplicate at HH12–H14 (late E2 to early E3) from electroporated regions identified in whole embryos under a fluorescent stereomicroscope. The fluorescent region was micro-dissected under visual control and contained the entire apicobasal thickness of the neural plate. The late harvesting times were required for obtaining sufficient quantities of lysates from electroporated regions of the midbrain. The choice of this time point is validated in Table 1, which shows that hinge points induced at HH4–H5 and examined between HH7 and E3 are morphologically identical and resemble the endogenous MHP based on morphological, molecular and cellular criteria outlined in the ‘Criteria for defining hinges’ section below.
Cytosolic extracts
Cytosolic extracts were prepared from 40–50 HH12–HH14 midbrains collected as described above and processed according to the manufacturer's instructions (Thermo Scientific, IL). The protein concentration was estimated using the BCA method (Thermo Scientific) (Smith et al., 1985). The purity of cytosolic extracts was checked by western blotting for α-tubulin (1:1000; Sigma, MO, #T6074) and histone H1b (1:500; Millipore, CA, #05.457) antibodies (Fig. 5H).
Co-immunoprecipitation and western blotting
Co-immunoprecipitations were performed in electroporated HH12–HH14 lysates (three biological replicates) incubated with 20 μg/ml of antibodies against PAR3, aPKC, PAR6, pSMAD1,5,8 or pSMAD2,3 (details as above) (Eom et al., 2011). Protein A/G agarose beads were used to precipitate the protein complexes, which were separated by SDS-PAGE. Western blotting was performed with antibodies against aPKC, PAR3, PAR6, pSMAD1,5,8, pSMAD2,3 (1:100 each, details as above), GFP (1:100; Molecular Probes, CA, #A11120), SMAD1 (1:50; Millipore, CA, #051459) or SMAD2 (1:100; Abcam, UK, #ab47083) antibodies, with the signal detected by ECL chemiluminescence (Thermo Scientific, IL). The anti-GFP antibody could not be used for immunoprecipitating LGL1–GFP. As a result, co-immunoprecipitation and western blotting were not performed in reverse in Fig. 6.
Cell measurements
Differences in cell behaviors were quantified in midbrains electroporated at HH4–HH5 and harvested at HH7. To validate our tissue collection strategy for biochemical experiments, identical measurements were also made at HH12–HH14 (Table 1). Quantitative measurements were made with ImageJ according to established protocols using 15–100 cells from 4–17 brains for each quantitative measurement (Eom et al., 2011). Sample sizes for individual measurements are reported in Table 1. Data are presented as mean±s.e.m. Given that the data displayed non-normal distributions, the statistical significance of pair-wise comparisons between control and experimental groups was made using the Mann–Whitney test (Table 1).
Criteria for defining hinges
Apical constriction
Given that large caSmad2 electroporations produced tissue-level dysmorphologies, we confined all quantitative analyses to focal electroporations of two to nine cells in the lateral neural plate. A sampling box subtending 90 µm×90 µm was centered over a mosaic cluster of electroporated cells in control or caSmad2-electroporated midbrains. A measure of apical constriction was obtained according to previously established protocols from midbrains stained with DAPI and PAR3 (Eom et al., 2011; Lee et al., 2007). Briefly, we measured the ratio of the apical width (aw) to the widest point or width (ww) of all electroporated mitotic cells with a clearly identifiable outline within the sampling box (e.g. Fig. 3A–B‴; Table 1).
Basal nuclear localization
The nuclear location of midbrain cells with respect to the apical surface was determined in DAPI- and PAR3-stained sections according to previously established protocols (Table 1) (Eom et al., 2011). Given that basal nuclear localization was a non-autonomous event, we measured the location of all nuclei (electroporated and un-electroporated) within the sampling box as outlined above.
Vertex to edge ratio at hinge points
To distinguish between normal topological variances along the apical surface and tissue invagination due to hinge point induction, we centered a sampling box over a mosaic cluster of electroporated cells as described above. We measured the apicobasal span of EGFP electroporated cells at the center and at the edge of the sampling box. For caSmad2 electroporations, we centered the sampling box at the vertex of a hinge point where the apicobasal span was at its shortest. Given that the average vertex:edge apicobasal span ratio was 0.89 for controls, we considered an invagination of the apical surface to be a hinge if the vertex:edge apicobasal span ratio was ≤0.65 (Table 1).
PAR3+ puncta and apical LGL1
The number of cells displaying PAR3+ puncta per sampling box were counted in control and experimental embryos using the sampling and statistical paradigms described above (Table 1). In brains electroporated with low levels of Lgl1–GFP, or caSmad2 and Lgl1–GFP, we also counted the number of cells which displayed apically localized ectopic LGL1–GFP using the paradigms described above (Table 1).
Acknowledgements
We thank Ms. Rachel Schermerhorn for help with immunohistochemistry, Drs S. Sokol, D. Henrique, C. Tabin, A. Reugels, Y. Wakamatsu and J. Yost for providing cDNAs and expression vectors, and Drs S. Vokes, J. Gross and Ms. C. Brown for critical reading of the manuscript. The FOXA2, SHH, LMX, SLUG antibodies (developed by Drs T. Jessell, S. Brenner-Morton), and the NCAD antibody (developed by Knudsen, K.A.) were obtained from the Developmental Studies Hybridoma Bank (University of Iowa, Department of Biology, Iowa City, IA 52242).
Footnotes
Competing interests
The authors declare no competing or financial interests.
Author contributions
S. Amarnath conducted and analyzed the experiments. S. Agarwala directed the research and wrote the manuscript.
Funding
This work was supported by the National Institutes of Health (NIH) (National Institute of Neurological Disorders and Stroke) [grant number R01 NS049091 to S.A.]. Deposited in PMC for release after 12 months.
Supplementary information
Supplementary information available online at http://jcs.biologists.org/lookup/doi/10.1242/jcs.179192.supplemental
References
- Afonso C. and Henrique D. (2006). PAR3 acts as a molecular organizer to define the apical domain of chick neuroepithelial cells. J. Cell Sci. 119, 4293-4304. 10.1242/jcs.03170 [DOI] [PubMed] [Google Scholar]
- Agarwala S., Sanders T. A. and Ragsdale C. W. (2001). Sonic hedgehog control of size and shape in midbrain pattern formation. Science 291, 2147-2150. 10.1126/science.1058624 [DOI] [PubMed] [Google Scholar]
- Andrew D. J. and Ewald A. J. (2010). Morphogenesis of epithelial tubes: insights into tube formation, elongation, and elaboration. Dev. Biol. 341, 34-55. 10.1016/j.ydbio.2009.09.024 [DOI] [PMC free article] [PubMed] [Google Scholar]
- Bayly R. D., Ngo M., Aglyamova G. V. and Agarwala S. (2007). Regulation of ventral midbrain patterning by Hedgehog signaling. Development 134, 2115-2124. 10.1242/dev.02850 [DOI] [PubMed] [Google Scholar]
- Bayly R. D., Brown C. Y. and Agarwala S. (2012). A novel role for FOXA2 and SHH in organizing midbrain signaling centers. Dev. Biol. 369, 32-42. 10.1016/j.ydbio.2012.06.018 [DOI] [PMC free article] [PubMed] [Google Scholar]
- Berk M., Desai S. Y., Heyman H. C. and Colmenares C. (1997). Mice lacking the ski proto-oncogene have defects in neurulation, craniofacial patterning, and skeletal muscle development. Genes Dev. 11, 2029-2039. 10.1101/gad.11.16.2029 [DOI] [PMC free article] [PubMed] [Google Scholar]
- Betschinger J., Mechtler K. and Knoblich J. A. (2003). The Par complex directs asymmetric cell division by phosphorylating the cytoskeletal protein Lgl. Nature 422, 326-330. 10.1038/nature01486 [DOI] [PubMed] [Google Scholar]
- Bilder D. (2004). Epithelial polarity and proliferation control: links from the Drosophila neoplastic tumor suppressors. Genes Dev. 18, 1909-1925. 10.1101/gad.1211604 [DOI] [PubMed] [Google Scholar]
- Bisgrove B. W., Essner J. J. and Yost H. J. (1999). Regulation of midline development by antagonism of lefty and nodal signaling. Development 126, 3253-3262. [DOI] [PubMed] [Google Scholar]
- Brown C. Y., Eom D. S., Amarnath S. and Agarwala S. (2012a). A simple technique for early in vivo electroporation of E1 chick embryos. Dev. Dyn. 241, 545-552. 10.1002/dvdy.23747 [DOI] [PMC free article] [PubMed] [Google Scholar]
- Brown C. Y., Eom D. S., Amarnath S. and Agarwala S. (2012b). In vivo electroporation of E1 chick embryos. Cold Spring Harb. Protoc. 2012, pdb.prot069708 10.1101/pdb.prot069708 [DOI] [PubMed] [Google Scholar]
- Burgess A., Vigneron S., Brioudes E., Labbé J.-C., Lorca T. and Castro A. (2010). Loss of human Greatwall results in G2 arrest and multiple mitotic defects due to deregulation of the cyclin B-Cdc2/PP2A balance. Proc. Natl. Acad. Sci. USA 107, 12564-12569. 10.1073/pnas.0914191107 [DOI] [PMC free article] [PubMed] [Google Scholar]
- Candia A. F., Watabe T., Hawley S. H., Onichtchouk D., Zhang Y., Derynck R., Niehrs C. and Cho K. W. (1997). Cellular interpretation of multiple TGF-beta signals: intracellular antagonism between activin/BVg1 and BMP-2/4 signaling mediated by Smads. Development 124, 4467-4480. [DOI] [PubMed] [Google Scholar]
- Caravaca J. M., Donahue G., Becker J. S., He X., Vinson C. and Zaret K. S. (2013). Bookmarking by specific and nonspecific binding of FoxA1 pioneer factor to mitotic chromosomes. Genes Dev. 27, 251-260. 10.1101/gad.206458.112 [DOI] [PMC free article] [PubMed] [Google Scholar]
- Castranio T. and Mishina Y. (2009). Bmp2 is required for cephalic neural tube closure in the mouse. Dev. Dyn. 238, 110-122. 10.1002/dvdy.21829 [DOI] [PMC free article] [PubMed] [Google Scholar]
- Chang H., Huylebroeck D., Verschueren K., Guo Q., Matzuk M. M. and Zwijsen A. (1999). Smad5 knockout mice die at mid-gestation due to multiple embryonic and extraembryonic defects. Development 126, 1631-1642. [DOI] [PubMed] [Google Scholar]
- Colas J.-F. and Schoenwolf G. C. (2001). Towards a cellular and molecular understanding of neurulation. Dev. Dyn. 221, 117-145. 10.1002/dvdy.1144 [DOI] [PubMed] [Google Scholar]
- Copp A. J. and Greene N. D. E. (2013). Neural tube defects–disorders of neurulation and related embryonic processes. Wiley Interdiscip. Rev. Dev. Biol. 2, 213-227. 10.1002/wdev.71 [DOI] [PMC free article] [PubMed] [Google Scholar]
- Denes A. S., Kanca O. and Affolter M. (2015). A cellular process that includes asymmetric cytokinesis remodels the dorsal tracheal branches in Drosophila larvae. Development 142, 1794-1805. 10.1242/dev.118372 [DOI] [PubMed] [Google Scholar]
- Dollar G. L., Weber U., Mlodzik M. and Sokol S. Y. (2005). Regulation of Lethal giant larvae by Dishevelled. Nature 437, 1376-1380. 10.1038/nature04116 [DOI] [PubMed] [Google Scholar]
- Eom D. S., Amarnath S., Fogel J. L. and Agarwala S. (2011). Bone morphogenetic proteins regulate neural tube closure by interacting with the apicobasal polarity pathway. Development 138, 3179-3188. 10.1242/dev.058602 [DOI] [PMC free article] [PubMed] [Google Scholar]
- Eom D. S., Amarnath S., Fogel J. L. and Agarwala S. (2012). Bone morphogenetic proteins regulate hinge point formation during neural tube closure by dynamic modulation of apicobasal polarity. Birth Defects Res. A Clin. Mol. Teratol. 94, 804-816. 10.1002/bdra.23052 [DOI] [PMC free article] [PubMed] [Google Scholar]
- Eom D. S., Amarnath S. and Agarwala S. (2013). Apicobasal polarity and neural tube closure. Dev. Growth Differ. 55, 164-172. 10.1111/dgd.12030 [DOI] [PMC free article] [PubMed] [Google Scholar]
- Ewald A. J., Brenot A., Duong M., Chan B. S. and Werb Z. (2008). Collective epithelial migration and cell rearrangements drive mammary branching morphogenesis. Dev. Cell 14, 570-581. 10.1016/j.devcel.2008.03.003 [DOI] [PMC free article] [PubMed] [Google Scholar]
- Gibson M. C. and Perrimon N. (2003). Apicobasal polarization: epithelial form and function. Curr. Opin. Cell Biol. 15, 747-752. 10.1016/j.ceb.2003.10.008 [DOI] [PubMed] [Google Scholar]
- Gibson M. C. and Perrimon N. (2005). Extrusion and death of DPP/BMP-compromised epithelial cells in the developing Drosophila wing. Science 307, 1785-1789. 10.1126/science.1104751 [DOI] [PubMed] [Google Scholar]
- Greenwald J., Groppe J., Gray P., Wiater E., Kwiatkowski W., Vale W. and Choe S. (2003). The BMP7/ActRII extracellular domain complex provides new insights into the cooperative nature of receptor assembly. Mol. Cell 11, 605-617. 10.1016/S1097-2765(03)00094-7 [DOI] [PubMed] [Google Scholar]
- Grönroos E., Kingston I. J., Ramachandran A., Randall R. A., Vizán P. and Hill C. S. (2012). Transforming growth factor β inhibits bone morphogenetic protein-induced transcription through novel phosphorylated Smad1/5-Smad3 complexes. Mol. Cell Biol. 32, 2904-2916. 10.1128/MCB.00231-12 [DOI] [PMC free article] [PubMed] [Google Scholar]
- Hamburger V. and Hamilton H. L. (1951). A series of normal stages in the development of the chick embryo. J. Morphol. 88, 49-92. 10.1002/jmor.1050880104 [DOI] [PubMed] [Google Scholar]
- Harris M. J. and Juriloff M. D. (2010). An update to the list of mouse Mutants with neural tube closure defects and advances toward a complete genetic perspective of neural tube closure. Birth Defects Res. 88, 653-669. 10.1002/bdra.20676 [DOI] [PubMed] [Google Scholar]
- Johnson A. D. and Krieg P. A. (1994). pXeX, a vector for efficient expression of cloned sequences in Xenopus embryos. Gene 147, 223-226. 10.1016/0378-1119(94)90070-1 [DOI] [PubMed] [Google Scholar]
- Khalsa O., Yoon J. W., Torres-Schumann S. and Wharton K. A. (1998). TGF-beta/BMP superfamily members, Gbb-60A and Dpp, cooperate to provide pattern information and establish cell identity in the Drosophila wing. Development 125, 2723-2734. [DOI] [PubMed] [Google Scholar]
- Klezovitch O., Fernandez T. E., Tapscott S. J. and Vasioukhin V. (2004). Loss of cell polarity causes severe brain dysplasia in Lgl1 knockout mice. Genes Dev. 18, 559-571. 10.1101/gad.1178004 [DOI] [PMC free article] [PubMed] [Google Scholar]
- Kuang C., Xiao Y., Yang L., Chen Q., Wang Z., Conway S. J. and Chen Y. (2006). Intragenic deletion of Tgif causes defects in brain development. Hum. Mol. Genet. 15, 3508-3519. 10.1093/hmg/ddl427 [DOI] [PubMed] [Google Scholar]
- Lecuit T. and Lenne P.-F. (2007). Cell surface mechanics and the control of cell shape, tissue patterns and morphogenesis. Nat. Rev. Mol. Cell Biol. 8, 633-644. 10.1038/nrm2222 [DOI] [PubMed] [Google Scholar]
- Lee J.-Y. and Harland R. M. (2010). Endocytosis is required for efficient apical constriction during Xenopus gastrulation. Curr. Biol. 20, 253-258. 10.1016/j.cub.2009.12.021 [DOI] [PMC free article] [PubMed] [Google Scholar]
- Lee C., Scherr H. M. and Wallingford J. B. (2007). Shroom family proteins regulate gamma-tubulin distribution and microtubule architecture during epithelial cell shape change. Development 134, 1431-1441. 10.1242/dev.02828 [DOI] [PubMed] [Google Scholar]
- Liem K. F. Jr, Tremml G., Roelink H. and Jessell T. M. (1995). Dorsal differentiation of neural plate cells induced by BMP-mediated signals from epidermal ectoderm. Cell 82, 969-979. 10.1016/0092-8674(95)90276-7 [DOI] [PubMed] [Google Scholar]
- Margolis B. and Borg J. P. (2005). Apicobasal polarity complexes. J. Cell Sci. 118, 5157-5159. 10.1242/jcs.02597 [DOI] [PubMed] [Google Scholar]
- Martin-Belmonte F., Yu W., Rodriguez-Fraticelli A. E., Ewald A., Werb Z., Alonso M. A. and Mostov K. (2008). Cell-polarity dynamics controls the mechanism of lumen formation in epithelial morphogenesis. Curr. Biol. 18, 507-513. 10.1016/j.cub.2008.02.076 [DOI] [PMC free article] [PubMed] [Google Scholar]
- McCloy R. A., Rogers S., Caldon C. E., Lorca T., Castro A. and Burgess A. (2014). Partial inhibition of Cdk1 in G 2 phase overrides the SAC and decouples mitotic events. Cell Cycle 13, 1400-1412. 10.4161/cc.28401 [DOI] [PMC free article] [PubMed] [Google Scholar]
- McMahon J. A., Takada S., Zimmerman L. B., Fan C.-M., Harland R. M. and McMahon A. P. (1998). Noggin-mediated antagonism of BMP signaling is required for growth and patterning of the neural tube and somite. Genes Dev. 12, 1438-1452. 10.1101/gad.12.10.1438 [DOI] [PMC free article] [PubMed] [Google Scholar]
- Michelotti E. F., Sanford S. and Levens D. (1997). Marking of active genes on mitotic chromosomes. Nature 388, 895-899. 10.1038/42282 [DOI] [PubMed] [Google Scholar]
- Miyazono K., Kamiya Y. and Morikawa M. (2010). Bone morphogenetic protein receptors and signal transduction. J. Biochem. 147, 35-51. 10.1093/jb/mvp148 [DOI] [PubMed] [Google Scholar]
- Mostov K., Su T. and ter Beest M. (2003). Polarized epithelial membrane traffic: conservation and plasticity. Nat. Cell Biol. 5, 287-293. 10.1038/ncb0403-287 [DOI] [PubMed] [Google Scholar]
- Nagy N., Burns A. J. and Goldstein A. M. (2012). Immunophenotypic characterization of enteric neural crest cells in the developing avian colorectum. Dev. Dyn. 241, 842-851. 10.1002/dvdy.23767 [DOI] [PMC free article] [PubMed] [Google Scholar]
- Nakajima Y.-I., Meyer E. J., Kroesen A., McKinney S. A. and Gibson M. C. (2013). Epithelial junctions maintain tissue architecture by directing planar spindle orientation. Nature 500, 359-362. 10.1038/nature12335 [DOI] [PubMed] [Google Scholar]
- Niederkofler V., Salie R., Sigrist M. and Arber S. (2004). Repulsive guidance molecule (RGM) gene function is required for neural tube closure but not retinal topography in the mouse visual system. J. Neurosci. 24, 808-818. 10.1523/JNEUROSCI.4610-03.2004 [DOI] [PMC free article] [PubMed] [Google Scholar]
- Nieto M. A. (2002). The snail superfamily of zinc-finger transcription factors. Nat. Rev. Mol. Cell Biol. 3, 155-166. 10.1038/nrm757 [DOI] [PubMed] [Google Scholar]
- Nishimura T., Honda H. and Takeichi M. (2012). Planar cell polarity links axes of spatial dynamics in neural-tube closure. Cell 149, 1084-1097. 10.1016/j.cell.2012.04.021 [DOI] [PubMed] [Google Scholar]
- Oshimori N. and Fuchs E. (2012). Paracrine TGF-β signaling counterbalances BMP-mediated repression in hair follicle stem cell activation. Cell Stem Cell 10, 63-75. 10.1016/j.stem.2011.11.005 [DOI] [PMC free article] [PubMed] [Google Scholar]
- Pilot F. and Lecuit T. (2005). Compartmentalized morphogenesis in epithelia: from cell to tissue shape. Dev. Dyn. 232, 685-694. 10.1002/dvdy.20334 [DOI] [PubMed] [Google Scholar]
- Plant P. J., Fawcett J. P., Lin D. C. C., Holdorf A. D., Binns K., Kulkarni S. and Pawson T. (2003). A polarity complex of mPar-6 and atypical PKC binds, phosphorylates and regulates mammalian Lgl. Nat. Cell Biol. 5, 301-308. 10.1038/ncb948 [DOI] [PubMed] [Google Scholar]
- Ray R. P. and Wharton K. A. (2001). Context-dependent relationships between the BMPs gbb and dpp during development of the Drosophila wing imaginal disk. Development 128, 3913-3925. [DOI] [PubMed] [Google Scholar]
- San Miguel-Ruiz J. E. and Letourneau P. C. (2014). The role of Arp2/3 in growth cone actin dynamics and guidance is substrate dependent. J. Neurosci. 34, 5895-5908. 10.1523/JNEUROSCI.0672-14.2014 [DOI] [PMC free article] [PubMed] [Google Scholar]
- Sasaki H. and Hogan B. L. (1993). Differential expression of multiple fork head related genes during gastrulation and axial pattern formation in the mouse embryo. Development 118, 47-59. [DOI] [PubMed] [Google Scholar]
- Sauer F. C. (1935). Mitosis in the neural tube. J. Comp. Neurol. 62, 377-405. 10.1002/cne.900620207 [DOI] [Google Scholar]
- Schier A. F. (2003). Nodal signaling in vertebrate development. Annu. Rev. Cell Dev. Biol. 19, 589-621. 10.1146/annurev.cellbio.19.041603.094522 [DOI] [PubMed] [Google Scholar]
- Sela-Donenfeld D. and Kalcheim C. (1999). Regulation of the onset of neural crest migration by coordinated activity of BMP4 and Noggin in the dorsal neural tube. Development 126, 4749-4762. [DOI] [PubMed] [Google Scholar]
- Shen J. and Dahmann C. (2005). Extrusion of cells with inappropriate Dpp signaling from Drosophila wing disc epithelia. Science 307, 1789-1790. 10.1126/science.1104784 [DOI] [PubMed] [Google Scholar]
- Shen M. M. (2007). Nodal signaling: developmental roles and regulation. Development 134, 1023-1034. 10.1242/dev.000166 [DOI] [PubMed] [Google Scholar]
- Shoval I., Ludwig A. and Kalcheim C. (2007). Antagonistic roles of full-length N-cadherin and its soluble BMP cleavage product in neural crest delamination. Development 134, 491-501. 10.1242/dev.02742 [DOI] [PubMed] [Google Scholar]
- Smith P. K., Krohn R. I., Hermanson G. T., Mallia A. K., Gartner F. H., Provenzano M. D., Fujimoto E. K., Goeke N. M., Olson B. J. and Klenk D. C. (1985). Measurement of protein using bicinchoninic acid. Anal. Biochem. 150, 76-85. 10.1016/0003-2697(85)90442-7 [DOI] [PubMed] [Google Scholar]
- Solloway M. J. and Robertson E. J. (1999). Early embryonic lethality in Bmp5;Bmp7 double mutant mice suggests functional redundancy within the 60A subgroup. Development 126, 1753-1768. [DOI] [PubMed] [Google Scholar]
- Suzuki M., Morita H. and Ueno N. (2012). Molecular mechanisms of cell shape changes that contribute to vertebrate neural tube closure. Dev. Growth Differ. 54, 266-276. 10.1111/j.1440-169X.2012.01346.x [DOI] [PubMed] [Google Scholar]
- Swartz M., Eberhart J., Mastick G. S. and Krull C. E. (2001). Sparking new frontiers: using in vivo electroporation for genetic manipulations. Dev. Biol. 233, 13-21. 10.1006/dbio.2001.0181 [DOI] [PubMed] [Google Scholar]
- Thiery J. P. and Sleeman J. P. (2006). Complex networks orchestrate epithelial-mesenchymal transitions. Nat. Rev. Mol. Cell Biol. 7, 131-142. 10.1038/nrm1835 [DOI] [PubMed] [Google Scholar]
- von der Hardt S., Bakkers J., Inbal A., Carvalho L., Solnica-Krezel L., Heisenberg C.-P. and Hammerschmidt M. (2007). The Bmp gradient of the zebrafish gastrula guides migrating lateral cells by regulating cell-cell adhesion. Curr. Biol. 17, 475-487. 10.1016/j.cub.2007.02.013 [DOI] [PubMed] [Google Scholar]
- Yamanaka T., Horikoshi Y., Sugiyama Y., Ishiyama C., Suzuki A., Hirose T., Iwamatsu A., Shinohara A. and Ohno S. (2003). Mammalian Lgl forms a protein complex with PAR-6 and aPKC independently of PAR-3 to regulate epithelial cell polarity. Curr. Biol. 13, 734-743. 10.1016/S0960-9822(03)00244-6 [DOI] [PubMed] [Google Scholar]
- Yamanaka T., Horikoshi Y., Izumi N., Suzuki A., Mizuno K. and Ohno S. (2006). Lgl mediates apical domain disassembly by suppressing the PAR-3-aPKC-PAR-6 complex to orient apical membrane polarity. J. Cell Sci. 119, 2107-2118. 10.1242/jcs.02938 [DOI] [PubMed] [Google Scholar]
- Ybot-Gonzalez P., Gaston-Massuet C., Girdler G., Klingensmith J., Arkell R., Greene N. D. E. and Copp A. J. (2007). Neural plate morphogenesis during mouse neurulation is regulated by antagonism of Bmp signalling. Development 134, 3203-3211. 10.1242/dev.008177 [DOI] [PubMed] [Google Scholar]
- Zavadil J. and Böttinger E. P. (2005). TGF-beta and epithelial-to-mesenchymal transitions. Oncogene 24, 5764-5774. 10.1038/sj.onc.1208927 [DOI] [PubMed] [Google Scholar]
- Zegers M. M. P., O'Brien L. E., Yu W., Datta A. and Mostov K. E. (2003). Epithelial polarity and tubulogenesis in vitro. Trends Cell Biol. 13, 169-176. 10.1016/S0962-8924(03)00036-9 [DOI] [PubMed] [Google Scholar]