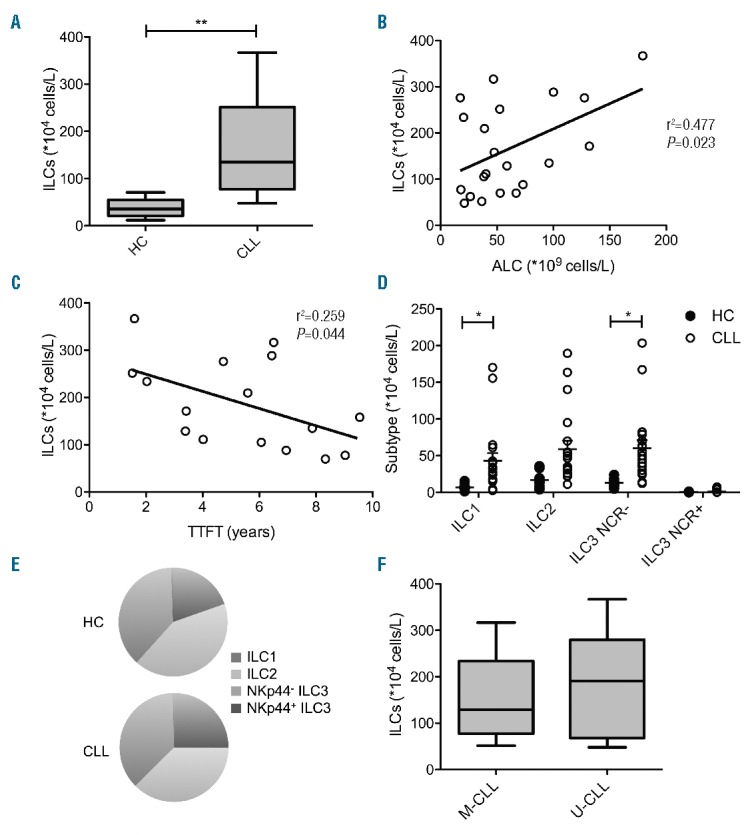
Figure 1.

Frequency and subtype distribution of ILCs in untreated CLL patients and age-matched HCs. Cells were stained with FITC-conjugated antibodies against lineage markers (anti-CD1a, anti-CD11c, anti-CD14, anti-CD19, anti-CD34, anti-CD94, anti-CD123, anti-FcER1α), anti-CD69 APC Cy7 (Biolegend), anti-TCRαβ FITC, anti-TCRγδ FITC, anti-CRTH2 AF647, anti-CD3 V500 (BD Biosciences), anti-NKp44 PE, anti-CD117 PE-Cy5.5 and anti-CD127 PE-Cy7 (Beckman Coulter). (A) Absolute total ILC counts in HCs (N=8) and CLL patients (n=21). (B) Correlation between absolute ILC counts and ALC in CLL patients. (C) Correlation between absolute ILC counts and time to first treatment (TTFT) in CLL patients. Absolute counts (D) and percentage (E) of ILC1s, ILC2s, NKp44−ILC3s and NKp44+ ILC3s. (F) Absolute counts of ILCs in M-CLL (n=12) and U-CLL (n=9). Data are presented as mean with standard error of the mean (SEM). Statistically significant differences are presented as *P<0.05; **P<0.01.
