Abstract
Extracellular adenosine in the brain, which modulates various physiological and pathological processes, fluctuates in a complicated manner that reflects the circadian cycle, neuronal activity, metabolism and disease states. The dynamics of extracellular adenosine in the brain are not fully understood, largely because of the lack of simple and reliable methods of measuring time-dependent changes in tissue adenosine distribution. This study describes the development of a biosensor, designated an adenosine sensor cell, expressing adenosine A1 receptor and a genetically-modified G protein. This biosensor was used to characterize extracellular adenosine elevation in brain tissue by measuring intracellular calcium elevation in response to adenosine. Placement of adenosine sensor cells below hippocampal slices successfully detected adenosine releases from these slices in response to neuronal activity and astrocyte swelling by conventional calcium imaging. Pharmacological analyses indicated that high-frequency electrical stimulation induced postsynaptic adenosine release in a manner dependent on L-type calcium channels and calcium-induced calcium release. Adenosine release following treatments that cause astrocyte swelling is independent of calcium channels, but dependent on aquaporin 4, an astrocyte-specific water channel subtype. The ability of ectonucleotidase inhibitors to inhibit adenosine release following astrocyte swelling, but not electrical stimulation, suggests that the former reflects astrocytic ATP release and subsequent enzymatic breakdown, whereas the latter reflects direct adenosine release from neurons. These results suggest that distinct mechanisms are responsible for extracellular adenosine elevations by neurons and astrocytes, allowing exquisite regulation of extracellular adenosine in the brain.
Keywords: adenosine, astrocyte, calcium channel, dendrite, water channel
Graphical abstract
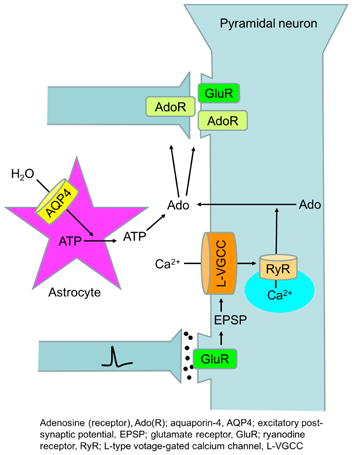
Time-dependent changes in the distribution of adenosine, a neuromodulator with various physiological and pathological functions, were analyzed in hippocampal slices using a novel biosensor that images extracellular adenosine. Increases in tissue adenosine following electrical stimulation were attributed to L-type calcium channel dependent adenosine release from postsynaptic neurons, whereas astrocyte swelling increased adenosine by releasing ATP and subsequent enzymatic catabolism.
Introduction
Extracellular adenosine modulates diverse physiological and pathological processes, including neuronal activity, blood flow, metabolism and inflammation, both in peripheral organs (Belardinelli et al. 1998, Hansen & Schnermann 2003, Ernst et al. 2010) and in the central nervous system (CNS). In the CNS, adenosine modulates, but does not trigger, synaptic responses by A1 and A2A receptors, which mainly localize at excitatory synapses (Rebola et al. 2003, Rebola et al. 2005a, Rebola et al. 2005b), suggesting that adenosine acts as a prototypic neuromodulator. A1 receptors, one of the most abundant G protein-coupled receptors in the brain, control basal network activities by suppressing synaptic transmission (Dunwiddie & Masino 2001), whereas A2A receptors play essential roles in some forms of synaptic plasticity (Rebola et al. 2008, Costenla et al. 2011). In addition, adenosine receptors crosstalk with other neurotransmitter and neuromodulator receptors for fine tuning of synapses (Sebastiao & Ribeiro 2009). Transient elevations of extracellular adenosine following high frequency stimulation have been found to play crucial roles in plastic changes in synaptic transmission, including in heterosynaptic depression (Manzoni et al. 1994) and long-term potentiation (Rebola et al. 2008). Furthermore, ambient adenosine has been found to fluctuate during physiological and pathological processes, including sleep (Porkka-Heiskanen & Kalinchuk 2011), ischemia (Winn et al. 1979) and epilepsy (Boison 2005), thus modulating brain waves (Pietersen et al. 2009), cerebral blood flow (Gordon et al. 2008) and neuronal survival (Rudolphi et al. 1992).
Although adenosine plays crucial roles in brain physiology and pathology, the mechanisms underlying the dynamics of extracellular adenosine in the brain are poorly understood. Results using peripheral and central tissue preparations have suggested several pathways responsible for the elevation of extracellular adenosine, including exocytosis (Klyuch et al. 2012), transport (Wall & Dale 2013, Lovatt et al. 2012) and enzymatic breakdown of extracellular nucleotides (Heinrich et al. 2012, Mi & Jackson 1998). Several pathways are also responsible for reductions in extracellular adenosine, including equilibrative nucleoside transporter-mediated adenosine uptake (Baldwin et al. 2004), which is potentiated by the clearance of intracellular adenosine by adenosine kinase (Boison 2005) and/or adenosine deaminase (Lloyd & Fredholm 1995). In peripheral organs, distinct mechanisms regulate extracellular adenosine. For example, elevated extracellular adenosine in cardiac ischemia is due to an imbalance between ATP production and consumption (Headrick et al. 2003), whereas elevated renal extracellular adenosine is due to cAMP release and subsequent breakdown by phosphodiesterases and nucleotidases (Mi & Jackson 1998). Thus, the brain, which utilizes adenosine for diverse functions, is thought to be equipped with multiple pathways for elevating extracellular adenosine, allowing exquisite spatiotemporal regulation.
In addition to activity-dependent synaptic releases of ATP (White 1977, Wieraszko et al. 1989, Cunha et al. 1996), accumulating evidence suggests that astrocytes play central roles in ATP signaling in the CNS. Astrocytes have been shown to release ATP by exocytosis (Lalo et al. 2014), gap junction hemichannels (Orellana et al. 2011), P2X7 receptors (Suadicani et al. 2006), and anion channels (Liu et al. 2008), and astrocyte-derived ATP is presumably involved in a number of intercellular communications in the CNS (Chen et al. 2013a, Davalos et al. 2005, Cui et al. 2014). Furthermore, astrocyte ATP is converted to adenosine by ectonucleotidases (Yang et al. 2015). However, it is still unclear whether astrocytes are the source of ambient extracellular adenosine in physiological and pathological conditions, as well as transient increases in ATP and/or adenosine in response to neuronal activities.
Extracellular adenosine has been measured by HPLC (Andresen et al. 1999) and enzymatic electrodes (Wall & Dale 2013). These methods allow accurate quantification of adenosine concentration, but require specialized equipment and techniques and lack spatial resolution. Thus, we hypothesized that the imaging of tissue adenosine will reveal novel aspects of adenosine release mechanisms. This study describes a novel and efficient method for measuring time-dependent changes in tissue adenosine distribution and use of this method to characterize adenosine release in the hippocampus. Adenosine was detected as elevated intracellular calcium in HEK293 cells expressing mouse adenosine A1 receptor and Gqi5, a chimeric Gq alpha subunit in which the five carboxy-terminal amino acids are replaced by the corresponding part of Gi (Conklin et al. 1993). These cells, designated adenosine sensor cells, were placed below hippocampal slices, with calcium imaging used to measure adenosine release from slices following electrical or pharmacological stimulation. Our pharmacological analysis of hippocampal elevation of extracellular adenosine, as measured by adenosine sensor cells, revealed multiple pathways, involving neuronal calcium channels and astrocytic water channels. These results illustrate the exquisite regulation of extracellular adenosine in the brain.
Materials and methods
Cell culture
Mouse A1 receptor cDNA was amplified by PCR and subcloned into pcDNA3.1 (Life Technologies, Carlsbad, CA). A DNA fragment containing Gqi5 was generated by PCR (Conklin et al. 1993) and subcloned into pME18S. Adenosine sensor cells were generated by transfecting HEK293 cells (ATCC, Manassa, VA) with these two plasmids using GenePORTER (Genlantis, San Diego CA) and by selecting stable transfectants showing calcium response to adenosine with G418 (Life Technologies) and calcium imaging. The adenosine sensor cells were maintained in DMEM/F12 (Life Technologies) containing 10% fetal calf serum and antibiotics (50 U/ml penicillin and 50 μg/ml streptomycin, Life Technologies).
Hippocampal slices
All animal experiments were approved by the Institutional Animal Care and Use Committee (Permission number: 25-09-04) and performed according to the Animal Experimentation Regulations of Kobe University. Sprague-Dawley rats (Japan SLC, Shizuoka, Japan) were housed in cages that were maintained in a room with a temperature (24°C) and humidity-controlled environment on a 12-h light/dark cycle. Water and food were provided ad libitum. Rats of both sexes aged 3–4 weeks were decapitated under isoflurane anesthesia; their brains were removed into ice-cold cutting solution (2 mM KCl, 1.5 mM NaH2PO4, 26 mM NaHCO3, 6 mM MgSO4, 200 μM CaCl2, 10 mM D-glucose, 220 mM sucrose) saturated with 95% O2 / 5% CO2 gas; and 400 μm horizontal slices of brains were obtained using a ZERO-1 microslicer (Dosaka EM, Kyoto, Japan). The slices were maintained in artificial cerebrospinal fluid (aCSF; 124 mM NaCl, 2 mM KCl, 1.5 mM NaH2PO4, 26 mM NaHCO3, 1 mM MgSO4, 10 mM D-glucose, 2 mM CaCl2) saturated with 95% O2 / 5% CO2 at room temperature for more than one hour before experiments.
Calcium imaging
The adenosine sensor cells were seeded onto coverslips coated with 1 μg/ml poly-D-lysine, and incubated at 30°C for 45 min with 7.5 μM Fura2AM (Dojin, Kumamoto, Japan) or Rhod-4AM (AAT Bioquest, Inc. CA) in basal salt saline (BSS, 129 mM NaCl, 4 mM KCl, 1 mM MgCl2, 10 mM D-glucose, 2 mM CaCl2, 10 mM Hepes, pH 7.4). After being loaded with a calcium indicator, the cells were maintained in BSS containing 100 μM sulfinpyrazone, which blocks the sequestration of calcium indicator (Di Virgilio et al. 1990). Slices were placed directly onto the cells and held by the threads of a hand-made platinum slice anchor. The distances between the slices and the cells were adjusted so as to make both visible in the same focal plane (e.g. Fig 2B; Slice and Fura2). Fluorescence images were obtained every 3 seconds using an inverted microscope (IX-70, Olympus, Tokyo, Japan), equipped with an objective (UApo/340 20×/0.75, Olympus), a filter exchanger (OSP-EXA, Olympus) and a cooled-CCD camera (Orca-R2, Hamamatsu Photonics, Hamamatsu, Japan), The R340/380 ratio of Fura2AM fluorescence and the F/F0 ratio of Rhod4AM fluorescence were analyzed using Image J software. Slices and adenosine sensor cells were superfused at 30°C with BSS or aCSF at a perfusion rate of 5 ml/min. Electrical stimulation was provided by glass electrodes filled with aCSF. For KCl stimulation, which was used as an alternative to electrical stimulation to reduce the volume of expensive chemicals, slices and the adenosine sensor cells were incubated in a chamber of approximately 2 mL volume and equipped with a heater and aerator, followed by the sequential dropwise addition of KCl and adenosine, to achieve the final concentrations indicated. For hypoosmotic treatment, slices and adenosine sensor cells were pretreated for 20 min with modified aCSF, in which two-thirds of the NaCl concentration was replaced by sucrose of the same osmolality, followed by a reduction in osmolality from 354 to 195 mOsm/L by reducing sucrose concentration.
Figure 2.
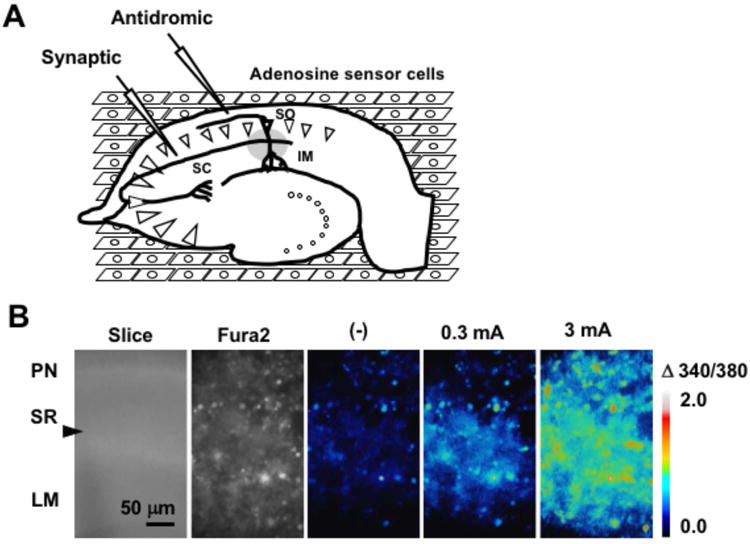
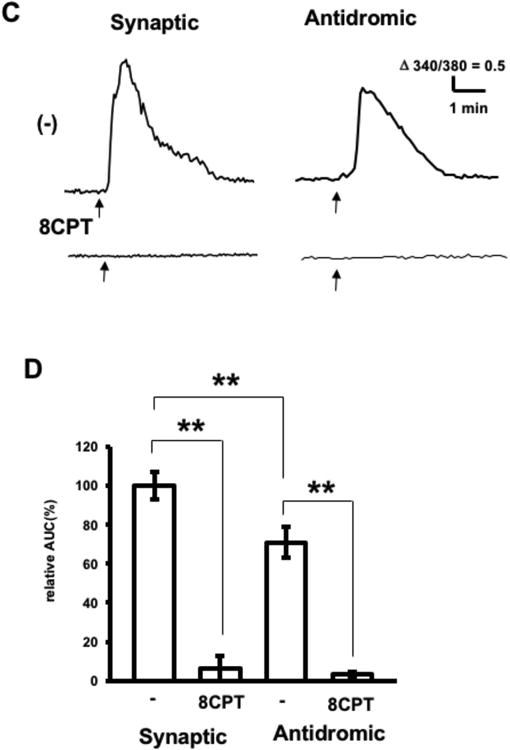
Electrically-induced adenosine release by hippocampal slices. A. Experimental diagram. SC, Schaffer collateral; SO, Striatum oriens; IM, Imaging area of the inverted microscope (gray circular area). The stimulating electrode was placed on the SC for synaptic stimulation (Synaptic) or on the SO for antidromic stimulation (Antidromic). B. Calcium responses of adenosine sensor cells to synaptic stimulation. Bright field image of a hippocampal slice above the adenosine sensor cells (Slice). PN; Pyramidal neurons in the CA1 region; SR, Stratum radiatum; LM, Stratum lacunosum moleculare. The stimulating glass electrode was placed as indicated by the arrowhead. Fura2 fluorescence image of the adenosine sensor cells (Fura2). Ratio of the image (340 nm/380 nm) before stimulation (-), and 15 sec after high-frequency electrical stimulation (30 Hz for 5 sec) at 0.3 mA or 3 mA. C. Representative calcium increases in adenosine sensor cells in response to synaptic or antidromic stimulation (3 mA, 30 Hz for 5 sec, arrow) in the absence or presence of 8CPT (pretreatment 20 min). D. Average calcium increases in adenosine sensor cells in response to synaptic or antidromic stimulation, with results normalized to response to synaptic stimulation in the absence of 8CTP. Each n= 29–47 cells from 3–5 experiments, **p < 0.01, t-test.
Statistical analysis
Florescence data were obtained for individual cells. Cells were randomly selected for statistical analysis in Figures 1 and 4B. In measuring adenosine release from slices (Figs. 2–7, except for Fig. 4B), adenosine sensor cells subjected to quantitative analysis were randomly selected from those responding to control electrical stimulation (3 mA, 30 Hz for 5 sec), which was applied in aCSF prior to test stimulation. Each slice was subjected to one set of control and test stimulations. Values are expressed as mean ± SD and compared by Student's t tests (Microsoft Excel) or Dunnett's multiple comparison test (JSTAT), as indicated, with differences having a probability (p) < 0.05 considered statistically significant.
Figure 1.
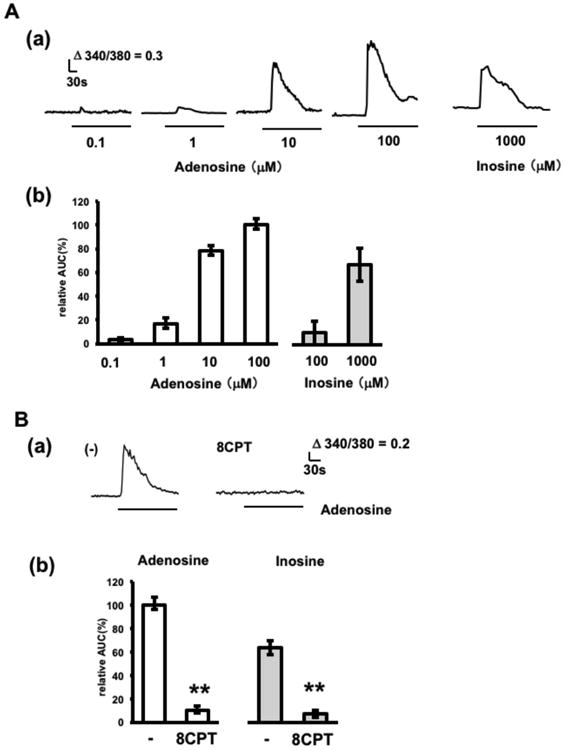
Adenosine- and inosine-induced calcium elevations in adenosine sensor cells. A. Concentration dependent effects of adenosine and inosine. (a) Representative calcium increases in response to 0.1-100 μM adenosine and 1000 μM inosine. (c) Average calcium increases (n=29–40 cells from 3–-4 experiments). Cells were stimulated with adenosine or inosine at the concentrations indicated. The relative area under the curve during stimulation (relative AUC) was calculated by normalizing to the calcium increase achieved by 100 μM adenosine. B. Effect of an A1 receptor antagonist. Cells were stimulated with 10 μM adenosine or 1000 μM inosine in the presence or absence of 1 μM 8CPT. 8CPT treatment was started 5 min prior to stimulation with adenosine and continued during stimulation (pretreatment; 5 min). (a) Representative adenosine-induced calcium increases in the presence or absence of 8CPT. (b) Average calcium increases (n= 30–40 cells from 3–4 experiments). Relative AUC was calculated by normalizing to the calcium increase to adenosine in the absence of blocker. **p < 0.01, t-test.
Figure 4.
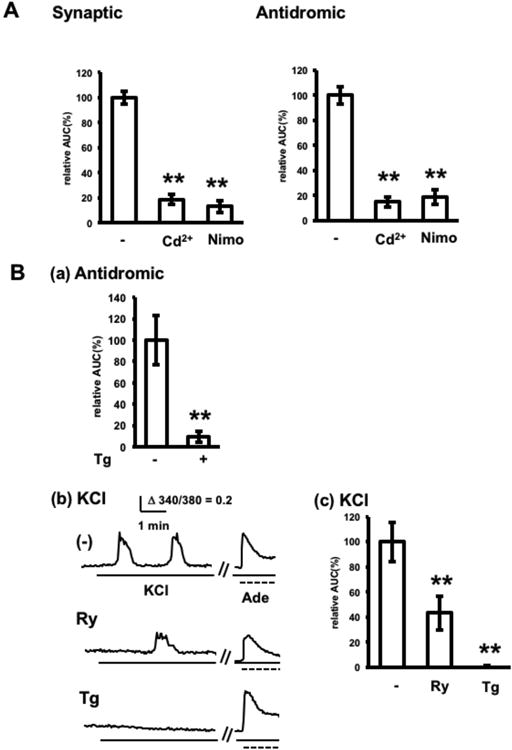
Involvement of L-type calcium channels and CICR in electrically-induced adenosine release. A. Pharmacologic inhibition of calcium channels. Adenosine release in response to synaptic or antidromic stimulation in the absence or presence of 100 μM Cd2+ (pretreatment; 10 min) or 50 μM nimodipine (Nimo, pretreatment; 30 min). n= 23–30 cells from 3–4 experiments, **p < 0.01, Dunnett's multiple comparison test with control. B. Pharmacologic inhibition of CICR. (a) Adenosine release by normal and thapsigargin-treated (Tg, 1 μM) slices in response to antidromic stimulation. Slices were treated with 1 μM thapsigargin for 15 min, washed three times with normal aCSF, and placed onto adenosine sensor cells in normal aCSF for electrical stimulation. n= 30 cells from 3 experiments, **p < 0.01, t-test. (b) Effects of ryanodine and thapsigargin on adenosine release in response to KCl stimulation. Representative calcium increases in adenosine sensor cells. Adenosine release was induced by bath application of KCl (final concentration, 25 mM) as indicated by solid lines, and the lack of effect of ryanodine and thapsigargin on the adenosine response of adenosine sensor cells was confirmed by bath applications of adenosine (final concentration, 10 μM) at the end of the experiment (dashed line). Ryanodine treatment (Ry, 20 μM) was started 30 min prior to KCl stimulation. Thapsigargin was used as in Fig 4B(a). (c) Average KCl-induced calcium increases in adenosine sensor cells in the presence or absence of ryanodine or thapsigargin. Each n= 30 cells from 3 experiments, **p < 0.01, Dunnett's multiple comparison test with control.
Figure 7.
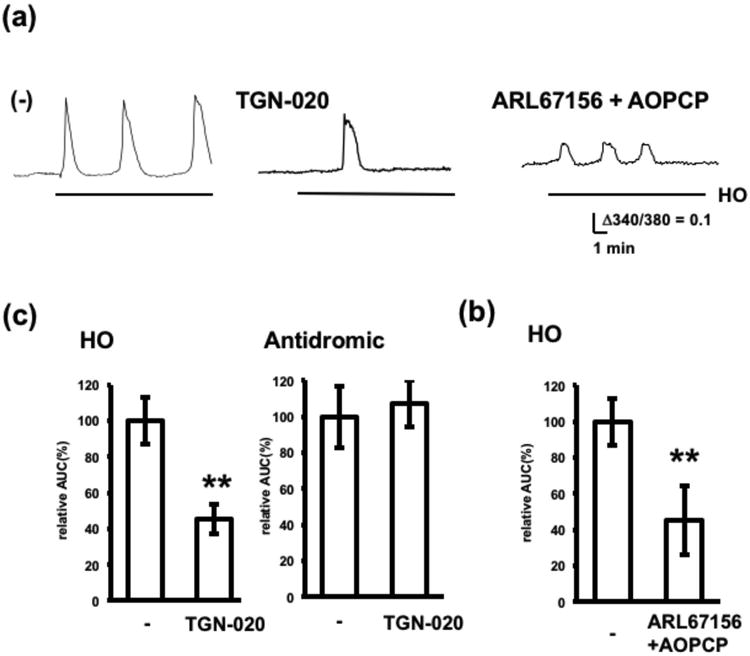
Involvement of AQP-4 and ectonucleotidases in hypoosmotically-induced adenosine release. Adenosine release induced by hypoosmotic conditions or antidromic stimulation was measured in the presence or absence of 100 μM TGN-020 (pretreatment; 20 min) or the mixture of ARL67156, AOPCP and PPADS (pretreatment; 15 min). (a) Representative calcium increases in the adenosine sensor cells. (b) Effects of TGN-020 on hypoosmotically- and antidromically-induced adenosine release. Average calcium increases. n= 20–30 cells from 3 experiments. **p < 0.01, t-test. (c) Effect of ARL67156 and AOPCP on hypoosmotically-induced adenosine release. Average calcium increases. n= 20–30 cells from 3 experiments. **p < 0.01, t-test.
Chemicals
Unless otherwise indicated, all chemicals were purchased from Nacalai Tesque (Kyoto, Japan). Hepes, sulfinpyrazone, 8-cyclopentyltheophylline (8CPT), thapsigargin, S-(4-nitrobenzyl)-6-thioinosine (NBTI), dipyridamole, 4-aminopyridine, TGN-020 and CdCl2 were purchased from Sigma Aldrich (St. Louis, MO). 6-Cyano-7-nitroquinoxaline-2,3-dione (CNQX), ARL67156, (2R)-amino 5-phosphonovaleric acid (D,L-APV) and pyridoxalphosphate-6-azophenyl-2′,4′-disulfonic acid (PPADS) were from TOCRIS (Avonmouth, UK), and ryanodine was from Wako Chemical (Tokyo, Japan).
Results
Characterization of adenosine sensor cells
The intracellular calcium response of adenosine sensor cells, established as described in the Materials and Methods section, following exposure to adenosine or inosine, which had been reported to bind A1 receptor with an affinity similar to adenosine (Nascimento et al. 2015), was examined (Fig. 1A). At concentrations of 0.1–100 μM, adenosine induced a concentration dependent elevation in intracellular calcium, with an EC50 value of 8.0 μM. In comparison, inosine, at concentrations above 100 μM, induced detectable calcium elevation, with the calcium elevation in response to a saturating concentration of inosine (1000 μM) being 67% that induced by 100 μM adenosine. An A1 receptor antagonist, 1 μM 8CPT, blocked 90% and 88% of calcium elevations induced by 10 μM adenosine and 1000 μM inosine, respectively (Fig. 1B), indicating that calcium elevation in response to adenosine and inosine was mediated by A1 receptors. These results indicate that calcium imaging of adenosine sensor cells can detect adenosine at concentrations over 0.1 μM and inosine at concentrations over 100 μM. Since adenosine release accompanying adenosine pool depletion has been reported to increase adenosine concentration at the surface of hippocampal slices to approximately 50 μM, as measured by calibrated enzymatic electrodes, and the elevation in response to inosine does not exceed that in response to adenosine (Dale et al. 2000, Pearson et al. 2001), adenosine sensor cells likely detect adenosine, but not inosine, even during maximum adenosine release from hippocampal slices.
Electrically-induced extracellular adenosine elevation in hippocampal slices
Rat hippocampal slices were placed onto Fura2A-loaded adenosine sensor cells, and elevations in extracellular adenosine in the CA1 region in response to high frequency electrical stimulation of the Schaffer collateral (synaptic stimulation) or Striatum oriens (antidromic stimulation) were measured by calcium imaging with an inverted microscope (Fig. 2A). High-frequency synaptic stimulation (30 Hz, 5 sec) with a glass electrode increased calcium in the adenosine sensor cells, with both the area and magnitude of calcium response increased by increasing the stimulation intensity from 0.3 mA to 3 mA (Fig. 2B). In subsequent experiments, electrical stimulation was applied at 3 mA, which reliably induced adenosine sensor cell responses. To determine whether the source of adenosine was presynaptic terminals or postsynaptic neurons, adenosine release from slices in response to synaptic and antidromic stimulation was compared. Calcium elevations in response to both synaptic and antidromic stimulations lasted several minutes and were completely blocked by 8CPT (Fig. 2C). The response of adenosine sensor cells was 30% lower to antidromic than to synaptic stimulation, with both responses blocked more than 90% by 8CPT (Fig. 2D). Thus, both synaptic and antidromic stimulation induce substantial calcium responses of adenosine sensor cells, which were pharmacologically confirmed as reflecting adenosine release from hippocampal slices. The ability of the adenosine sensor cells to detect adenosine releases from these slices was further confirmed by the lack of increased calcium in HEK293 cells negative for expression of A1 receptor and Gqi5 (data not shown). Blocking glutamatergic synapses with 10 μM CNQX and 100 μM D,L-APV significantly reduced adenosine release in response to synaptic stimulation by 62%, while not affecting adenosine release in response to antidromic stimulation (Fig. 3). Because synaptic stimulation excites presynaptic axons and terminals, followed by postsynaptic CA1 pyramidal neurons via glutamatergic synapses, whereas antidromic stimulation directly excites pyramidal neurons, these results indicate that electrically-induced adenosine release is due primarily to the excitation of pyramidal neurons, and does not require glutamate receptor activation. The findings, that response to synaptic stimulation was greater than the response to antidromic stimulation and that CNQX and D,L-APV did not completely inhibit adenosine release in response to synaptic stimulation, suggest that synaptic stimulation induces release from presynaptic and glial components, as well as from pyramidal neurons. However, this was unlikely, because synaptically- and antidromically-induced adenosine releases were found to be mediated by a mechanism in pyramidal neurons, in that these releases were similarly blocked by L-type calcium channel blockers as described later. Thus, it is more likely that synaptic stimulation induced greater adenosine release than antidromic stimulation because synaptic stimulation excites adenosine release sites of pyramidal neurons, presumably dendrites more effectively than antidromic stimulation when applied at the same intensity. In addition, high-frequency synaptic stimulation may have activated muscarinic and/or APV-insensitive extrasynaptic NMDA receptors and caused subsequent depolarization (Suzuki et al. 2008, Fraser & MacVicar 1996) during CNQX- and D,L-APV-insensitive adenosine release.
Figure 3.
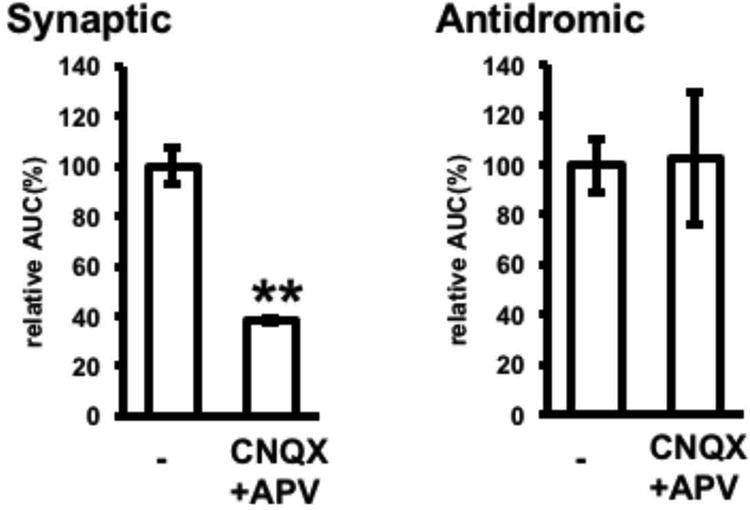
Effects of glutamate receptor antagonists on electrically-induced adenosine release. Adenosine release in response to synaptic or antidromic stimulation was assessed in the absence or presence of 10 μM CNQX and 100 μM D,L-APV. n= 30–49 cells from 3–5 experiments, **p < 0.01, t-test
L-type calcium channels and calcium-induced calcium release are involved in electrically-induced extracellular adenosine elevation
In characterizing extracellular adenosine elevation by adenosine sensor cells, the ability of each pharmacological agent to inhibit adenosine-induced calcium increases was assessed by exposing the cells to adenosine in the presence of each agent (e.g., Fig. 4B(b)), thus excluding agents that significantly alter calcium elevations in these cells. The calcium dependence of electrically-induced adenosine release was assessed by using cadmium, a non-selective calcium channel blocker, and nimodipine, a blocker of L-type calcium channels, the major subtype of voltage-gated calcium channels on the dendrites of CA1 pyramidal neurons (Hell et al. 1993). Synaptically- and antidromically-induced adenosine releases were blocked 84% and 82%, respectively, by 100 μM cadmium and 87% and 79%, respectively, by 50 μM nimodipine (Fig. 4A). These results indicated that L-type calcium channels of pyramidal neurons are essential for electrically-induced adenosine release. Subsequent pharmacological analysis focused on adenosine release by antidromic stimulation, which directly excites pyramidal neurons. As activation of L-type calcium channels and subsequent calcium-induced calcium release (CICR) have been reported to induce dendritic exocytosis (Kolarow et al. 2007), the involvement of CICR in electrically-induced adenosine release was assessed using thapsigargin, an irreversible sarco-endoplasmic calcium ATPase inhibitor, and ryanodine, an intracellular calcium channel blocker. Treatment of brain slices with thapsigargin prior to placement onto adenosine sensor cells blocked antidromically-induced adenosine release by 90% (Fig. 4B(a)). To assess the effect of ryanodine, adenosine release was induced by KCl as described in the Materials and Methods section, rather than by electrical stimulation. KCl-induced oscillatory adenosine release was inhibited 57% by 20 μM ryanodine and 100% by thapsigargin (Fig. 4B (b), (c)). In addition, treatment with adenosine after KCl stimulation elevated calcium in adenosine sensor cells, even in the presence of ryanodine, or when placed below slices pre-treated with thapsigargin, indicating that the ability of adenosine sensor cells to respond to adenosine was preserved under these conditions (Fig. 4B(b)). As both KCl- and antidromically-induced adenosine releases were similarly blocked by thapsigargin, these adenosine releases are equivalent in involving calcium release. In addition, the inhibition by ryanodine suggests that CICR is the calcium release required for adenosine release following neuronal excitation.
As similar electrically-induced adenosine release in hippocampal slices has been reported to result from ATP release and its subsequent extracellular breakdown by ectonucleotidases (Heinrich et al. 2012, Cunha et al. 1996), the effects of the ectonucleotidase inhibitors, ARL67156 and AOPCP on KCl-induced adenosine release were evaluated. Slices were treated with a mixture of 100 μM ARL67156 and 100 μM AOPCP in the presence of 30 μM PPADS, a non-selective purinergic antagonist, because inhibition of ectonucleotidases may result in the accumulation of extracellular ATP and subsequent ATP-induced calcium elevations in adenosine sensor cells. The finding, that ARL67156 and AOPCP did not inhibit KCl-induced adenosine release (Fig. 5(a)), indicated that adenosine, rather than ATP, was released in response to antidromic stimulation.
Figure 5.
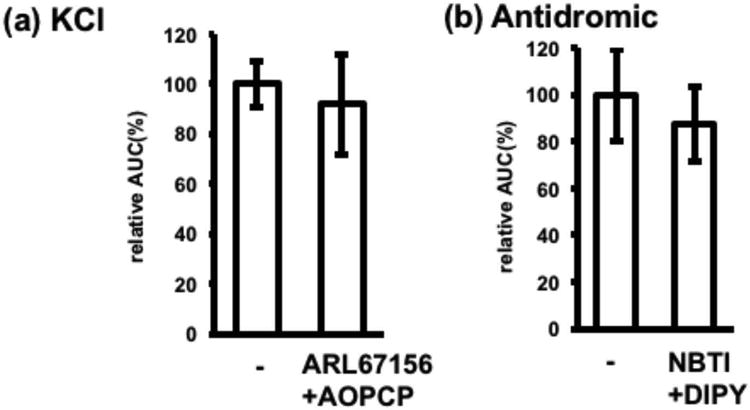
Lack of involvement of ectonucleotidases and equilibrate nucleoside transporter (ENT) in electrically-induced adenosine release. (a) KCl-induced adenosine release in the absence or presence of 100 μM ARL67156 and 100 μM AOPCP (pretreatment; 15 min). As the inhibition of ectonucleotidases may cause extracellular ATP build-up and ATP-induced calcium increase in adenosine sensor cells, a P2 receptor antagonist, 30 μM PPADS, was added to the extracellular solution. Each n= 30 cells from 3 experiments, **p < 0.01, t-test. (b) Adenosine release in response to antidromic stimulation in the absence or presence of 5 μM NBTI and 10 μM DIPY (pretreatment; 30 min). As DIPY has autofluorescence blocking ultraviolet excitation of Fura2AM, Rhod4AM was used. Each n=28–34 cells from 3–4 experiments. **p < 0.01, t-test.
Activity dependent adenosine release may be a consequence of ATP consumption, occurring after excretion of metabolically accumulated adenosine through equilibrate nucleoside transporter (ENT) (Wall & Dale 2013, Lovatt et al. 2012). Therefore, the ability of the ENT blockers, NBTI and dipyridamole (DIPY), to inhibit adenosine release was tested. A mixture of 5 μM NBTI and 10 μM DIPY, however, did not block adenosine release induced by antidromic stimulation (Fig. 5(b)), indicating that electrically-induced adenosine release does not involve ENT.
Extracellular adenosine elevation following astrocyte swelling
Inasmuch as astrocytes release nucleic acids and amino acids following swelling in vitro (Haskew-Layton et al. 2008, Liu et al. 2008), adenosine release was assessed in slices exposed to a hypoosmotic condition, as described in the Materials and Methods section, or to potassium channel blockers, which induce astrocyte swelling. Prior to slice experiments, the inabilities of hypoosmotic conditions and potassium channel blockers to induce calcium increases in adenosine sensor cells were confirmed. Exposure to hypoosmotic conditions induced oscillatory adenosine release, which was not detected in the presence of 8CPT and was not affected by cadmium (Fig. 6A), indicating that hypoosmotic treatment induces adenosine release by a pathway distinct from that induced by electrical stimulation. Exposure to the potassium channel blockers, tetraethylammonium (TEA), 4-aminopyridine (4-AP) and barium, which depolarize and swell astrocytes (O'Connor et al. 1993), induced oscillatory adenosine release, which was not detected in the presence of 8CPT (Fig. 6B). Cadmium significantly increased TEA-induced adenosine release by 60%, with similar results observed in response to other potassium channel blockers. Thus, adenosine release in response to treatments known to swell astrocytes is distinct from release in response to electrical activities of neurons.
Figure 6.
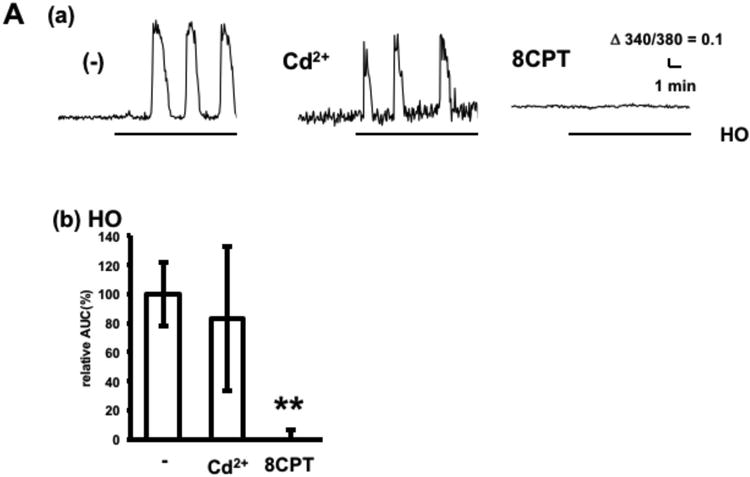
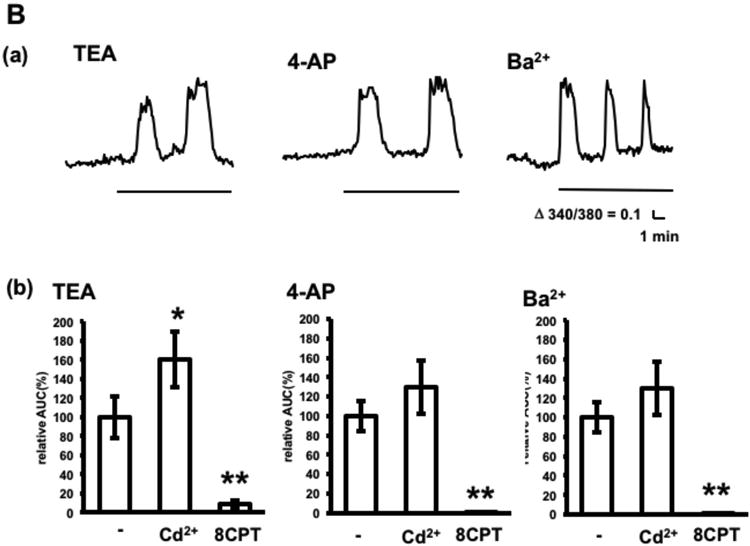
Adenosine release by treatments known to swell astrocytes. A. Calcium increases in adenosine sensor cells below hippocampal slices following hypoosmotic treatment (HO) in the absence or presence of 100 μM Cd2+ or 1 μM 8CPT. (a) Representative calcium increases in adenosine sensor cells. (b) Average calcium increases. n= 18–30 cells from three experiments. B. Adenosine release in response to potassium channel blockers. Slices were treated with 25 mM TEA, 100 μM 4-AP or 6 mM Ba2+ for 10 min in the presence or absence of 100 μM Cd2+ or 1 μM 8CPT. (a) Representative calcium increases in adenosine sensor cells following treatment with potassium channel blockers. (b) Average calcium increases. n= 29–39 cells from 3–4 experiments. *p < 0.05, **p < 0.01, Dunnett's multiple comparison test with control.
Adenosine release in response to hypoosmotic conditions was further characterized by using an AQP-4 blocker, TGN-020. At a concentration of 100 μM, TGN-020 significantly reduced hypoosmotically-induced adenosine release by 59%, but did not affect antidromically-induced adenosine release (Fig. 7). As AQP-4 expression is specific to astrocytes in the brain, these results confirmed that astrocyte swelling is involved in adenosine release in response to hypoosmotic treatment, but not to electrical stimulation. Because extracellular breakdown of ATP derived from astrocytes may increase extracellular adenosine in the hippocampus (Pascual et al. 2005, Wall & Dale 2013), the effect of ARL67156 and AOPCP on adenosine release in response to hypoosmotic treatment was analyzed. ARL67156 and AOPCP significantly reduced hypoosmotically-induced adenosine release by 55%, indicating that adenosine release in response to hypoosmotic treatment involves ATP breakdown by ectonucleotidases. Collectively, these results suggest that astrocyte swelling increases extracellular adenosine through a mechanism involving ATP release and subsequent breakdown. The partial inhibition by TGN-020 and by ARL67156 and AOPCP suggests that the adenosine release induced by hypoosmotic conditions was not exclusively derived from ATP released by swelling astrocytes, but from other pathways involving neurons and vasculature.
Discussion
The adenosine sensor cell, in which intracellular calcium was increased in response to extracellular adenosine concentrations above 0.1 μM, allowed the detection of adenosine release from hippocampal slices in response to various conditions. The present pharmacological characterization suggests two distinct pathways for elevating extracellular adenosine; adenosine release from postsynaptic neurons following electrical activities in a manner depending on L-type calcium channels and CICR, and ATP release from swollen astrocytes and subsequent enzymatic breakdown to adenosine.
Measurement of extracellular adenosine elevation by adenosine sensor cells
The EC50 of adenosine for inducing calcium increase by adenosine sensor cells, which were HEK293 cells stably expressing mouse A1 receptor and Gqi5, was 8.0 μM. In comparison, the EC50 of adenosine for inducing calcium increase by HEK293 cells transiently expressing human A1 receptors and mouse Gqi5 was 1.4 μM (Rittiner et al. 2012), whereas the EC50 of adenosine for activating potassium current of arterial myocytes via A1 receptors was 3.1 μM (Ragazzi et al. 1991). Thus, the potency of adenosine to elicit responses of adenosine sensor cells was slightly lower, presumably reflecting the different levels of expression of receptor and G protein. The minimum adenosine concentration that increased calcium in adenosine sensor cells was 0.1 μM. Extracellular adenosine concentrations have been reported to be 0.2–2 μM in electrically-stimulated thalamic slices (Bekar et al., 2008), 1-2 μM in hippocampal slices prepared from sleeping mice (Schmitt et al. 2012) and 10 μM in hippocampal slices stimulated with 25 mM KCl (Heinrich et al., 2012). Thus, adenosine sensor cells are able to detect adenosine release from brain tissue.
Inosine had much lower potency than adenosine in inducing calcium increase in adenosine sensor cells, consistent with findings using HEK293 cells transiently expressing human A1 receptor and mouse Gqi5 (Rittiner et al. 2012). This is the advantage of adenosine sensor cells over enzymatic electrodes, which cannot distinguish adenosine from inosine. Extracellular elevation of inosine is reported to be smaller than hypoxia-induced adenosine release, which was 9.1 μM (Dale et al. 2000) or negligible during adenosine release following electrical stimulation (Wall & Dale 2013). Hypoxic treatment combined with the removal of extracellular calcium induced robust adenosine release (approximately 50 μM) and depleted the adenosine pool (Dale et al. 2000, Pearson et al. 2001). Thus, adenosine sensor cells, in which calcium was elevated in response to inosine concentrations above 100 μM, allows the selective detection of adenosine without interference by inosine.
To analyze the dynamics of extracellular adenosine in brain tissue preparations, calcium increases in adenosine sensor cells placed beneath the hippocampal slices were imaged. Slices in direct contact with the adenosine sensor cells did not likely impede the flow of extracellular solution around the cells or cause artifactual changes, including hypoxic adaptation, because bath-applied adenosine induced rapid responses in adenosine sensor cells. Moreover, a similar biosensor cell approach successfully measured ischemia-induced glutamate release from brain slice preparations (Uchino et al. 2001). The spatial resolution of this method, which is limited by the size of the adenosine sensor cells, was sufficient to assess the influence of stimulus intensity on the distribution of adenosine increases. The temporal resolution of the present study was set to obtain 340 nm/380 nm ratio images of Fura2-loaded adenosine sensor cells every 3 sec (0.33 Hz). The time dependent changes in extracellular adenosine reflected in the intracellular calcium of individual cells were equivalent to those in previous studies using enzyme-based biosensor electrodes (Wall & Dale 2013, Klyuch et al. 2011). Other studies estimating extracellular adenosine by electrophysiological analysis of synaptic responses reported that even a single electrical stimulation changes the modulation of synaptic responses to adenosine (Mitchell et al. 1993), and that extracellular ATP is converted to adenosine within about 100 msec (Dunwiddie et al. 1997). Single electrical stimulations did not induce responses of adenosine sensor cells (data not shown), a situation similar to that in which enzyme-based biosensor electrodes detected adenosine release following a single electrical stimulation only in the presence of the potassium channel blocker, 4-AP (Klyuch et al. 2011), which induced adenosine release by itself in our study. Thus, neuronal activities are thought to be affected by more localized and faster changes in extracellular than tissue adenosine, as measured by adenosine sensor cells and enzyme-based biosensor electrodes. The adenosine sensor cell is a novel and powerful tool to better understand the role of tissue adenosine, which likely underlies sleep, cerebral circulation and inflammation.
Electrically-induced extracellular adenosine elevation
Electrical stimulation of the hippocampal CA1 region increased extracellular adenosine for several minutes. Glutamate receptor antagonists reduced adenosine release by synaptic stimulation, indicating that excitation of postsynaptic pyramidal neurons is involved in electrically-induced adenosine release. Antidromic stimulation, which directly excites pyramidal neurons, induced the release of adenosine insensitive to glutamate receptor antagonists, indicating that excitation of pyramidal neurons induces adenosine release without glutamate receptor activation. A previous study using enzymatic electrodes showed that hippocampal adenosine release in response to synaptic stimulation was completely blocked by the same glutamate receptor antagonists (Wall & Dale 2013). The results of this representative study using enzymatic electrodes suggest that synaptic stimulation induces neuronal adenosine release by ENT, which was pharmacologically excluded in the present study, and astrocyte ATP release, and both neuronal and astrocytic releases were in a glutamate receptor dependent manner. The discrepancy between this earlier report and our results may be due to the difference in experimental conditions, as well as in methodology. Especially, temperature was higher in experiments using enzymatic electrodes (34–36 °C), than in the present study (30 °C). Higher temperatures were avoided, because significant spontaneous calcium increases in adenosine sensor cells interfered with measurements above 30 °C. These spontaneous calcium increases were presumably due to temperature-dependent increases in ambient adenosine, which also interferes the measurement of postsynaptic potential via A1 receptors under similar high temperature conditions (Masino & Dunwiddie 1999, Masino et al. 2001). The fluctuation of ambient adenosine may be too slow or too localized to be detected by enzymatic electrodes; thus experiments using enzymatic electrodes prefer higher temperatures to increase adenosine release, presumably from ENT. Astrocytes may release ATP in response to synaptic stimulation (Wall and Dale 2013), as shown using a transgenic mouse line expressing dominant negative SNARE, in an astrocyte selective manner (Pascual et al. 2005). However, this astrocytic component of adenosine release may reflect neuronal exocytosis, which was recently shown to be affected in this mouse cell line (Fujita et al. 2014).
The present study showed that electrically-induced adenosine release was inhibited by blocking L-type calcium channels or CICR. The exocytosis of brain-derived neurotrophic factor from dendrites of cultured neurons is also mediated by the same L-type calcium channels and CICR (Kolarow et al. 2007), suggesting that similar dendritic exocytosis underlies electrically-induced adenosine release. Exocytosis of adenosine is supported by findings showing synaptophysin-positive vesicles containing concentrative nucleoside transporter 2, which is responsible for adenosine accumulation in vesicles (Melani et al. 2012) and the presence of adenosine in the synaptic vesicle fraction (Corti et al. 2013).
As antidromically-induced adenosine release is not affected by the AQP-4 blocker, it does not involve ATP release following astrocyte swelling. However, astrocytes may contribute to electrically-induced adenosine release by an as yet unknown pathway. We examined this possibility by using a gliatoxin, fluoroacetate, which had been used to exclude the contribution of astrocyte ATP release to electrically-induced adenosine release measured with an enzymatic electrode (Wall & Dale 2013). However, as previously reported this agent alone increased ambient adenosine concentration (Canals et al. 2008) and significantly interfered with the measurement of evoked extracellular adenosine elevation by adenosine sensor cells (data not shown). Thus, the contribution of astrocytes to electrically-induced extracellular adenosine elevation has yet to be determined.
A previous study reported that the accumulation of extracellular adenosine and inosine in hippocampal slices during 5 min electrical stimulation at 10 Hz was reduced by blocking N- or P-type calcium channels (Latini et al. 1997). In this study, L-type calcium channels were involved only in the presence of an L-type calcium channel activator, BayK-8644. Thus, the higher frequency (30 Hz) used in the present study is likely required to activate L-type calcium channel dependent postsynaptic adenosine release. In contrast, the presynaptic pathway for elevating extracellular adenosine, which was suggested to be the N- and P-type calcium channel dependent component (Latini et al. 1997), in response to brief (5 sec) stimulation, was negligible in the present study. Thus, a single electrical stimulation and brief high-frequency stimulation, presumably resulting in rapid rundown of presynaptic activities, have little effect on extracellular adenosine, whereas continuous activation of presynaptic terminals results in the substantial accumulation of adenosine. The lack of a presynaptic component in the present study is consistent with studies using enzymatic electrodes. In those studies, electrically-induced elevation of extracellular adenosine was largely attributed to postsynaptic neurons and astrocytes in the hippocampus (Wall & Dale 2013), and to presynaptic termini in the cerebellum (Klyuch et al. 2012).
Extracellular adenosine elevation following astrocyte swelling
Hypoosmotic treatment and potassium channel blockers, which have been shown to cause astrocyte swelling, induced adenosine release in a manner independent of calcium channels. The ability of an AQP-4 blocker to inhibit adenosine release induced by hypoosmotic conditions suggests that water influx and subsequent swelling of astrocytes are most likely involved in calcium channel independent adenosine release. The cocktail of ectonucleotidase inhibitors reduced the elevation of extracellular adenosine in response to hypoosmotic conditions but not to electrical stimulation, suggesting that the elevation in extracellular adenosine in response to hypoosmotic conditions involved ATP release. Although several studies have shown that swelling of cultured astrocytes in response to hypoosmotic conditions or high (>50 mM) KCl results in the release of various nucleic acids and amino acids (O'Connor & Kimelberg 1993, Liu et al. 2008, Rutledge & Kimelberg 1996, Thrane et al. 2011), the physiological implications of this release have not yet been fully addressed. Evidence showing that deficient exocytosis of astrocytes leads to low ambient adenosine, especially during sleep (Schmitt et al. 2012), is not necessarily incompatible with the present results, because exocytosis-related cellular machinery for membrane trafficking is presumably required to maintain plasma membranes during swelling.
Implications of multiple pathways for elevating extracellular adenosine
Adenosine signaling is involved in diverse physiological functions and pathological processes, including circulation, angiogenesis, metabolism, immune function and inflammatory diseases, neuronal activities, and neurological and psychiatric disorders (Fredholm et al. 2005, Gomes et al. 2011). Thus, adenosine and caffeine, a non-selective adenosine receptor antagonist, are used clinically (Mosqueda-Garcia 1992, Sawynok 1995), and a number of drugs are in development targeting this signaling pathway (Chen et al. 2013b). However, widespread adenosine signaling hampers specific clinical applications of adenosine receptor ligands. Thus, modulating mechanisms regulating extracellular adenosine concentration are alternative therapeutic options. Indeed, the effects of several clinically-applied drugs, including methotrexate and dipyridamole, may be due in part to alterations in extracellular adenosine concentration, and deep brain stimulation has been shown to reduce tremor by stimulating ATP/adenosine release (Bekar et al. 2008). Thus, further understanding of the dynamics and underlying regulatory mechanisms of tissue adenosine is expected to provide future therapeutic targets in adenosine signaling. Basic research and drug discovery in this field will be accelerated by detection of tissue adenosine by adenosine sensor cells.
The present study, involving the pharmacological analysis of extracellular adenosine elevations in response to various conditions, showed that distinct pathways regulate extracellular adenosine. It is noteworthy that extracellular adenosine elevation in response to electrical stimulation depends on dendritic calcium, rather than synaptic transmission. These findings implies that extracellular adenosine reflects activities in the neuronal network and regulates information processing of neuronal circuits.
Acknowledgments
This work was supported by grants from the NIH/NCRR Centers of Biomedical Research Excellence (PR15636), the Department of Neurosurgery, University of New Mexico, USA, a Grant-in-Aid for Scientific Research on the Innovative area ‘Cellular and Molecular Basis for Neurovascular wiring’ (#23122513, Japan), a Grant-in-Aid for Scientific Research (B) (#23300133, Japan), the Smoking Research Foundation (Japan) and the Takeda Science Foundation (Japan). We thank Dr. Takayuki Suzuki (RIKEN, Japan) for technical support and Dr. John A. Connor and Dr William C. Shuttleworth (University of New Mexico) and Mamiko Ozaki (Kobe Univ) for scientific discussions.
Abbreviations
- AOCPC
αβ-methylene-ADP
- aCSF
artificial cerebrospinal fluid
- 4-AP
4-aminopyridine
- APV
(2R)-amino 5-phosphonovaleric acid
- AQP-4
aquaporin 4
- CICR
calcium-induced calcium release
- CNQX
6-cyano-7-nitroquinoxaline-2,3-dione
- CNS
central nervous system
- DIPY
dipyridamole
- ENT
equilibrate nucleoside transporter
- NBTI
S-(4-nitrobenzyl)-6-thioinosine
- PPADS
pyridoxalphosphate-6-azophenyl-2′,4′-disulfonic acid
- TEA
tetraethylammonium
Footnotes
ARRIVE guidelines have been followed: All experiments were conducted in compliance with the ARRIVE guidelines.
Conflicts of interest: The authors have no conflict of interest to declare.
The authors declare there are no conflicts of interest.
References
- Andresen BT, Gillespie DG, Mi Z, Dubey RK, Jackson EK. Role of adenosine A(1) receptors in modulating extracellular adenosine levels. J Pharmacol Exp Ther. 1999;291:76–80. [PubMed] [Google Scholar]
- Baldwin SA, Beal PR, Yao SY, King AE, Cass CE, Young JD. The equilibrative nucleoside transporter family, SLC29. Pflugers Arch. 2004;447:735–743. doi: 10.1007/s00424-003-1103-2. [DOI] [PubMed] [Google Scholar]
- Bekar L, Libionka W, Tian GF, et al. Adenosine is crucial for deep brain stimulation-mediated attenuation of tremor. Nat Med. 2008;14:75–80. doi: 10.1038/nm1693. [DOI] [PubMed] [Google Scholar]
- Belardinelli L, Shryock JC, Snowdy S, Zhang Y, Monopoli A, Lozza G, Ongini E, Olsson RA, Dennis DM. The A2A adenosine receptor mediates coronary vasodilation. J Pharmacol Exp Ther. 1998;284:1066–1073. [PubMed] [Google Scholar]
- Boison D. Adenosine and epilepsy: from therapeutic rationale to new therapeutic strategies. Neuroscientist. 2005;11:25–36. doi: 10.1177/1073858404269112. [DOI] [PubMed] [Google Scholar]
- Canals S, Larrosa B, Pintor J, Mena MA, Herreras O. Metabolic challenge to glia activates an adenosine-mediated safety mechanism that promotes neuronal survival by delaying the onset of spreading depression waves. J Cereb Blood Flow Metab. 2008;28:1835–1844. doi: 10.1038/jcbfm.2008.71. [DOI] [PubMed] [Google Scholar]
- Chen J, Tan Z, Zeng L, et al. Heterosynaptic long-term depression mediated by ATP released from astrocytes. Glia. 2013a;61:178–191. doi: 10.1002/glia.22425. [DOI] [PubMed] [Google Scholar]
- Chen JF, Eltzschig HK, Fredholm BB. Adenosine receptors as drug targets--what are the challenges? Nat Rev Drug Discov. 2013b;12:265–286. doi: 10.1038/nrd3955. [DOI] [PMC free article] [PubMed] [Google Scholar]
- Conklin BR, Farfel Z, Lustig KD, Julius D, Bourne HR. Substitution of three amino acids switches receptor specificity of Gq alpha to that of Gi alpha. Nature. 1993;363:274–276. doi: 10.1038/363274a0. [DOI] [PubMed] [Google Scholar]
- Corti F, Cellai L, Melani A, Donati C, Bruni P, Pedata F. Adenosine is present in rat brain synaptic vesicles. Neuroreport. 2013;24:982–987. doi: 10.1097/WNR.0000000000000033. [DOI] [PubMed] [Google Scholar]
- Costenla AR, Diogenes MJ, Canas PM, et al. Enhanced role of adenosine A(2A) receptors in the modulation of LTP in the rat hippocampus upon ageing. Eur J Neurosci. 2011;34:12–21. doi: 10.1111/j.1460-9568.2011.07719.x. [DOI] [PubMed] [Google Scholar]
- Cui J, He W, Yi B, Zhao H, Lu K, Ruan H, Ma D. mTOR pathway is involved in ADP-evoked astrocyte activation and ATP release in the spinal dorsal horn in a rat neuropathic pain model. Neuroscience. 2014;275:395–403. doi: 10.1016/j.neuroscience.2014.06.030. [DOI] [PubMed] [Google Scholar]
- Cunha RA, Vizi ES, Ribeiro JA, Sebastiao AM. Preferential release of ATP and its extracellular catabolism as a source of adenosine upon high- but not low-frequency stimulation of rat hippocampal slices. J Neurochem. 1996;67:2180–2187. doi: 10.1046/j.1471-4159.1996.67052180.x. [DOI] [PubMed] [Google Scholar]
- Dale N, Pearson T, Frenguelli BG. Direct measurement of adenosine release during hypoxia in the CA1 region of the rat hippocampal slice. J Physiol. 2000;526 Pt 1:143–155. doi: 10.1111/j.1469-7793.2000.00143.x. [DOI] [PMC free article] [PubMed] [Google Scholar]
- Davalos D, Grutzendler J, Yang G, Kim JV, Zuo Y, Jung S, Littman DR, Dustin ML, Gan WB. ATP mediates rapid microglial response to local brain injury in vivo. Nat Neurosci. 2005;8:752–758. doi: 10.1038/nn1472. [DOI] [PubMed] [Google Scholar]
- Di Virgilio F, Steinberg TH, Silverstein SC. Inhibition of Fura-2 sequestration and secretion with organic anion transport blockers. Cell calcium. 1990;11:57–62. doi: 10.1016/0143-4160(90)90059-4. [DOI] [PubMed] [Google Scholar]
- Dunwiddie TV, Diao L, Proctor WR. Adenine nucleotides undergo rapid, quantitative conversion to adenosine in the extracellular space in rat hippocampus. J Neurosci. 1997;17:7673–7682. doi: 10.1523/JNEUROSCI.17-20-07673.1997. [DOI] [PMC free article] [PubMed] [Google Scholar]
- Dunwiddie TV, Masino SA. The role and regulation of adenosine in the central nervous system. Annu Rev Neurosci. 2001;24:31–55. doi: 10.1146/annurev.neuro.24.1.31. [DOI] [PubMed] [Google Scholar]
- Ernst PB, Garrison JC, Thompson LF. Much ado about adenosine: adenosine synthesis and function in regulatory T cell biology. J Immunol. 2010;185:1993–1998. doi: 10.4049/jimmunol.1000108. [DOI] [PMC free article] [PubMed] [Google Scholar]
- Fraser DD, MacVicar BA. Cholinergic-dependent plateau potential in hippocampal CA1 pyramidal neurons. J Neurosci. 1996;16:4113–4128. doi: 10.1523/JNEUROSCI.16-13-04113.1996. [DOI] [PMC free article] [PubMed] [Google Scholar]
- Fredholm BB, Chen JF, Cunha RA, Svenningsson P, Vaugeois JM. Adenosine and brain function. Int Rev Neurobiol. 2005;63:191–270. doi: 10.1016/S0074-7742(05)63007-3. [DOI] [PubMed] [Google Scholar]
- Fujita T, Chen MJ, Li B, et al. Neuronal transgene expression in dominant-negative SNARE mice. J Neurosci. 2014;34:16594–16604. doi: 10.1523/JNEUROSCI.2585-14.2014. [DOI] [PMC free article] [PubMed] [Google Scholar]
- Gomes CV, Kaster MP, Tome AR, Agostinho PM, Cunha RA. Adenosine receptors and brain diseases: neuroprotection and neurodegeneration. Biochim Biophys Acta. 2011;1808:1380–1399. doi: 10.1016/j.bbamem.2010.12.001. [DOI] [PubMed] [Google Scholar]
- Gordon GR, Choi HB, Rungta RL, Ellis-Davies GC, MacVicar BA. Brain metabolism dictates the polarity of astrocyte control over arterioles. Nature. 2008;456:745–749. doi: 10.1038/nature07525. [DOI] [PMC free article] [PubMed] [Google Scholar]
- Hansen PB, Schnermann J. Vasoconstrictor and vasodilator effects of adenosine in the kidney. Am J Physiol Renal Physiol. 2003;285:F590–599. doi: 10.1152/ajprenal.00051.2003. [DOI] [PubMed] [Google Scholar]
- Haskew-Layton RE, Rudkouskaya A, Jin Y, Feustel PJ, Kimelberg HK, Mongin AA. Two distinct modes of hypoosmotic medium-induced release of excitatory amino acids and taurine in the rat brain in vivo. PloS one. 2008;3:e3543. doi: 10.1371/journal.pone.0003543. [DOI] [PMC free article] [PubMed] [Google Scholar]
- Headrick JP, Hack B, Ashton KJ. Acute adenosinergic cardioprotection in ischemic-reperfused hearts. Am J Physiol Heart Circ Physiol. 2003;285:H1797–1818. doi: 10.1152/ajpheart.00407.2003. [DOI] [PubMed] [Google Scholar]
- Heinrich A, Ando RD, Turi G, Rozsa B, Sperlagh B. K+ depolarization evokes ATP, adenosine and glutamate release from glia in rat hippocampus: a microelectrode biosensor study. Br J Pharmacol. 2012;167:1003–1020. doi: 10.1111/j.1476-5381.2012.01932.x. [DOI] [PMC free article] [PubMed] [Google Scholar]
- Hell JW, Westenbroek RE, Warner C, Ahlijanian MK, Prystay W, Gilbert MM, Snutch TP, Catterall WA. Identification and differential subcellular localization of the neuronal class C and class D L-type calcium channel alpha 1 subunits. J Cell Biol. 1993;123:949–962. doi: 10.1083/jcb.123.4.949. [DOI] [PMC free article] [PubMed] [Google Scholar]
- Klyuch BP, Dale N, Wall MJ. Deletion of ecto-5'-nucleotidase (CD73) reveals direct action potential-dependent adenosine release. J Neurosci. 2012;32:3842–3847. doi: 10.1523/JNEUROSCI.6052-11.2012. [DOI] [PMC free article] [PubMed] [Google Scholar]
- Klyuch BP, Richardson MJ, Dale N, Wall MJ. The dynamics of single spike-evoked adenosine release in the cerebellum. J Physiol. 2011;589:283–295. doi: 10.1113/jphysiol.2010.198986. [DOI] [PMC free article] [PubMed] [Google Scholar]
- Kolarow R, Brigadski T, Lessmann V. Postsynaptic secretion of BDNF and NT-3 from hippocampal neurons depends on calcium calmodulin kinase II signaling and proceeds via delayed fusion pore opening. J Neurosci. 2007;27:10350–10364. doi: 10.1523/JNEUROSCI.0692-07.2007. [DOI] [PMC free article] [PubMed] [Google Scholar]
- Lalo U, Palygin O, Rasooli-Nejad S, Andrew J, Haydon PG, Pankratov Y. Exocytosis of ATP from astrocytes modulates phasic and tonic inhibition in the neocortex. PLoS Biol. 2014;12:e1001747. doi: 10.1371/journal.pbio.1001747. [DOI] [PMC free article] [PubMed] [Google Scholar]
- Latini S, Pedata F, Pepeu G. The contribution of different types of calcium channels to electrically-evoked adenosine release from rat hippocampal slices. Naunyn-Schmiedeberg's Arch Pharmacol. 1997;355:250–255. doi: 10.1007/pl00004939. [DOI] [PubMed] [Google Scholar]
- Liu HT, Toychiev AH, Takahashi N, Sabirov RZ, Okada Y. Maxi-anion channel as a candidate pathway for osmosensitive ATP release from mouse astrocytes in primary culture. Cell Res. 2008;18:558–565. doi: 10.1038/cr.2008.49. [DOI] [PubMed] [Google Scholar]
- Lloyd HG, Fredholm BB. Involvement of adenosine deaminase and adenosine kinase in regulating extracellular adenosine concentration in rat hippocampal slices. Neurochem Int. 1995;26:387–395. doi: 10.1016/0197-0186(94)00144-j. [DOI] [PubMed] [Google Scholar]
- Lovatt D, Xu Q, Liu W, Takano T, Smith NA, Schnermann J, Tieu K, Nedergaard M. Neuronal adenosine release, and not astrocytic ATP release, mediates feedback inhibition of excitatory activity. Proc Natl Acad Sci U S A. 2012;109:6265–6270. doi: 10.1073/pnas.1120997109. [DOI] [PMC free article] [PubMed] [Google Scholar]
- Manzoni OJ, Manabe T, Nicoll RA. Release of adenosine by activation of NMDA receptors in the hippocampus. Science. 1994;265:2098–2101. doi: 10.1126/science.7916485. [DOI] [PubMed] [Google Scholar]
- Masino SA, Dunwiddie TV. Temperature-dependent modulation of excitatory transmission in hippocampal slices is mediated by extracellular adenosine. J Neurosci. 1999;19:1932–1939. doi: 10.1523/JNEUROSCI.19-06-01932.1999. [DOI] [PMC free article] [PubMed] [Google Scholar]
- Masino SA, Latini S, Bordoni F, Pedata F, Dunwiddie TV. Changes in hippocampal adenosine efflux, ATP levels, and synaptic transmission induced by increased temperature. Synapse. 2001;41:58–64. doi: 10.1002/syn.1060. [DOI] [PMC free article] [PubMed] [Google Scholar]
- Melani A, Corti F, Stephan H, Muller CE, Donati C, Bruni P, Vannucchi MG, Pedata F. Ecto-ATPase inhibition: ATP and adenosine release under physiological and ischemic in vivo conditions in the rat striatum. Exp Neurol. 2012;233:193–204. doi: 10.1016/j.expneurol.2011.09.036. [DOI] [PubMed] [Google Scholar]
- Mi Z, Jackson EK. Evidence for an endogenous cAMP-adenosine pathway in the rat kidney. J Pharmacol Exp Ther. 1998;287:926–930. [PubMed] [Google Scholar]
- Mitchell JB, Lupica CR, Dunwiddie TV. Activity-dependent release of endogenous adenosine modulates synaptic responses in the rat hippocampus. J Neurosci. 1993;13:3439–3447. doi: 10.1523/JNEUROSCI.13-08-03439.1993. [DOI] [PMC free article] [PubMed] [Google Scholar]
- Mosqueda-Garcia R. Adenosine as a therapeutic agent. Clin Invest Med. 1992;15:445–455. [PubMed] [Google Scholar]
- Nascimento FP, Macedo-Junior SJ, Pamplona FA, et al. Adenosine A1 receptor-dependent antinociception induced by inosine in mice: pharmacological, genetic and biochemical aspects. Mol Neurobiol. 2015;51:1368–1378. doi: 10.1007/s12035-014-8815-5. [DOI] [PubMed] [Google Scholar]
- O'Connor ER, Kimelberg HK. Role of calcium in astrocyte volume regulation and in the release of ions and amino acids. J Neurosci. 1993;13:2638–2650. doi: 10.1523/JNEUROSCI.13-06-02638.1993. [DOI] [PMC free article] [PubMed] [Google Scholar]
- O'Connor ER, Kimelberg HK, Keese CR, Giaever I. Electrical resistance method for measuring volume changes in monolayer cultures applied to primary astrocyte cultures. Am J Physiol. 1993;264:C471–478. doi: 10.1152/ajpcell.1993.264.2.C471. [DOI] [PubMed] [Google Scholar]
- Orellana JA, Froger N, Ezan P, Jiang JX, Bennett MV, Naus CC, Giaume C, Saez JC. ATP and glutamate released via astroglial connexin 43 hemichannels mediate neuronal death through activation of pannexin 1 hemichannels. J Neurochem. 2011;118:826–840. doi: 10.1111/j.1471-4159.2011.07210.x. [DOI] [PMC free article] [PubMed] [Google Scholar]
- Pascual O, Casper KB, Kubera C, et al. Astrocytic purinergic signaling coordinates synaptic networks. Science. 2005;310:113–116. doi: 10.1126/science.1116916. [DOI] [PubMed] [Google Scholar]
- Pearson T, Nuritova F, Caldwell D, Dale N, Frenguelli BG. A depletable pool of adenosine in area CA1 of the rat hippocampus. J Neurosci. 2001;21:2298–2307. doi: 10.1523/JNEUROSCI.21-07-02298.2001. [DOI] [PMC free article] [PubMed] [Google Scholar]
- Pietersen AN, Lancaster DM, Patel N, Hamilton JB, Vreugdenhil M. Modulation of gamma oscillations by endogenous adenosine through A1 and A2A receptors in the mouse hippocampus. Neuropharmacology. 2009;56:481–492. doi: 10.1016/j.neuropharm.2008.10.001. [DOI] [PubMed] [Google Scholar]
- Porkka-Heiskanen T, Kalinchuk AV. Adenosine, energy metabolism and sleep homeostasis. Sleep Med Rev. 2011;15:123–135. doi: 10.1016/j.smrv.2010.06.005. [DOI] [PubMed] [Google Scholar]
- Ragazzi E, Wu SN, Shryock J, Belardinelli L. Electrophysiological and receptor binding studies to assess activation of the cardiac adenosine receptor by adenine nucleotides. Circ Res. 1991;68:1035–1044. doi: 10.1161/01.res.68.4.1035. [DOI] [PubMed] [Google Scholar]
- Rebola N, Canas PM, Oliveira CR, Cunha RA. Different synaptic and subsynaptic localization of adenosine A2A receptors in the hippocampus and striatum of the rat. Neuroscience. 2005a;132:893–903. doi: 10.1016/j.neuroscience.2005.01.014. [DOI] [PubMed] [Google Scholar]
- Rebola N, Lujan R, Cunha RA, Mulle C. Adenosine A2A receptors are essential for long-term potentiation of NMDA-EPSCs at hippocampal mossy fiber synapses. Neuron. 2008;57:121–134. doi: 10.1016/j.neuron.2007.11.023. [DOI] [PubMed] [Google Scholar]
- Rebola N, Pinheiro PC, Oliveira CR, Malva JO, Cunha RA. Subcellular localization of adenosine A(1) receptors in nerve terminals and synapses of the rat hippocampus. Brain Res. 2003;987:49–58. doi: 10.1016/s0006-8993(03)03247-5. [DOI] [PubMed] [Google Scholar]
- Rebola N, Rodrigues RJ, Lopes LV, Richardson PJ, Oliveira CR, Cunha RA. Adenosine A1 and A2A receptors are co-expressed in pyramidal neurons and co-localized in glutamatergic nerve terminals of the rat hippocampus. Neuroscience. 2005b;133:79–83. doi: 10.1016/j.neuroscience.2005.01.054. [DOI] [PubMed] [Google Scholar]
- Rittiner JE, Korboukh I, Hull-Ryde EA, Jin J, Janzen WP, Frye SV, Zylka MJ. AMP is an adenosine A1 receptor agonist. J Biol Chem. 2012;287:5301–5309. doi: 10.1074/jbc.M111.291666. [DOI] [PMC free article] [PubMed] [Google Scholar]
- Rudolphi KA, Schubert P, Parkinson FE, Fredholm BB. Adenosine and brain ischemia. Cerebrovasc Brain Metab Rev. 1992;4:346–369. [PubMed] [Google Scholar]
- Rutledge EM, Kimelberg HK. Release of [3H]-D-aspartate from primary astrocyte cultures in response to raised external potassium. J Neurosci. 1996;16:7803–7811. doi: 10.1523/JNEUROSCI.16-24-07803.1996. [DOI] [PMC free article] [PubMed] [Google Scholar]
- Sawynok J. Pharmacological rationale for the clinical use of caffeine. Drugs. 1995;49:37–50. doi: 10.2165/00003495-199549010-00004. [DOI] [PubMed] [Google Scholar]
- Schmitt LI, Sims RE, Dale N, Haydon PG. Wakefulness affects synaptic and network activity by increasing extracellular astrocyte-derived adenosine. J Neurosci. 2012;32:4417–4425. doi: 10.1523/JNEUROSCI.5689-11.2012. [DOI] [PMC free article] [PubMed] [Google Scholar]
- Sebastiao AM, Ribeiro JA. Adenosine receptors and the central nervous system. Handb Exp Pharmacol. 2009:471–534. doi: 10.1007/978-3-540-89615-9_16. [DOI] [PubMed] [Google Scholar]
- Suadicani SO, Brosnan CF, Scemes E. P2X7 receptors mediate ATP release and amplification of astrocytic intercellular Ca2+ signaling. J Neurosci. 2006;26:1378–1385. doi: 10.1523/JNEUROSCI.3902-05.2006. [DOI] [PMC free article] [PubMed] [Google Scholar]
- Suzuki T, Kodama S, Hoshino C, Izumi T, Miyakawa H. A plateau potential mediated by the activation of extrasynaptic NMDA receptors in rat hippocampal CA1 pyramidal neurons. Eur J Neurosci. 2008;28:521–534. doi: 10.1111/j.1460-9568.2008.06324.x. [DOI] [PubMed] [Google Scholar]
- Thrane AS, Rappold PM, Fujita T, et al. Critical role of aquaporin-4 (AQP4) in astrocytic Ca2+ signaling events elicited by cerebral edema. Proc Natl Acad Sci U S A. 2011;108:846–851. doi: 10.1073/pnas.1015217108. [DOI] [PMC free article] [PubMed] [Google Scholar]
- Uchino S, Nakamura T, Nakamura K, Nakajima-Iijima S, Mishina M, Kohsaka S, Kudo Y. Real-time, two-dimensional visualization of ischaemia-induced glutamate release from hippocampal slices. Eur J Neurosci. 2001;13:670–678. doi: 10.1046/j.1460-9568.2001.01430.x. [DOI] [PubMed] [Google Scholar]
- Wall MJ, Dale N. Neuronal transporter and astrocytic ATP exocytosis underlie activity-dependent adenosine release in the hippocampus. J Physiol. 2013;591:3853–3871. doi: 10.1113/jphysiol.2013.253450. [DOI] [PMC free article] [PubMed] [Google Scholar]
- White TD. Direct detection of depolarisation-induced release of ATP from a synaptosomal preparation. Nature. 1977;267:67–68. doi: 10.1038/267067a0. [DOI] [PubMed] [Google Scholar]
- Wieraszko A, Goldsmith G, Seyfried TN. Stimulation-dependent release of adenosine triphosphate from hippocampal slices. Brain Res. 1989;485:244–250. doi: 10.1016/0006-8993(89)90567-2. [DOI] [PubMed] [Google Scholar]
- Winn HR, Rubio R, Berne RM. Brain adenosine production in the rat during 60 seconds of ischemia. Circ Res. 1979;45:486–492. doi: 10.1161/01.res.45.4.486. [DOI] [PubMed] [Google Scholar]
- Yang L, Qi Y, Yang Y. Astrocytes control food intake by inhibiting AGRP neuron activity via adenosine A1 receptors. Cell Rep. 2015;11:798–807. doi: 10.1016/j.celrep.2015.04.002. [DOI] [PubMed] [Google Scholar]


