Figure 4.
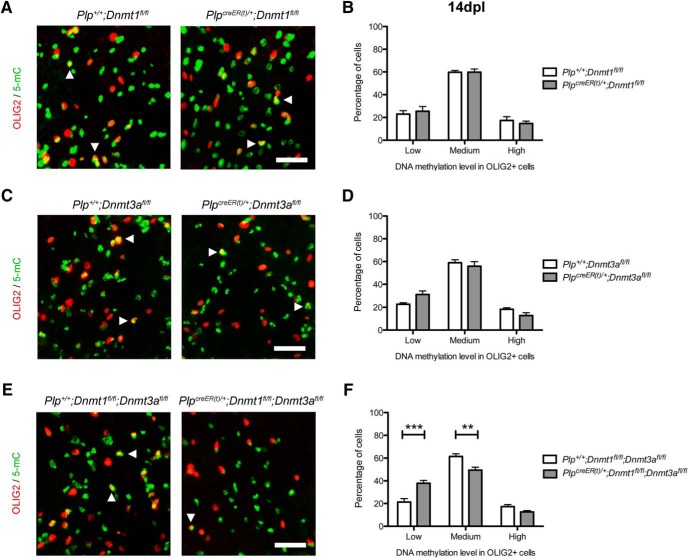
Ablation of Dnmt3a and both Dnmt1 and Dnmt3a impairs methylation levels in oligodendroglial cells during remyelination. A, Representative 5mC and OLIG2 staining at 14 dpl in tamoxifen-treated Plp+ /+;Dnmt1fl/fl and PlpcreER(t) /+;Dnmt1fl/fl spinal cords (white arrowheads indicate high-5mC+/OLIG2+ cells). B, Quantification of low-, medium-, and high-5mC levels in OLIG2+ cells at 14dplp. C, Representative 5mC and OLIG2 staining at 14 dpl in tamoxifen-treated Plp+ /+;Dnmt1fl/fl and PlpcreER(t) /+;Dnmt3afl/fl spinal cords (white arrowheads indicate high-5mC+/OLIG2+ cells). D, Quantification of low-, medium-, and high-5mC levels in OLIG2+ cells at 14dplq. E, Representative 5mC and OLIG2 staining at 14 dpl in tamoxifen-treated Plp+ /+;Dnmt1fl/fl and PlpcreER(t) /+;Dnmt1fl/fl;Dnmt3afl/fl spinal cords (white arrowheads indicate high-5mC+/OLIG2+ cells). F, Quantification of low-, medium-, and high-5mC levels in OLIG2+ cells at 14 dplr. Scale bar = 100 µm. Data are mean ± SEM. n = 4–6 animals, three sections per animal. **p < 0.01, ***p < 0.001 (ANOVA).

