Abstract
Iron plays the central role in oxygen transport by erythrocytes as a constituent of heme and hemoglobin. The importance of iron and heme is also to be found in their regulatory roles during erythroblast maturation. The transcription factor Bach1 may be involved in their regulatory roles since it is deactivated by direct binding of heme. To address whether Bach1 is involved in the responses of erythroblasts to iron status, low iron conditions that induced severe iron deficiency in mice were established. Under iron deficiency, extensive gene expression changes and mitophagy disorder were induced during maturation of erythroblasts. Bach1−/− mice showed more severe iron deficiency anemia in the developmental phase of mice and a retarded recovery once iron was replenished when compared with wild-type mice. In the absence of Bach1, the expression of globin genes and Hmox1 (encoding heme oxygenase-1) was de-repressed in erythroblasts under iron deficiency, suggesting that Bach1 represses these genes in erythroblasts under iron deficiency to balance the levels of heme and globin. Moreover, an increase in genome-wide DNA methylation was observed in erythroblasts of Bach1−/− mice under iron deficiency. These findings reveal the principle role of iron as a regulator of gene expression in erythroblast maturation and suggest that the iron-heme-Bach1 axis is important for a proper adaptation of erythroblast to iron deficiency to avoid toxic aggregates of non-heme globin.
Introduction
In order to transport oxygen to peripheral tissues, abundant synthesis of the oxygen carrier hemoglobin is required during erythrocyte maturation. Since iron is essential for hemoglobin synthesis, erythrocyte consumes a major part of the body iron in order to synthesize a sufficient amount of hemoglobin.1 As such, elaborate mechanisms are required to identify cellular iron status in order to maintain homeostasis. Several factors have been proposed to function as the sensors of iron, including iron regulatory element (IRE)/iron regulatory protein (IRP) system and ubiquitin E3 ligase FBXL5.2,3 Several lines of evidence suggest that iron affects the gene expression profile in erythroid cells. For instance, it has been reported that iron deficiency (ID) in pregnant mother mice affects the gene expression in definitive erythroid cells in the fetal livers.4 Since iron is a co-factor for enzymes involved in epigenetic regulation, such as the Tet family of DNA demethylase and the Jumonji family of histone demethylases,5,6 iron may directly affect epigenetic regulations. Nevertheless, it has remained unclear how gene expressions in erythroblast in the adult body are affected by iron status.
While heme and globin are central to the function of erythrocyte, excessive levels of globin lead to proteotoxicity, as evidenced by β-thalassemia.7 Non-heme globins (free globins) are easily oxidized and form toxic aggregates.8,9 Therefore there must be a strict regulatory system to balance the intracellular heme and globin. It was previously reported that heme-regulated eIF2a kinase (HRI) represses the translation of globin to maintain their balance, and this function is required for erythrocyte development under ID.4,10 However, such a mechanism that regulates the intracellular heme and globin balance at the transcriptional level has remained elusive.
Bach1 is a transcription factor whose functions are repressed by heme.11–13 Since Bach1 transcriptionally represses globin genes and Hmox1 [the latter encoding heme oxygenase-1 (HO-1)] in erythroid cell lines,14–16 Bach1 might have an important role in erythrocyte development as a balancer of intracellular heme and globins. However, Bach1−/− mice show apparently unperturbed erythropoiesis.16 As heme is abundantly synthesized in erythrocytes, Bach1 knockout may not exhibit an apparent phenotype in an iron sufficient status. Namely, when the heme content is reduced in erythroblasts, Bach1 is presumed to carry out its regulatory roles. This led us to consider that ID may involve alterations in the gene expression regulated by Bach1.
To address these issues, we established low iron conditions (LIC) that induced severe ID in mice. Under LIC, transcriptome and DNA methylome analyses in erythroblasts were performed to reveal the regulatory function of iron. Transcriptomic analyses revealed that LIC inhibited mitophagy in erythroblasts, suggesting a connection between iron and mitophagy in erythroblasts. While Bach1−/− mice showed iron deficiency anemia (IDA) similar to wild-type mice when LIC was initiated after weaning, Bach1−/− mice were more vulnerable to LIC than wild-type mice when LIC was initiated during the embryonic stage. In addition, DNA methylation was increased in Bach1−/− erythroblasts under LIC and Bach1−/− mice showed slower recovery from IDA. These results indicate that iron plays extremely important roles in tuning the gene expressions in developing erythroblasts and point to a crucial function for Bach1 in erythroblasts under ID. These observations give us new insight into the pathophysiology and molecular biology of IDA, one of the most common disorders affecting the global population.17,18
Methods
Mice
All mice were from the C57BL/6J genetic background and housed in specific pathogen-free (SPF) conditions. Bach1−/− mice were obtained as described previously.16 All experiments were approved by the Institutional Animal Care and Use Committee of the Tohoku University Environmental and Safety Committee.
Diet-induced iron deficiency
In order to achieve a state of ID, mice were fed a low iron diet (LID) containing 3.6 ppm Fe. As control, CLEA Rodent Diet CE-2, which contains 310.2 ppm Fe, was used as normal diet (ND). Both of these were purchased from CLEA Japan, Inc. Diets were provided ad libitum. In the LID-after weaning (LID-W) regimen, mice were fed LID starting from three weeks upon weaning. In the LID-development and after weaning (LID-DW) regimen, LID was initiated from 0.5 days post coitum via mothers, and newborn mice were also fed LID upon weaning till 12 weeks of age. Technical details of hematologic and serum biochemistry analyses are described in the Online Supplementary Methods.
Flow cytometry and cell sorting analyses
Bone marrow (BM) cells and peripheral blood (PB) cells were collected from the bilateral femur and tibia or retro-orbital vein, respectively. Cells were suspended in staining buffer (PBS with 3% FBS) and stained with fluorescent-conjugated antibodies specific for CD71 (clone: C2 or R17217) and Ter119 (clone: Ter119) (BD Bioscience, eBioscience). Mitochondria staining was performed using the Mitotracker Green FM (Mito-G; Thermo Fisher Scientific) according to the manufacturer’s instructions. Intracellular hydrogen peroxide was measured using 7′-dichlorodi-hydrofluorescein diacetate (DCFDA; Sigma-Aldrich) as previously described.19 Cells were analyzed and sorted by FACS Aria II (BD Bioscience) according to the manufacturer’s instructions. Data were analyzed using the FlowJo software program (TreeStar).
Quantitative PCR
Quantitative PCR (qPCR) analysis was performed as previously described20 with only slight modifications (Online Supplementary Methods and Table S1). Levels of mRNAs were normalized to the β-actin levels.
Chromatin immunoprecipitation
A qPCR-based chromatin immunoprecipitation (ChIP) analysis was performed as previously described21 with only slight modifications (Online Supplementary Methods). Sequences of the primers are described in Online Supplementary Table S2.
Expression profiling by microarray analysis and DNA methylation profiling by post-bisulfite conversion adaptor tagging method
Technical details of the microarray analysis and post-bisulfite conversion adaptor tagging (PBAT) method are described in the Online Supplementary Methods. The microarray data and the sequencing data have been deposited to Gene Expression Omnibus (GEO) under the accession number, GSE77694 and GSE78955, respectively.
Statistical analysis
Data were analyzed by two-tailed t-test using Student t-test or Welch t-test, as appropriate. P<0.05 was considered statistically significant. The numbers of mice analyzed in each experiment are described in the figure legends. For the volcano plot analysis, moderate t-test with Benjamin-Hochberg multiple testing was performed to calculate statistical significance, and P<0.05 and 2-fold change were used as cut-off value.22,23 Calculations of significance in GSEA were performed using the GSEA software.24,25
Results
LID induces severe IDA
In LID-W, wild-type mice started to exhibit anemia after three weeks and their blood parameters worsened according to the length of time on LID. Conversely, platelet counts and the serum total iron binding capacity were significantly increased (Figure 1A and B). Platelet counts were unaccountably high after seven weeks with LID. There was no evidence of hemolysis according to total bilirubin concentrations (Figure 1C). These observations were similar to the features of human IDA.18 Amounts of iron of erythroblasts were indeed decreased in LID-W (Figure 1D). These results show that LID-W can induce severe IDA within a shorter period of time only by nutritional iron restriction, without using iron chelators; this is in contrast to previous reports.4,26,27
Figure 1.
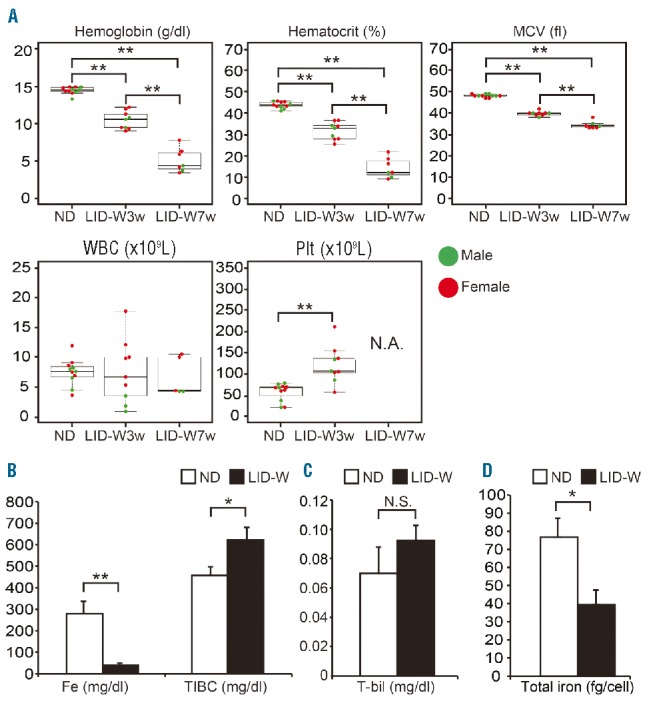
Complete peripheral blood (PB) counts and laboratory parameters of wild-type mice under a normal diet condition or low iron condition (LIC). All mice under LIC were fed a low iron diet after weaning (LID-W). (A) Results of complete blood counts in PB. MCV: mean corpuscular volume; WBC: white blood cells; Plt: platelets; ND: normal diet; LID-W 3w: LID after weaning for three weeks; LID-W 7w: LID after weaning for seven weeks. N.A.: not available. (B) Concentrations of serum Fe and TIBC (total iron binding capacity) (ND: n=9; LID-W: n=7). (C) Concentrations of total bilirubin (T-bil) (ND: n=5; LID-W: n=9). N.S.: not significant. (D) Total amount of iron of Ter119-positive cells in bone marrow (BM) of each condition (ND: n=4; LID-W: n=3). Results shown in bar plot are expressed by average and standard error of mean (s.e.m.). Symbols in beeswarm plots represent sex of mice: male (●), female (●). *P<0.05; **P<0.01.
Maturation disorder of erythroblasts upon ID
Under LID-W, total BM cell numbers were significantly reduced (Figure 2A). To describe the detail of erythropoiesis, several staining combinations are available for use. For example, Ter119/CD44/forward scatter (FSC) combination can distinguish erythroblasts into six subsets.28 However, this approach might be inappropriate because of the erythrocyte volume reduction induced by ID.27 On the other hand, a CD71/Ter119 combination makes it possible to classify erythroblasts into four subsets that reflect maturation steps from subset I to subset IV.29 According to a previous report,30 CD71 (transferrin receptor 1) expression is independent of iron status in differentiating mouse erythroblast because of the altered regulation of IRP. Furthermore, this approach has already been used to analyze ID.4 By this approach, erythroblast cell numbers were significantly decreased from subset II in ID (Figure 2B and C), suggesting that maturation disorder of immature erythroblasts occurred in ID. As expected, subset II to whole Ter119-positive cell ratio was unchanged by ID (Figure 2D). Therefore, an alteration of CD71 expression itself was not the cause of the observed changes in the numbers of BM erythroblasts.
Figure 2.
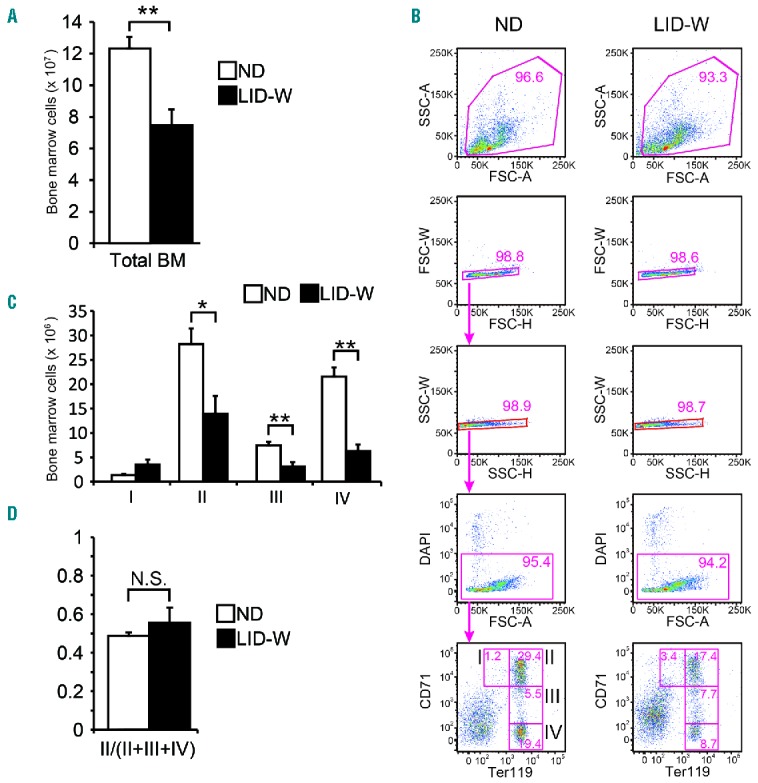
Flow cytometry analysis of bone marrow (BM) erythroblasts terminal maturation. For this analysis, low iron diet after weaning (LID-W) was continued for 7–12 weeks (for 7 weeks: n=3; for 12 weeks: n=3). (A) Total BM cells of each condition. (B) Representative density plots of freshly isolated wild-type BM (Subset I: proerythroblasts; Subset II: basophilic erythroblasts; Subset III: late basophilic and chromatophilic erythroblasts; Subset IV: orthochromatophilic erythroblasts). (C) Numbers of cells in the indicated erythroblast subsets of each condition in BM. (D) Ratio of BM erythroblast Subset II to total Ter119-positive cells (Subset II + III + IV) of each condition. N.S.: not significant. Results shown in bar plot are expressed by average and standard error of mean (s.e.m.). *P<0.05; **P<0.01.
Transcriptome analysis of BM erythroblasts in ID
Given the results of the flow cytometry analysis (Figure 2C and D), a microarray analysis of subset II erythroblasts sorted from wild-type mice under ND or LID-W was performed to reveal the effects of ID on the gene expressions. Three samples each from three conditions (ND, LID-W for 3 weeks, LID-W for 7 weeks) were investigated. A clustering analysis clearly separated the samples into three groups corresponding to the experimental conditions (Figure 3A). According to the volcano plots analysis, 1843 genes (represented by 2629 entities) and 1708 genes (3351 entities) were significantly up-regulated in LID-W for three weeks and seven weeks, respectively. Conversely, 2289 genes (4061 entities) and 3023 genes (4631 entities) were significantly down-regulated in LID-W for three weeks and seven weeks, respectively (Figure 3B and Online Supplementary Table S3). The gene expression profiles in erythroblasts change rapidly and pervasively in response to ID. For example, expressions of genes encoding heme biosynthetic enzymes Alas2 (δ-aminolevulinate synthase) and Fech (Ferrochelatase) were up-regulated in LID-W for seven weeks, suggesting the compensatory reactions for lower heme induced by ID (Online Supplementary Figure S1A). In contrast, expressions of cytoplasmic iron homeostasis related genes,31 such as Dmt1 and Ferroportin1, were down-regulated by LID, suggesting a retardation of iron transportation in ID (Online Supplementary Figure S1B). GSEA showed that the expressions of putative GATA-1 target genes were significantly decreased in LID-W (Figure 3C). Therefore, ID may inhibit the GATA-1 function, which is consistent with the findings of a previous report using fetal liver hematopoiesis as a model for IDA.4 While no obvious differences in expression of selected genes related to mitochondrial iron homeostasis were observed (Online Supplementary Figure S1C),31 many gene sets related to mitochondrial biology were significantly down-regulated in LID-W according to GSEA (Figure 3C and Online Supplementary Table S4). These results suggest that iron is required for the proper expression of genes related to GATA-1 and mitochondrial biology.
Figure 3.
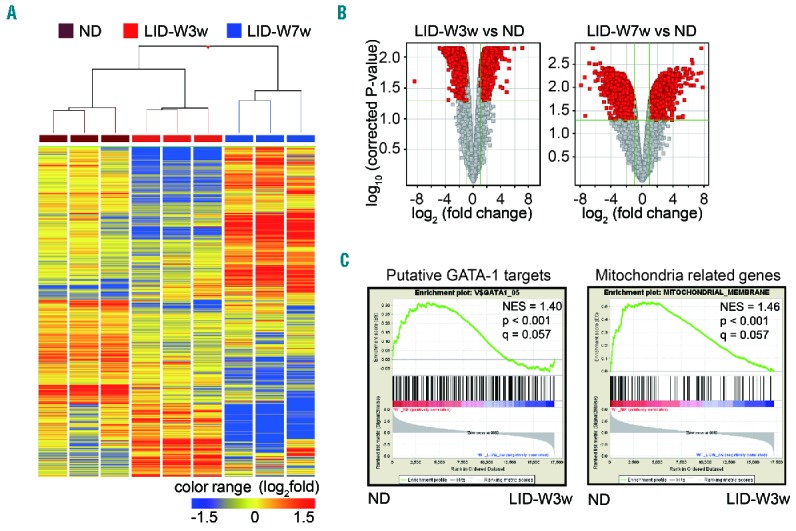
Transcriptome analysis of erythroblasts under iron deficiency. Clustering analysis of microarray results in erythroblasts Subset II from wild-type (WT) bone marrow (BM) under normal diet (ND), low iron diet after weaning (LID-W) for three weeks and LID-W for seven weeks. (B) Volcano plot analysis in microarray results of LID-W for three weeks or for seven weeks compared to ND. Genes with fold change ≥2 and P<0.05 are highlighted in red. (C) Results of the GSEA are shown. Geneset data were referenced by Molecular Signatures Database of Broad Institute. Geneset V$GATA1_05 is composed of the genes that have GATA-1 binding motifs in their promoter regions [−2kb, 2kb]. Geneset MITOCHONDRIAL_MEMBRANE is composed of the genes related to the bilayers of the mitochondria. NES: normalized enrichment score; P: nominal P-value; q: false discovery rate as implemented in GSEA. vs: versus.
Mitophagy disorder occurs under iron deficiency
One of the unique features of erythroblast maturation is that erythroblasts undergo mitophagy, which removes mitochondria in a manner dependent upon GATA-1.32 Since results suggested GATA-1 function and mitochondrial biology were expected to be impaired in ID, we hypothesized that mitophagy disorder would occur in erythroblasts under ID. To address this, total mitochondrial mass in erythroblasts was measured by staining erythroblasts by Mito-G. This analysis showed that the mitochondrial mass gradually decreased alongside erythroblast maturation under ND, which was consistent with an initiation of mitophagy (Figure 4A). While there was no significant difference in the mitochondrial mass of BM erythroblasts between the ND and LID-W (Figure 4A), there was a significant increase in the mitochondrial mass under ID in PB erythrocyte (Figure 4B and C). However, ID did not affect enucleation of PB erythrocytes (Figure 4D). These findings suggest that ID specifically impaired removal of mitochondria during erythroblast maturation. Intriguingly, the erythrocytes with higher mitochondrial mass also showed higher expression of CD71 (Figure 4B and C) whereas BM erythroblasts did not show alterations in the level of CD71 expression (see above). This altered frequency of CD71 expressing erythrocytes is consistent with the phenotype of the mice with mitophagy disorder in erythrocytes.33 Therefore, downregulation of CD71 during erythroblast maturation might be controlled by a similar regulatory mechanism that removes mitochondria in erythroblasts.
Figure 4.
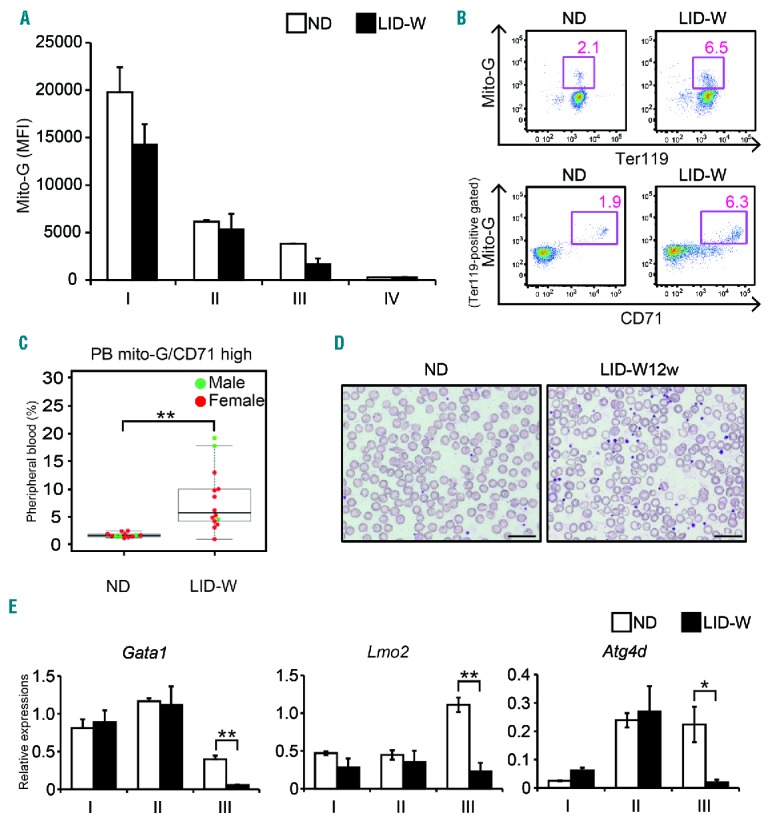
Mitophagy disorder was induced by low iron condition in wild-type (WT) mice. (A) Mean fluorescent intensity (MFI) of Mito-G staining in each bone marrow (BM) erythroblast subset of WT mice under normal diet (ND) or low iron diet after weaning (LID-W) for 12 weeks (n=3). (B) Representative results of flow cytometry (FCM) analysis of peripheral blood (PB) samples in WT mice under ND or LID-W for 12 weeks. (Lower panels) Ter119-positive gated cells. (C) Cumulative results from more than 3 times experiments of Mito-G and CD71 double positive populations in PB of WT mice under ND or LID-W for 7–12 weeks. (D) May-Giemsa stained PB smear samples obtained from wild-type mice under ND or LID-W for 12 weeks. Images were obtained with a BX53 microscope and DP26 camera (Olympus, Tokyo, Japan); an eyepiece, WHN (Olympus); objective lens, MPlanApoN (Olympus). Scale bars: 20 μm. (E) Quantitative PCR (qPCR) analysis of indicated genes of each BM erythroblast subset in WT mice under ND or LID-W for 12 weeks (n=3). Relative gene expressions normalized by β-actin expressions were shown. Results shown in bar plot are expressed by average and standard error of mean (s.e.m.). *P<0.05; **P<0.01.
Since GATA-1 has been suggested to play a regulatory role in erythroblast autophagy,32 gene expression levels of Gata1, its co-factor gene Lmo2, and autophagy-related gene Atg4d of BM erythroblasts were analyzed. The expression levels of Gata1, Lmo2 and Atg4d were significantly decreased in subset III (Figure 4E), suggesting that iron is required to maintain the expressions of these genes during maturation. This mitochondria accumulation in erythrocytes was recovered by returning the mice to the ND for another eight weeks (Online Supplementary Figure S2A and B). Therefore, defective mitophagy observed in ID is reversible.
Bach1 plays pivotal roles in ID during the juvenile period
Since Bach1 represses several iron-related genes, such as Hmox1 and globin genes,34 we hypothesized that Bach1 acts to balance intracellular heme and globin levels in erythroblast. However, no clear defect of erythropoiesis in Bach1−/− mice was observed under ND (Figure 5A and data not shown). Considering that Bach1 is negatively regulated by heme, the function of Bach1 may become apparent under a low heme state, which is induced by ID. We, therefore, compared the endurance for ID between Bach1−/− mice and wild-type mice using the LID-W regimen. However, there was no significant difference in severity of anemia under LID-W (Figure 5A), suggesting that Bach1 was not involved in the severity of IDA under the condition of LID-W.
Figure 5.
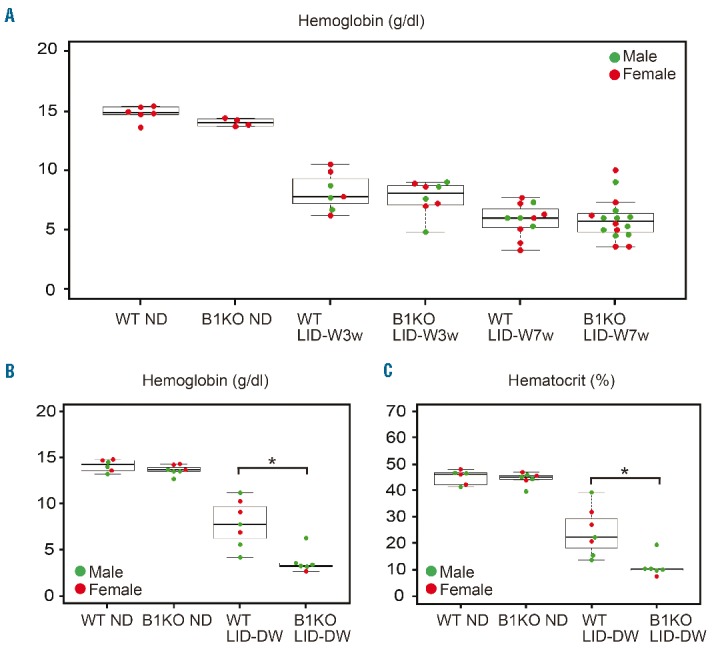
Bach1−/− mice showed severe iron deficiency anemia (IDA) under low iron diet development and after weaning (LID-DW) regimen. (A) Peripheral blood (PB) hemoglobin concentrations of wild-type (WT) and Bach1−/− (B1KO) mice under normal diet (ND), low iron diet after weaning (LID-W) for three weeks and LID-W for seven weeks. (B and C) PB hemoglobin and hematocrit concentrations of wild-type (WT) and Bach1−/− mice under ND or low iron diet development and after weaning (LID-DW). Only the significance between WT and Bach1−/− mice under each condition is highlighted in quotes. Symbols represent sex of mice in beeswarm plots: male (●), female (●). *P<0.01.
Since pregnant mother and developing child are vulnerable to ID because of their high iron demands,18 it was presumed that Bach1 function would become more apparent under ID in that developmental period. To address this, we next compared the endurance for ID under LID-DW. Under this regimen, Bach1−/− mice exhibited more severe anemia than wild-type mice regarding the hemoglobin concentration and hematocrit level (Figure 5B and C). These observations suggest that Bach1 facilitates adaptation of erythropoiesis to ID in embryo and/or in the juvenile period.
Bach1 controls heme and globin balance by directly repressing its targets
The balance of heme and globin levels is critical for proper erythroid development.4 Therefore, we considered whether the globin gene expression might be altered in Bach1−/− mice under LID-DW. We sorted BM erythroblasts (subsets I and II) from wild-type and Bach1−/− mice under ND or LID-DW, and performed a qPCR analysis of Hba-a (α-globin) and Hbb-b (β-globin). The expression levels of the globin genes were increased in subset II compared to subset I in both wild-type and Bach1−/− mice under ND (Figure 6A), indicating that erythroid maturation is accompanied by an induction of the globin expression, as reported previously.35 In erythroblasts from wild-type mice under LID-DW, the expression levels of globin genes were decreased in both subsets I and II (Figure 6A), indicating that the iron supply to erythroblasts leads to globin gene induction, and are consistent with the hypothesis that a shortage of iron and/or heme down-regulates the transcription of globin genes. In contrast, the expression of globin genes was not down-regulated in subset II erythroblasts from Bach1−/− mice under LID-DW (Figure 6A). Intriguingly, the Hmox1 expression was significantly increased only in both subsets I and II of Bach1−/− mice under LID-DW (Figure 6A). Taken together, Bach1 represses the expression of Hba-a, Hbb-b and Hmox1 in erythroblasts, at least under a sustained ID. There are several Maf recognition elements (MARE) (the target sequence of Bach1 and MafK heterodimer) in the locus control regions of Hba-a and Hbb-b and in the enhancer regions E1 and E2 of Hmox1 (Figure 6B), to which direct binding of Bach1 has been reported using MEL cells and non-erythroid cells.14,16,36–38 Using primary Ter119-positive BM cells isolated from wild-type mice and a chromatin immunoprecipitation assay, we found enrichments of Bach1 and MafK on MARE-containing regions of these genes (Figure 6C), suggesting that Bach1 directly represses these genes in mouse primary erythroblasts. In addition, Bach1 enrichments on its target regions were actually increased in ID (Figure 6D), indicating an increased activity of Bach1 in ID. These results substantially support the notion that the repression of Bach1 target genes at the transcriptional level is required under severe and/or prolonged ID to maintain the balance of heme and globin for the prevention of accumulations of free globin. Consistent with this interpretation, ROS accumulation of Bach1−/− erythroblasts was observed under LID-DW (Online Supplementary Figure S3A), which might be induced by the accumulations of free globin.39 On the other hand, no obvious difference was observed in the mitochondria amount in PB between wild-type and Bach1−/− mice even in ID (Online Supplementary Figure S3B). Therefore, Bach1 may not be directly involved in the regulation of erythroblast mitophagy in ID.
Figure 6.
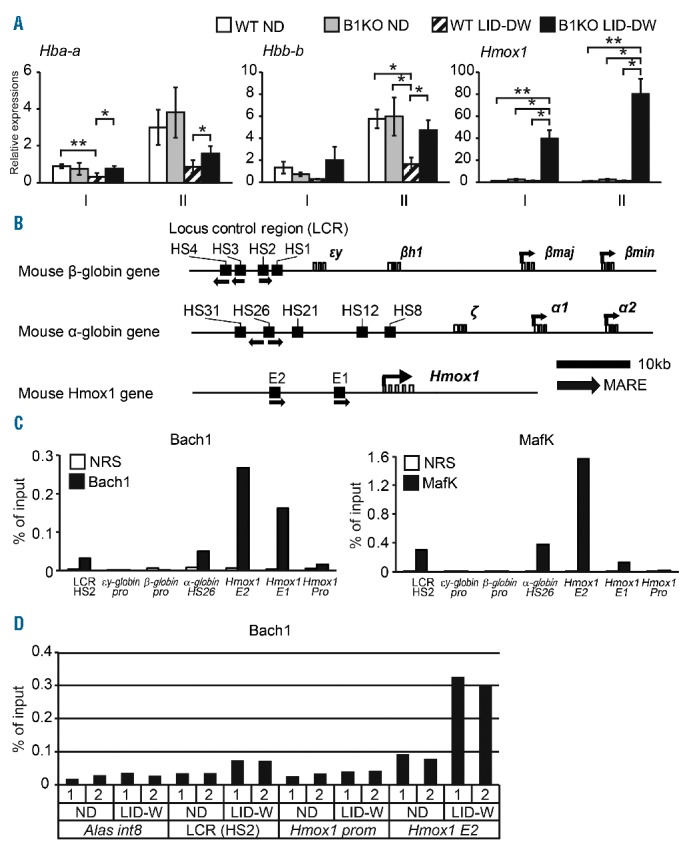
Bach1 regulates the essential genes in hemoglobin synthesis. (A) Quantitative PCR (qPCR) analysis of indicated gene expressions of each bone marrow (BM) erythroblast subset in wild-type (WT) and Bach1−/− (B1KO) mice under normal diet (ND) or low iron diet development and after weaning (LID-DW). Relative gene expressions normalized by β-actin expressions are shown. Data are cumulative results of 3 or more biological replicates. Bar plots are expressed by average and standard error of mean (s.e.m.). (B) Schematic representation of the mouse β-globin gene, α-globin gene and Hmox1 locus. The arrow indicates Maf recognition elements (MAREs). HS: DNase I-hypersensitive site; E1 and E2: enhancer regions of the Hmox1. (C) A chromatin immunoprecipitation analysis was performed by using antibodies against Bach1 and MafK. MAREs are found in the HS2, HS26, E1 and E2 site as shown in Figure 6B. The promoter regions (pro) of indicated genes do not contain MAREs. NRS: normal rabbit serum. A similar result was obtained from another independent experiment. *P<0.05; **P<0.01. (D) A chromatin immunoprecipitation analysis was performed by using antibodies against Bach1 of WT BM Ter119-positive erythroblast under ND or low iron diet after weaning (LID-W) (n=2). Alas int8 and Hmox1 promoter regions used as negative controls. LCR (HS2) and Hmox1 E2 regions are Bach1 targets.
Iron and Bach1 control the DNA methylation status in erythroblasts
To investigate how extensive transcriptomic changes were induced under ID and whether there are any other roles for Bach1 in the adaptation of erythropoiesis under ID, we compared the DNA methylation status of erythroblasts. After seven weeks of LID-W or ND, BM erythroblast subset II from wild-type or Bach1−/− mice were isolated. DNA methylation levels were compared genome-wide using the PBAT method. Hemoglobin concentrations of wild-type mice under the ND or LID-W and Bach1−/− mice under the ND or LID-W were 13.1, 11.7, 14.1 and 4.0 g/dL, respectively. Therefore, Bach1−/− mouse in LID-W showed more severe anemia in this set of the experiment. There was no clear difference in the overall DNA methylation status between erythroblasts from wild-type mice under the ND compared with that of LID-W (Figure 7A). However, there were apparent differences in certain genomic regions (Figure 7B). (Dot plots within green zones indicate DNA regions where the methylation status changed ≥ 25% by ID). In addition, Bach1−/− erythroblasts under LID-W showed a higher DNA methylation level compared with wild-type erythroblasts under LID-W or Bach1−/− erythroblasts under the ND (Figure 7A, C and D). Although these results need to be interpreted with care due to the small number of samples and variation in the anemic severity, these results suggest that iron and Bach1 may be involved in the determination of DNA methylation status in erythroblasts and that these alterations affect the pathophysiology of IDA. When DNA regions with higher methylation levels were analyzed for possible correlations with the expression levels of nearby genes in WT mice, there was no clear correlation (Figure 7E). Such a relatively poor correlation between the DNA methylation status and the gene expression profile was consistent with previous reports.40,41 Therefore, further studies are needed to uncover the details of this mechanism involving DNA methylation and its physiological significance under ID.
Figure 7.
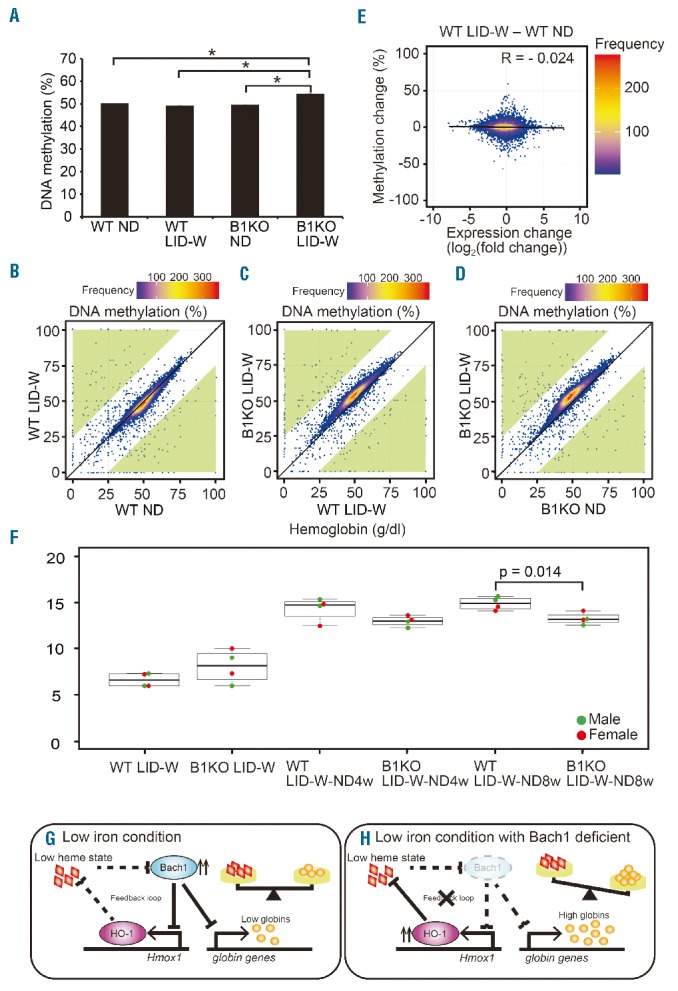
DNA methylation analysis of bone marrow (BM) erythroblasts. (A) Whole genome methylated DNA percentages of BM erythroblast Subset II from each condition. Bar plots are expressed by average and standard error of mean (s.e.m.) (*P<0.01). (B–D) DNA methylation levels (%) of 100-kb non-overlapping tiles across the genome of erythroblast Subset II from each condition were compared. These data are shown by Hexbin plots as in the graphs. Dot plots in green zones were the genomic regions their methylation levels had changed 25% or more between compared conditions. (E) Hexbin plot of DNA methylation difference in promoters (from 2 kb upstream of transcription start sites to 0.5 kb downstream) determined by PBAT family-based association tests and gene expression difference determined by microarray analysis [difference between wild-type (WT) LID-W for 7 weeks (7w) and WT normal diet (ND)]. The correlation coefficient (R) was −0.024. (F) Peripheral blood (PB) hemoglobin concentrations of WT and Bach1−/− (B1KO) mice under LID-W for seven weeks followed by four weeks or eight weeks ND. Symbols represent sex of mice in beeswarm plots: male (●), female (●). (G and H) Schematic models for the Bach1 function in erythropoiesis under iron deficiency. (G) In iron deficient WT mice erythroblasts, Bach1 maintains the proper balance between heme and globin by repressing the globin genes and Hmox1. (H) In iron deficient Bach1−/− mice erythroblasts, the expressions of globin genes and Hmox1 are not repressed adequately resulting in an excess of free globin which can be the toxic aggregate to disturbance of erythroblast maturation.
Bach1 facilitates recovery from IDA
Considering that DNA methylation alterations seen in Bach1−/− erythroblasts in LID-W, we compared recovery processes from IDA. After being fed LID for seven weeks according to the LID-W, wild-type or Bach1−/− mice were re-fed the ND. Initial recovery of the anemia was rapid and similar for both genotypes (Figure 7F). However, while the hemoglobin content reached 14.85±0.34 g/dL in wild-type mice after eight weeks, that in Bach1−/− mice remained around 13.23±0.33 g/dL (Figure 7F), suggesting that Bach1 is involved in the recovery process from IDA. The overall increase in the DNA methylation may be related to this slower recovery seen in Bach1−/− mice.
Discussion
In the present study, we established that LIC induced severe ID and performed a comprehensive transcriptional analysis of BM erythroblasts. Unexpectedly large numbers of gene expressions in erythroblasts were altered under LID-W. In addition, not only maturation disorder, but also mitophagy disorder occurred in erythrocytes under LID-W. Importantly, the data suggest that iron plays a pivotal role in controlling GATA-1 function and expression of genes related to GATA-1 and/or GATA-1 downstream genes, including those related to mitophagy. Since it has been reported that heme is required for the cellular differentiation governed by GATA-1 in erythroid cells,42 impaired heme synthesis induced by ID can be the cause of repression of GATA-1 downstream genes. Therefore, a loss of iron induces the discordance of the erythroblast maturation program, which may be the fundamental cause of IDA.
Our results raise the possibility that iron drives the process of mitophagy during maturation of erythroblasts. The reduced function of GATA-1 under ID may be the primary cause of mitophagy disorder. These results also suggest that the sustained presence of mitochondria and the expression of CD71 in erythrocyte under IDA may provide differential diagnostic parameters for anemia. Although we did not directly observe reticulocyte in PB, mito-G high erythrocyte can be considered to be reticulocyte because reticulocyte still possesses subcellular organelle such as mitochondria. Therefore, mice in ID might have a high percentage of reticulocyte in PB that is not induced by increased erythropoiesis but by defective mitophagy; this might be part of the reason why reticulocyte counts do not always decrease in human IDA.43 Since we did not observe nucleated erythrocyte under ID, terminal enucleation of erythroblasts is likely driven by a mechanism distinctive from that driving mitophagy.
Bach1−/− mice showed severe anemia under the LID-DW regimen. Because the embryonic period and early life stage are known as periods at high risk of IDA, it is speculated that Bach1 plays an important role in regulating erythropoiesis under ID especially during the early life stage. Because Bach1 is a unique transcription factor whose repressor function is inhibited by heme, its repressor activity is expected to increase under ID. In wild-type erythroblast, the heme concentration is decreased when iron is low, leading to the activation of Bach1, and thereby an inhibition of globin genes and Hmox1 transcription (Figure 7G). Therefore, both heme and globin are maintained at mutually stoichiometric levels by Bach1. In contrast, in the absence of Bach1, globin genes and Hmox1 are not down-regulated when the heme concentration decreases due to ID (Figure 7H). In this case, excess free globin may disturb erythroblast maturation. Therefore, Bach1 plays a critical role in sustained ID by working to balance heme and globin at the transcriptional level. This novel mechanism might be more specific than the function of HRI at the translational level, which phosphorylates eIF2a and therefore affects essentially global protein synthesis.26 The existence both of transcriptional and translational mechanisms governing the heme and globin balance indicates the importance of an appropriate maintenance of this balance in erythroblast maturation.
Massive alteration of the transcriptome in ID erythroblast may involve additional mechanisms. Although the details of a mechanism by which iron controls the gene expression levels remain an open question, the results of the PBAT analysis suggest that iron is involved in regulating the DNA methylation status. Although DNA methylation was not grossly affected by ID in wild-type mice, it is still possible that the observed DNA region-specific alterations affected the expression of nearby genes and alternated gene expressions induce massive transcriptomic modification as a whole, as seen in the result of transcriptomic analysis. Conversely, Jeffrey et al. previously reported that global DNA methylation of erythroblasts gradually decreases during maturation,44 suggesting the importance of the DNA demethylation in maturation. Histone methylation may also be affected since many histone demethylases are dependent on iron, such as non-heme iron-dependent histone demethylases (JmjC family).6 In addition, other regulators that are under the control of iron may participate in the transcriptomic response under ID, such as the IRE/IRP system.2,3 Very intriguingly, the alterations in DNA methylation in Bach1-deficient cells induced by ID were significant, indicating that Bach1 maintain the appropriate DNA methylation status especially under ID. It is also possible that such changes in DNA methylation contributed to the severe IDA observed in Bach1−/− mice. These possibilities are consistent with the observation that Bach1−/− mice showed slower recovery from IDA induced by LID-W. Bach1 may pre-condition genes that are affected by ID to return to normal regulation when iron stores are repleted. Further studies are required to address how Bach1 controls DNA methylation status under ID. In our experimental approach, there is a limitation as to how far Bach1 function can be totally excluded in non-erythroid cells. In other words, it is also possible that Bach1 regulates iron absorption and/or trafficking as well. To answer this question, additional studies, such as those using a tissue-specific conditional knockout system,45 are needed. Nonetheless, it is now clear that erythrocytes in ID reflect an active adaptation to iron depletion by changing gene expressions in erythroblasts according to available iron levels.
In conclusion, this study provides new insight into the function of iron and Bach1 in erythroblast maturation by using efficacious regimens that can induce severe ID. Iron is required for the activation of erythroblast maturation program and for maintaining the proper epigenetic DNA methylation status. The pathophysiology of IDA is not merely due to the material shortage, but a consequence of an altered DNA methylation status and gene regulatory network elicited by the loss of iron. Furthermore, Bach1 is necessary for the adaptation of erythroblast to ID. These findings reveal new aspects of IDA and might be informative for developing a solution for this worldwide health-care problem.
Supplementary Material
Acknowledgments
The authors would like to thank members of the Departments of Biochemistry and of Hematology and Rheumatology for insightful discussions and supports. We also thank Metallogenics Co. Ltd. for performing ICP-OES method analysis.
This work was partly performed in the Cooperative Research Project Program of the Medical Institute of Bioregulation, Kyushu University, Fukuoka, Japan.
Footnotes
Check the online version for the most updated information on this article, online supplements, and information on authorship & disclosures: www.haematologica.org/content/102/3/454
Funding
This work has been supported in part by Grants-in-aid (15H02506, 24390066, 25670156, 23116003, 21249014 and 26293225) from the Japan Society for the Promotion of Science. Additional initiative supports were from the Uehara Memorial Foundation, Takeda Foundation and Astellas Foundation for Research on Metabolic Disorders.
References
- 1.Andrews NC. Disorders of iron metabolism. N Engl J Med. 1999;341(26):1986–1995. [DOI] [PubMed] [Google Scholar]
- 2.Muckenthaler MU, Galy B, Hentze MW. Systemic iron homeostasis and the iron-responsive element/iron-regulatory protein (IRE/IRP) regulatory network. Annu Rev Nutr. 2008;(28):197–213. [DOI] [PubMed] [Google Scholar]
- 3.Moroishi T, Nishiyama M, Takeda Y, Iwai K, Nakayama KI. The FBXL5-IRP2 axis is integral to control of iron metabolism in vivo. Cell Metab. 2011;14(3):339–351. [DOI] [PubMed] [Google Scholar]
- 4.Liu S, Bhattacharya S, Han A, et al. Haem-regulated eIF2alpha kinase is necessary for adaptive gene expression in erythroid precursors under the stress of iron deficiency. Br J Haematol. 2008;143(1):129–137. [DOI] [PMC free article] [PubMed] [Google Scholar]
- 5.Tahiliani M, Koh KP, Shen Y, et al. Conversion of 5-methylcytosine to 5-hydroxymethylcytosine in mammalian DNA by MLL partner TET1. Science. 2009;324(5929):930–935. [DOI] [PMC free article] [PubMed] [Google Scholar]
- 6.Culhane JC, Cole PA. LSD1 and the chemistry of histone demethylation. Curr Opin Chem Biol. 2007;11(5):561–568. [DOI] [PMC free article] [PubMed] [Google Scholar]
- 7.Rund D, Rachmilewitz E. Beta-thalassemia. N Engl J Med. 2005;353(11):1135–1146. [DOI] [PubMed] [Google Scholar]
- 8.Kong Y, Zhou S, Kihm AJ, et al. Loss of alpha-hemoglobin-stabilizing protein impairs erythropoiesis and exacerbates beta-thalassemia. J Clin Invest. 2004; 114(10):1457–1466. [DOI] [PMC free article] [PubMed] [Google Scholar]
- 9.Arlet JB, Ribeil JA, Guillem F, et al. HSP70 sequestration by free alpha-globin promotes ineffective erythropoiesis in beta-thalassaemia. Nature. 2014;514(7521):242–246. [DOI] [PubMed] [Google Scholar]
- 10.Chen JJ. Regulation of protein synthesis by the heme-regulated eIF2alpha kinase: relevance to anemias. Blood. 2007;109(7):2693–2699. [DOI] [PMC free article] [PubMed] [Google Scholar]
- 11.Ogawa K, Sun J, Taketani S, et al. Heme mediates derepression of Maf recognition element through direct binding to transcription repressor Bach1. EMBO J. 2001;20(11):2835–2843. [DOI] [PMC free article] [PubMed] [Google Scholar]
- 12.Zenke-Kawasaki Y, Dohi Y, Katoh Y, et al. Heme induces ubiquitination and degradation of the transcription factor Bach1. Mol Cell Biol. 2007;27(19):6962–6971. [DOI] [PMC free article] [PubMed] [Google Scholar]
- 13.Suzuki H, Tashiro S, Hira S, et al. Heme regulates gene expression by triggering Crm1-dependent nuclear export of Bach1. EMBO J. 2004;23(13):2544–2553. [DOI] [PMC free article] [PubMed] [Google Scholar]
- 14.Tahara T, Sun J, Nakanishi K, et al. Heme positively regulates the expression of beta-globin at the locus control region via the transcriptional factor Bach1 in erythroid cells. J Biol Chem. 2004;279(7): 5480–5487. [DOI] [PubMed] [Google Scholar]
- 15.Reichard JF, Sartor MA, Puga A. BACH1 is a specific repressor of HMOX1 that is inactivated by arsenite. J Biol Chem. 2008; 283(33):22363–22370. [DOI] [PMC free article] [PubMed] [Google Scholar]
- 16.Sun J, Hoshino H, Takaku K, et al. Hemoprotein Bach1 regulates enhancer availability of heme oxygenase-1 gene. EMBO J. 2002;21(19):5216–5224. [DOI] [PMC free article] [PubMed] [Google Scholar]
- 17.Kassebaum NJ, Jasrasaria R, Naghavi M, et al. A systematic analysis of global anemia burden from 1990 to 2010. Blood. 2014; 123(5):615–624. [DOI] [PMC free article] [PubMed] [Google Scholar]
- 18.Lopez A, Cacoub P, Macdougall IC, Peyrin-Biroulet L. Iron deficiency anaemia. Lancet. 2016;387(10021):907–916. [DOI] [PubMed] [Google Scholar]
- 19.Ota K, Brydun A, Itoh-Nakadai A, Sun J, Igarashi K. Bach1 deficiency and accompanying overexpression of heme oxygenase-1 do not influence aging or tumorigenesis in mice. Oxid Med Cell Longev. 2014; 2014:757901. [DOI] [PMC free article] [PubMed] [Google Scholar]
- 20.Tanaka H, Muto A, Shima H, et al. Epigenetic Regulation of the Blimp-1 Gene (Prdm1) in B Cells Involves Bach2 and Histone Deacetylase 3. J Biol Chem. 2016; 291(12):6316–6330. [DOI] [PMC free article] [PubMed] [Google Scholar]
- 21.Fujiwara T, O’Geen H, Keles S, et al. Discovering hematopoietic mechanisms through genome-wide analysis of GATA factor chromatin occupancy. Mol Cell. 2009;36(4):667–681. [DOI] [PMC free article] [PubMed] [Google Scholar]
- 22.Smyth GK. Linear models and empirical bayes methods for assessing differential expression in microarray experiments. Stat Appl Genet Mol Biol. 2004;3:Article 3. [DOI] [PubMed] [Google Scholar]
- 23.Fu J, Khaybullin R, Zhang Y, Xia A, Qi X. Gene expression profiling leads to discovery of correlation of matrix metalloproteinase 11 and heparanase 2 in breast cancer progression. BMC Cancer. 2015;15:473. [DOI] [PMC free article] [PubMed] [Google Scholar]
- 24.Mootha VK, Lindgren CM, Eriksson KF, et al. PGC-1alpha-responsive genes involved in oxidative phosphorylation are coordinately downregulated in human diabetes. Nat Genet. 2003;34(3):267–273. [DOI] [PubMed] [Google Scholar]
- 25.Subramanian A, Tamayo P, Mootha VK, et al. Gene set enrichment analysis: a knowledge-based approach for interpreting genome-wide expression profiles. Proc Natl Acad Sci USA. 2005;102(43):15545–15550. [DOI] [PMC free article] [PubMed] [Google Scholar]
- 26.Han AP, Yu C, Lu L, et al. Heme-regulated eIF2alpha kinase (HRI) is required for translational regulation and survival of erythroid precursors in iron deficiency. EMBO J. 2001;20(23):6909–6918. [DOI] [PMC free article] [PubMed] [Google Scholar]
- 27.Knight ZA, Schmidt SF, Birsoy K, Tan K, Friedman JM. A critical role for mTORC1 in erythropoiesis and anemia. Elife. 2014;3: e01913. [DOI] [PMC free article] [PubMed] [Google Scholar]
- 28.Liu J, Zhang J, Ginzburg Y, et al. Quantitative analysis of murine terminal erythroid differentiation in vivo: novel method to study normal and disordered erythropoiesis. Blood. 2013;121(8):e43–49. [DOI] [PMC free article] [PubMed] [Google Scholar]
- 29.Socolovsky M, Nam H, Fleming MD, Haase VH, Brugnara C, Lodish HF. Ineffective erythropoiesis in Stat5a(−/−)5b(−/−) mice due to decreased survival of early erythroblasts. Blood. 2001;98(12):3261–3273. [DOI] [PubMed] [Google Scholar]
- 30.Schranzhofer M, Schifrer M, Cabrera JA, et al. Remodeling the regulation of iron metabolism during erythroid differentiation to ensure efficient heme biosynthesis. Blood. 2006;107(10):4159–4167. [DOI] [PubMed] [Google Scholar]
- 31.Chen C, Paw BH. Cellular and mitochondrial iron homeostasis in vertebrates. Biochim Biophys Acta. 2012;1823(9):1459–1467. [DOI] [PMC free article] [PubMed] [Google Scholar]
- 32.Kang YA, Sanalkumar R, O’Geen H, et al. Autophagy driven by a master regulator of hematopoiesis. Mol Cell Biol. 2012; 32(1):226–239. [DOI] [PMC free article] [PubMed] [Google Scholar]
- 33.Mortensen M, Ferguson DJ, Edelmann M, et al. Loss of autophagy in erythroid cells leads to defective removal of mitochondria and severe anemia in vivo. Proc Natl Acad Sci USA. 2010;107(2):832–837. [DOI] [PMC free article] [PubMed] [Google Scholar]
- 34.Igarashi K, Watanabe-Matsui M. Wearing red for signaling: the heme-bach axis in heme metabolism, oxidative stress response and iron immunology. Tohoku J Exp Med. 2014;232(4):229–253. [DOI] [PubMed] [Google Scholar]
- 35.Fukuda Y, Fujita H, Garbaczewski L, Sassa S. Regulation of beta-globin mRNA accumulation by heme in dimethyl sulfoxide (DMSO)-sensitive and DMSO-resistant murine erythroleukemia cells. Blood. 1994; 83(6):1662–1667. [PubMed] [Google Scholar]
- 36.Brand M, Ranish JA, Kummer NT, et al. Dynamic changes in transcription factor complexes during erythroid differentiation revealed by quantitative proteomics. Nat Struct Mol Biol. 2004;11(1):73–80. [DOI] [PubMed] [Google Scholar]
- 37.Sun J, Brand M, Zenke Y, Tashiro S, Groudine M, Igarashi K. Heme regulates the dynamic exchange of Bach1 and NF-E2-related factors in the Maf transcription factor network. Proc Natl Acad Sci USA. 2004; 101(6):1461–1466. [DOI] [PMC free article] [PubMed] [Google Scholar]
- 38.Tahara T, Sun J, Igarashi K, Taketani S. Heme-dependent up-regulation of the alpha-globin gene expression by transcriptional repressor Bach1 in erythroid cells. Biochem Biophys Res Commun. 2004; 324(1):77–85. [DOI] [PubMed] [Google Scholar]
- 39.De Franceschi L, Bertoldi M, Matte A, et al. Oxidative stress and beta-thalassemic erythroid cells behind the molecular defect. Oxid Med Cell Longev. 2013;2013: 985210. [DOI] [PMC free article] [PubMed] [Google Scholar]
- 40.Challen GA, Sun D, Jeong M, et al. Dnmt3a is essential for hematopoietic stem cell differentiation. Nat Genet. 2012;44(1):23–31. [DOI] [PMC free article] [PubMed] [Google Scholar]
- 41.Luo M, Jeong M, Sun D, et al. Long non-coding RNAs control hematopoietic stem cell function. Cell Stem Cell. 2015; 16(4):426–438. [DOI] [PMC free article] [PubMed] [Google Scholar]
- 42.Tanimura N, Miller E, Igarashi K, et al. Mechanism governing heme synthesis reveals a GATA factor/heme circuit that controls differentiation. EMBO Rep. 2016; 17(2):249–265. [DOI] [PMC free article] [PubMed] [Google Scholar]
- 43.Parodi E, Giraudo MT, Ricceri F, Aurucci ML, Mazzone R, Ramenghi U. Absolute Reticulocyte Count and Reticulocyte Hemoglobin Content as Predictors of Early Response to Exclusive Oral Iron in Children with Iron Deficiency Anemia. Anemia. 2016;2016:7345835. [DOI] [PMC free article] [PubMed] [Google Scholar]
- 44.Shearstone JR, Pop R, Bock C, Boyle P, Meissner A, Socolovsky M. Global DNA demethylation during mouse erythropoiesis in vivo. Science. 2011; 334(6057):799–802. [DOI] [PMC free article] [PubMed] [Google Scholar]
- 45.Orban PC, Chui D, Marth JD. Tissue- and site-specific DNA recombination in transgenic mice. Proc Natl Acad Sci USA. 1992; 89(15):6861–6865. [DOI] [PMC free article] [PubMed] [Google Scholar]
Associated Data
This section collects any data citations, data availability statements, or supplementary materials included in this article.


