Monoclonal (M) protein can be detected in the serum and/or urine of patients with multiple myeloma (MM) as either intact immunoglobulins (Ig) or free light chains (FLC). Current guidelines1 recommend the use of serum and urine electrophoresis plus immunofixation to evaluate and monitor response to therapy in MM patients with measurable M-protein. In addition, measurement of serum FLC (sFLC) ratio (sFLCR)2 is required to fulfill the definition of stringent complete response and to define response or progressive disease (PD) in oligosecretory or non-secretory MM.1,3,4 Nonetheless, sFLC assay might be an appropriate tool also in secretory MM, since an imbalance in sFLCR can be detected in approximately 90% of patients with Ig-secretory MM (Ig-MM)5 and in almost all patients with light chain MM (LC-MM).6 Moreover, it is well recognized that sFLC escape might occur before, or at the time of, relapse7–9 and increasing levels of sFLC at progression have been reported to predict a worse prognosis.7 However, most of these studies are biased by the lack of serial assay measurements. Furthermore, the prognostic significance of increased levels of sFLC in the absence of any additional parameter defining PD or clinical relapse (Rel)1 remains an area of investigation. To address this issue, we analyzed a cohort of 100 MM patients at our center who received first-line, fixed-duration, novel agent-based therapies and for whom sFLCR measurements after treatment were available every 3–4 months until relapse. sFLC assay was performed by BN II nephelometer6,10 as part of routine clinical care. International Myeloma Working Group (IMWG) criteria were used for the definition of measurable disease, PD and Rel.1 Criteria defining PD in oligo/non-secretory MM according to sFLC levels1 were used to identify patients with secretory MM who showed rising sFLC levels in the absence of any additional parameter consistent with PD or Rel. Time to second progression (2nd TTP) and overall survival (OS) after relapse were calculated from the date of first progression to the date of second progression or death, respectively, or of last follow up. Time to second-line therapy was the interval between the date of first progression and the date when salvage treatment was started.
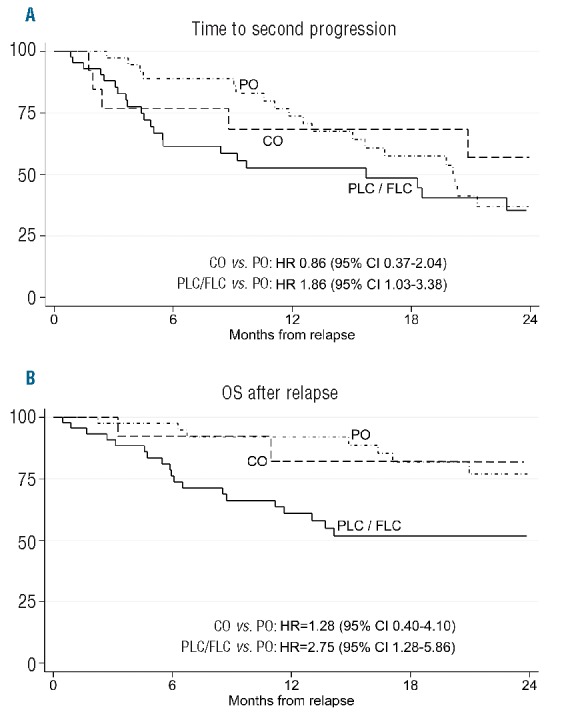
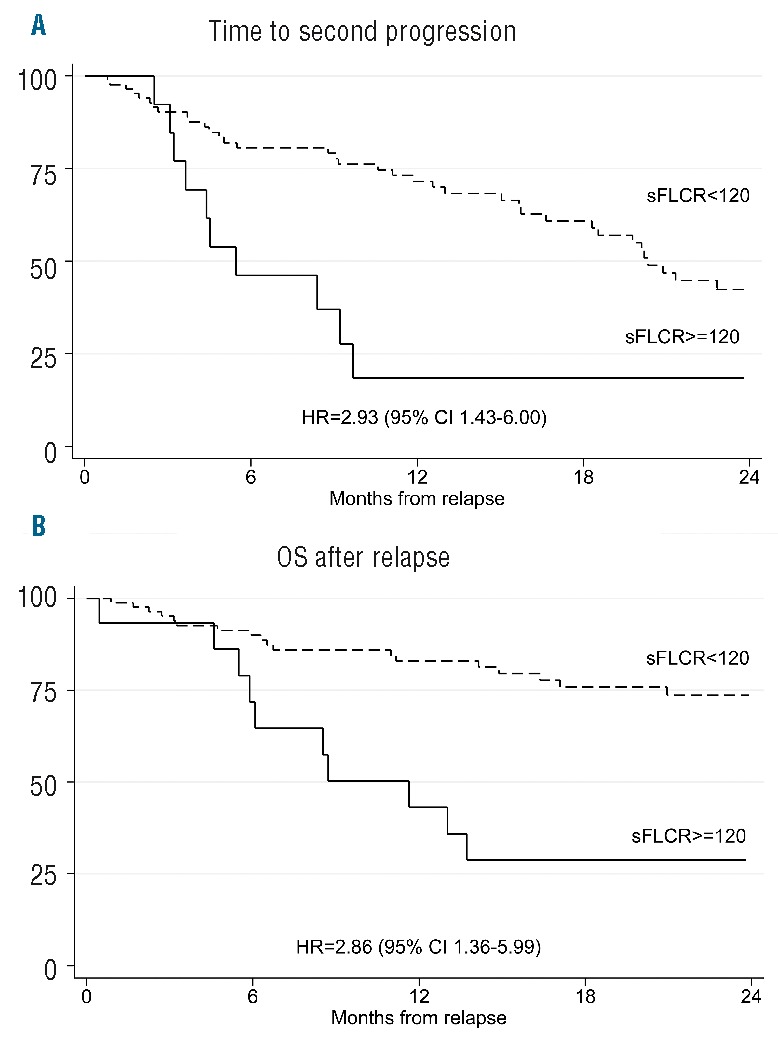
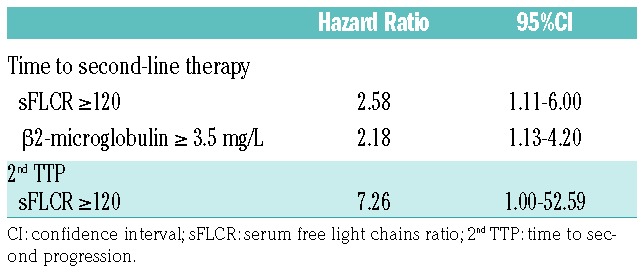
At diagnosis, 80 patients were classified as having Ig-MM, 15 LC-MM and 5 oligo/non-secretory disease. sFLC measurements were available at baseline in 81 patients, of whom 63 had sFLC measurable disease, as defined by an abnormal sFLCR and involved sFLC levels 100 mg/L or more.1 First-line treatments included the proteasome-inhibitor (PI) bortezomib in 45 patients, the immunomodulators (IMiDs) thalidomide or lenalidomide in 25 patients, and both bortezomib and IMiDs in the last 30 patients. Fifty patients received a single or double autologous stem cell transplantation. Median follow up was 63 [interquartile range (IQR) 38–83] months from diagnosis and 23 (IQR 13–37) months from progression. Best response rates were: complete response, 32%; very good partial response, 35%; partial response, 27%, and stable disease or PD, 6%. Overall, in 66 patients, sFLCR after up-front therapy was in the normal range. According to IMWG consensus recommendations,4 88 patients required a second-line therapy due to Rel (n=72) or paraprotein relapse (n=16). The remaining 12 patients did not receive salvage therapy due to a paraprotein relapse not fulfilling criteria for restarting treatment (n=8) or early death (n=3) or a concomitant solid tumor (n=1). Serial monitoring of serum/urine M-protein and sFLC levels throughout the follow-up phase after first-line treatment allowed 4 different patterns of relapse to be identified. These were characterized by: 1) an increase in both M-protein and sFLC (n=30); 2) an increase in M-protein only (n=42); 3) an increase in sFLC levels only (n=15), as established according to IMWG criteria for oligo/non-secretory MM;1 4) the presence of one or more criteria defining Rel,1 without any concurrent change in M-protein or sFLC (n=13). Patterns of relapse characterized by an increase in sFLC levels, with or without concomitant rise in M-protein, were observed more frequently in patients with abnormal versus normal sFLCR at baseline (62% vs. 17%; P=0.001). Among the 80 patients with Ig-MM, patterns of relapse were: 32% both M-protein and sFLC (n=26), 48% M-protein only (n=38), 10% sFLC only (n=8), and 10% Rel without change in M-protein or sFLC (n=8) compared with 27% both M-protein and sFLC (n=4), 27% M-protein only (n=4), 40% sFLC only (n=6) and 6% Rel without change in M-protein or sFLC (n=1) for the 15 patients with LC-MM. Patients with LC-MM had a higher frequency of relapse characterized by isolated sFLC increasing than those with Ig-MM (P=0.043). In the subgroup of 14 patients with secretory-MM (8 Ig-MM and 6 LC-MM) and an sFLC only pattern of relapse, an increase in sFLCs preceded by 2.3 months (IQR 1.7–6.1) the onset of any conventional parameter defining PD, including Rel with organ damage in 10 (71%) of them, and by 4.0 (IQR 2.8–9.3) months the start of subsequent salvage therapy. Median increase in the difference between involved and uninvolved sFLC levels was 224.1 mg/L (IQR 138.3–437.9) at the time of escape and 687.5 mg/L (IQR 224.1–1819.8) at the time of PD or Rel. Overall, patients who experienced a relapse with an increase in both M-protein and sFLC or sFLC only had higher creatinine levels than those with an increase in M-protein only or Rel without change in M-protein or sFLC (P=0.025). Conversely, no differences between these subgroups were seen with respect to the other disease- and tumor-related characteristics that could potentially influence clinical outcomes. Second-line treatments including IMiDs (47%), PI (23%) or both these agents (30%) were equally distributed among patients with different patterns of relapse. Time to second-line therapy was shorter for patients relapsing with both M-protein and sFLC, sFLC-only or Rel without increase in M-protein or sFLC levels, than for those relapsing with M-protein only (P=0.001, trend P=0.0001). Moreover, patterns of relapse characterized by an increase in sFLC, with or without a concomitant rise in M-protein levels, correlated with worse 2nd TTP and OS after relapse as compared to the other patterns. In particular, patients relapsing with both M-protein and sFLC or sFLC only had a 2-fold increase in the risk of second progression [Hazard Ratio (HR 1.86), 95%CI: 1.03–3.38] and a 3-fold increase in the risk of death (HR 2.75, 95%CI: 1.28–5.86), as compared to those relapsing with M-protein only (Figure 1). To overcome the potentially confounding influence of renal function changes on sFLC levels, we analyzed the prognostic value of sFLCR at relapse. An involved/uninvolved sFLCR of 120 or more (high sFLCR) proved to be the most powerful cut-off value for identification of patients with the worst outcomes after relapse and was observed in 15 patients (10 relapsing with both M-protein and sFLC; 5 with sFLC only). Median levels of uninvolved sFLC were similar in patients with low or high sFLCR, suggesting that a high sFLCR mostly reflected high levels of involved sFLC. Out of the 15 patients with a high sFLCR at relapse, 7 (47%) had an sFLC of 120 or more at diagnosis, whereas a lower value was reported in the remaining 53%. No differences between patients with high and low sFLCR were seen with respect to different second-line therapies including one or more of novel agents. In comparison with sFLCR less than 120, a high sFLCR was associated with significantly shorter 2nd TTP (HR 2.93, 95%CI: 1.43–6.00) and OS after relapse (HR 2.86, 95%CI: 1.36–5.99) (Figure 2). In a multivariate Cox regression analysis including several factors potentially influencing post-relapse outcomes, sFLCR of 120 or more was the leading independent variable predicting for shorter time to second-line therapy (HR 2.58, 95%CI: 1.11–6.00) and time to second-line therapy (HR 7.26, 95%CI: 1.00–52.59) (Table 1). These results underscore the value of serial sFLC measurements performed throughout the course of MM after novel agent-based therapies. In particular, we observed that an increase in sFLC levels was the first sign of progression in 15% of the overall patient population and in 40% of patients with LC-MM; this is consistent with the greater sensitivity of sFLC assay in comparison with urine electrophoresis for monitoring LC-MM.11 Importantly, in approximately 70% of patients with either Ig-MM or LC-MM and relapsing with sFLC only, an increase in sFLC levels predicted an imminent risk of progression with end-organ damage. These findings are consistent with those previously reported by our group,9 and highlight the importance of close laboratory monitoring and the use of novel functional imaging techniques to capture early signs of organ dysfunction when an sFLC only pattern of relapse has occurred. Moreover, in our study, more aggressive outcomes of the disease were seen in patients with progression defined according to an increase in sFLC levels, with or without a concomitant rise in M-protein. Reduced OS after relapse was previously reported in patients with Ig-MM and increased sFLC levels;7 results of our analysis extend and confirm these data, since a relapse defined by increasing levels of sFLC, even in the absence of any additional parameter of PD or Rel, correlated with a shorter time to second-line therapy, a 2-fold increase in the risk of second progression and a 3-fold increase in the risk of death, as compared to a relapse with increase in M-protein only. Lastly, we found that an sFLCR of 120 or more at relapse predicted for poor outcomes and retained independent prognostic value in a multivariate analysis. These data further support the evidence that elevated sFLC levels correlate with more aggressive clinical outcomes of MM,9,12,13 and suggest the possibility of using a high sFLCR to identify relapsed MM patients who are at high risk of developing imminent organ damage, and who are, therefore, to be considered eligible for prompt salvage treatment.
Figure 1.

Time to second progression (2nd TTP) and overall survival (OS) after relapse, according to different patterns of relapse. Patients relapsing with progression characterized by an increase in both M-protein and serum free light chain (sFLC) (PLC) or progression characterized by isolated sFLC increasing (FLC) showed worse 2ndTTP and OS after relapse than other categories of relapse. PO: progression characterized by an increase in monoclonal (M) protein only; CO: clinical relapse in the absence of increase in M-protein or sFLC levels.
Figure 2.

Time to second progression (2nd TTP) and overall survival (OS) after relapse, according to serum free light chains ratio (sFLCR). High sFLCR at progression was associated with shorter 2nd TTP and OS after relapse than sFLCR less than 120.
Table 1.
Cox regression analysis of variables associated with shorter time to second-line therapy and time to second progression.

In conclusion, despite the limitations due to the retrospective nature of this analysis and to heterogeneous therapies, these results support the possible inclusion of sFLC levels in the current criteria for defining PD, irrespective of the presence of measurable M-protein levels at baseline. Moreover, sFLC assay may be a valuable tool for predicting the risk of symptomatic progression and prognosis. Further prospective studies are needed to confirm these data.
Supplementary Material
Footnotes
Information on authorship, contributions, and financial & other disclosures was provided by the authors and is available with the online version of this article at www.haematologica.org.
References
- 1.Durie BG, Harousseau JL, Miguel JS, et al. International uniform response criteria for multiple myeloma. Leukemia. 2006;20(9):1467–1473. [DOI] [PubMed] [Google Scholar]
- 2.Bradwell AR, Carr-Smith HD, Mead GP, et al. Highly sensitive, automated immunoassay for immunoglobulin free light chains in serum and urine. Clin Chem. 2001;47(4):673–680. [PubMed] [Google Scholar]
- 3.Dispenzieri A, Kyle R, Merlini G, et al. International Myeloma Working Group guidelines for serum-free light chain analysis in multiple myeloma and related disorders. Leukemia. 2009;23(2):215–224. [DOI] [PubMed] [Google Scholar]
- 4.Rajkumar SV, Harousseau JL, Durie B, et al. Consensus recommendations for the uniform reporting of clinical trials: report of the International Myeloma Workshop Consensus Panel 1. Blood. 2011;117(18):4691–4695. [DOI] [PMC free article] [PubMed] [Google Scholar]
- 5.Mead GP, Carr-Smith HD, Drayson MT, Morgan GJ, Child JA, Bradwell AR. Serum free light chains for monitoring multiple myeloma. Br J Haematol. 2004;126(3):348–354. [DOI] [PubMed] [Google Scholar]
- 6.Bradwell AR, Carr-Smith HD, Mead GP, Harvey TC, Drayson MT. Serum test for assessment of patients with Bence Jones myeloma. Lancet. 2003;361(9356):489–491. [DOI] [PubMed] [Google Scholar]
- 7.Brioli A, Giles H, Pawlyn C, et al. Serum free immunoglobulin light chain evaluation as a marker of impact from intraclonal heterogeneity on myeloma outcome. Blood. 2014;123(22):3414–3419. [DOI] [PubMed] [Google Scholar]
- 8.Kuhnemund A, Liebisch P, Bauchmuller K, et al. ‘Light-chain escape-multiple myeloma’-an escape phenomenon from plateau phase: report of the largest patient series using LC-monitoring. J Cancer Res Clin Oncol. 2009;135(3):477–484. [DOI] [PMC free article] [PubMed] [Google Scholar]
- 9.Tacchetti P, Cavo M, Rocchi S, et al. Prognostic impact of serial measurements of serum-free light chain assay throughout the course of newly diagnosed multiple myeloma treated with bortezomib-based regimens. Leuk Lymphoma. 2016;57(9):2058–2064. [DOI] [PubMed] [Google Scholar]
- 10.Drayson M, Tang LX, Drew R, Mead GP, Carr-Smith H, Bradwell AR. Serum free light-chain measurements for identifying and monitoring patients with nonsecretory multiple myeloma. Blood. 2001;97(9):2900–2902. [DOI] [PubMed] [Google Scholar]
- 11.Dejoie T, Attal M, Moreau P, Harousseau JL, Avet-Loiseau H. Comparison of serum free light chain and urine electrophoresis for the detection of the light chain component of monoclonal immunoglobulins in light chain and intact immunoglobulin multiple myeloma. Haematologica. 2016;101(3):356–362. [DOI] [PMC free article] [PubMed] [Google Scholar]
- 12.Snozek CL, Katzmann JA, Kyle RA, et al. Prognostic value of the serum free light chain ratio in newly diagnosed myeloma: proposed incorporation into the international staging system. Leukemia. 2008;22(10):1933–1937. [DOI] [PMC free article] [PubMed] [Google Scholar]
- 13.Larsen JT, Kumar SK, Dispenzieri A, Kyle RA, Katzmann JA, Rajkumar SV. Serum free light chain ratio as a biomarker for high-risk smoldering multiple myeloma. Leukemia. 2013;27(4):941–946. [DOI] [PMC free article] [PubMed] [Google Scholar]
Associated Data
This section collects any data citations, data availability statements, or supplementary materials included in this article.


