

Background: β-Structured oligomers of the amyloid β peptide are considered neurotoxic and on-pathway to amyloid fibril formation.
Results: Surfactant-induced co-aggregated oligomers show dynamic rapid exchange with free peptide during a slow fibril formation process.
Conclusion: β-Structure inducing small molecules kinetically promote peptide assembly into co-aggregates.
Significance: Knowledge about molecular mechanisms of peptide aggregation modulators is potentially helpful for therapeutic purposes.
Keywords: Aggregation, Alzheimer Disease, Amyloid, Circular Dichroism (CD), NMR, Amyloid β Peptide, NMR Relaxation Dispersion, Small Angle X-ray Scattering, Surfactant
Abstract
Intermediate amyloidogenic states along the amyloid β peptide (Aβ) aggregation pathway have been shown to be linked to neurotoxicity. To shed more light on the different structures that may arise during Aβ aggregation, we here investigate surfactant-induced Aβ aggregation. This process leads to co-aggregates featuring a β-structure motif that is characteristic for mature amyloid-like structures. Surfactants induce secondary structure in Aβ in a concentration-dependent manner, from predominantly random coil at low surfactant concentration, via β-structure to the fully formed α-helical state at high surfactant concentration. The β-rich state is the most aggregation-prone as monitored by thioflavin T fluorescence. Small angle x-ray scattering reveals initial globular structures of surfactant-Aβ co-aggregated oligomers and formation of elongated fibrils during a slow aggregation process. Alongside this slow (minutes to hours time scale) fibrillation process, much faster dynamic exchange (kex ∼1100 s−1) takes place between free and co-aggregate-bound peptide. The two hydrophobic segments of the peptide are directly involved in the chemical exchange and interact with the hydrophobic part of the co-aggregates. Our findings suggest a model for surfactant-induced aggregation where free peptide and surfactant initially co-aggregate to dynamic globular oligomers and eventually form elongated fibrils. When interacting with β-structure promoting substances, such as surfactants, Aβ is kinetically driven toward an aggregation-prone state.
Introduction
Protein self-assembly is closely linked to neurodegenerative disorders, such as Alzheimer disease (1). The amyloid β peptide (Aβ)3 is prone to form amyloid deposits whose appearance in the brain of patients with Alzheimer disease is characteristic for Alzheimer disease (1, 2). A strong link between the appearance of soluble oligomeric assemblies and disease progression has been shown, identifying the early intermediate aggregates as the most toxic species (2, 3). Hence, the characterization of these early formed oligomeric or protofibrillar aggregates is crucial for a detailed understanding of the molecular process that is linked to the pathogenesis of Alzheimer disease. The atomic structures of the polymorphic amyloid fibrils formed by the Aβ peptide are not known in detail. Experimental results from solid-state nuclear magnetic resonance (NMR), cryo-electron microscopy, and x-ray studies have been used to model three-dimensional structures of the fibrils (4–7). Information on the soluble, aggregated intermediate states of the peptide is relatively scattered and comes from a variety of spectroscopic studies, including circular dichroism (CD) and infrared spectroscopy, which do not report on atomic details (4).
Aβ interacting with selected small molecules may give rise to relatively stable systems that are amenable to detailed studies under controlled kinetic conditions (8–11). One common denominator for these small molecules is that they often feature some surfactant-like properties (9, 11, 12).
Lipids are known to be associated with in vivo amyloid plaques (13, 14). Several studies have also been devoted to the effects of lipids on Aβ aggregation pathways (15, 16). Anionic surfactants like SDS and lithium dodecyl sulfate (LiDS) may be used as model systems to study Aβ-lipid interactions, particularly for solution NMR studies when low molecular weight complexes are important.
Here, we study Aβ interacting with SDS and LiDS that have been suggested to participate in the aggregation process under well defined conditions (17), giving rise to relatively stable amyloidogenic co-aggregated intermediates (18). Low concentrations of surfactants favor intermolecular β-sheet formation and, hence, may be used for studying intermediates that exhibit a β-rich structure (17).
SDS-induced aggregates of α-synuclein (αSN), a protein implicated in Parkinson disease, were shown to exhibit a structure with ellipsoidal SDS micelles connected by αSN molecules, which are wrapped around the micelles, penetrating the micelle headgroup corona (19). In the most aggregation-prone state, 12 SDS molecules per αSN molecule are associated in the aggregate (19).
Aβ monomers adopt a dominant random coil-like structure in solution at physiological pH (20). Addition of a submicellar concentration of SDS or LiDS causes a conformational change to a β-structure that is accompanied by uniform loss of NMR signals (18). At higher surfactant concentrations, above the critical micelle concentration, Aβ forms α-helices in two peptide segments that involve residues 15–24 and 29–35 (21). Both helices are positioned inside the micelle where the central helix (residues 15–24) is close to the headgroup layer (21). A small angle x-ray (SAXS) and neutron scattering study on 115 μm Aβ in the presence of 6 and 20 mm SDS, a condition where Aβ adopts α-helical structure, presented a time-dependent formation of a globular SDS-Aβ complex showing a core-shell ellipsoid structure (22) as also observed for αSN (19).
In contrast, this study focuses on the characterization of aggregates that exhibit β-structure in the peptide. The state featuring β-structure is particularly interesting because β-sheet formation is likely to be on-pathway for Aβ fibrillation (1). A submicellar concentration of surfactant induces β-structure in the peptide, which is observed by CD, but causes NMR signal attenuation involving the whole peptide sequence. This has made structural characterization difficult (18). Similar loss of NMR signal was reported for Aβ and αSN in the presence of small hydrophobic molecules (9–11, 23) and phospholipids (24). The loss of NMR signal intensity may be attributed to dynamic exchange between free and complex-bound peptide, and the presence of this exchange has been experimentally shown for Aβ in the presence of two small molecule amyloid modulators, lacmoid and Congo red, using 15N NMR relaxation dispersion (10). In that study, at conditions where about 50% of the initial NMR signal is lost, only a small population of the peptide is bound and forms dynamic co-aggregates with the dyes. Intermediate chemical exchange between free and bound peptide kinetically modulates Aβ aggregation.
In this study, in addition to NMR we characterize the structural states of Aβ under different surfactant concentrations using optical spectroscopy and SAXS. The focus is on the β-rich state because this state should provide further insight into β-structured amyloid intermediates. These are of great interest because they are proposed to be neurotoxic (3, 25) and on-pathway for insoluble amyloid fibril formation (1).
EXPERIMENTAL PROCEDURES
Materials
Aβ(1–40) and 15N-labeled 15N-Aβ(1–40) peptide solutions were prepared in 10 mm sodium-phosphate buffer (pH 7.3 to 7.5) as described previously (9, 18, 20). The surfactants SDS and LiDS were obtained from Sigma and dissolved in 10 mm sodium-phosphate buffer. For titration experiments, a 0.5 m surfactant stock solution was diluted to lower concentrations.
CD Spectroscopy
CD spectra were recorded in the far-UV region from 260 to 200 nm with a step size of 0.5 nm. Surfactant titration experiments were conducted on a Jasco J-810 CD spectrometer (Jasco Inc., Easton, MD) using a bandwidth of 2.0 nm, a scan speed of 100 nm/min, and a response time of 2 s. Samples of ThT end point states were recorded on a Chirascan CD spectrometer (Applied Photophysics, Leatherhead, UK) using a bandwidth of 1 nm and a time of 0.25 s per point. All spectra were averaged over three collected scans, and the background signals were subtracted for each peptide spectrum. A cuvette with an optical path length of 1 mm was chosen, and spectra were measured without agitation at 28 and 3 °C for SDS and LiDS titration experiments, respectively.
Pyrene Fluorescence
The pyrene emission spectrum was measured at 28 °C on a Varian Cary Eclipse fluorimeter from 360 to 405 nm with an excitation wavelength of 335 nm using excitation and emission slit widths of 2.5 and 5 nm, respectively. A 200 μm pyrene stock solution in ethanol was prepared and added to 5–75 μm Aβ samples to a final concentration of 2 μm in 10 mm sodium-phosphate buffer. Small amounts of SDS were added to obtain final SDS concentrations between 0.01 and 10 mm. The samples were stirred during the whole measurements. The ratio of peak intensities was measured at emission wavelengths of 383.5 and 372.5 nm (26).
ThT Fluorescence Spectroscopy
Three replicates of 150 μm Aβ, without and with the presence of 0.9, 2.75, and 12.5 mm SDS, were transferred to a 96-well plate. A 4 mm ThT stock solution was used for the experiments and diluted to 25 μm ThT in the samples. The fluorescence measurements were performed by a Fluostar Omega (BMG Labtech) fluorescence plate reader at 28 °C without agitation. The fluorophores were excited at 440 nm, and emission was measured at 480 nm in 5-min intervals. The lag time for the Aβ-alone sample was determined using the parameters of a sigmoidal fit (27).
SAXS
Data were collected on the SAXS pinhole camera at Aarhus University (28), which is equipped with a rotating anode giving CuKα radiation with a wavelength of λ = 1.54 Å. The samples were measured in quartz capillaries, and background scattering from pure buffer solutions was measured in the same capillaries and subtracted from the sample scattering. For 0.9 and 2.75 mm SDS samples, time-resolved scattering patterns were collected with an acquisition time of 5 min (first 3 h), 10 min (following 3 h), and 20 min (after 6 h for the 0.9 mm SDS sample only) per data frame. The measurement on the 2.75 mm SDS sample was stopped after 6 h, and then the sample was measured again after 16 h. Measurements were performed at 28 and 3 °C for samples containing SDS and LiDS, respectively.
SAXS Modeling
The different data sets were fitted to different structural models. For the fibrils in the 2.75 mm SDS and 2.5 mm LiDS samples, a model consisting of a mixture of a single cylinder with finite length and a solid sphere was applied. In the implementation of the cylinder form factor, it was exploited that the form factors of very anisotropic particles can be factorized into a cross-section form factor, Pcs(q), and a shape factor P(q)′ (29): Pcyl(q) = Pcs(q)P(q)′ with the scattering vector modulus q = (4π sin θ)/λ, where 2θ is the scattering angle, and λ is the x-ray wavelength. The shape factor for an infinitely thin rod was used as shown in Equation 1 (30),
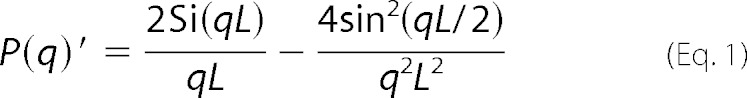 |
where L is the length of the rod, and Si(x) = ∫0xt−1 sin(t) dt. The cross-section form factor for a homogeneous cylinder model is shown in Equation 2,
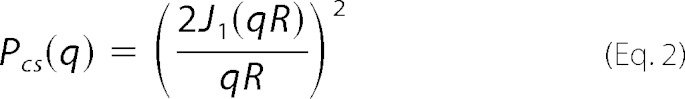 |
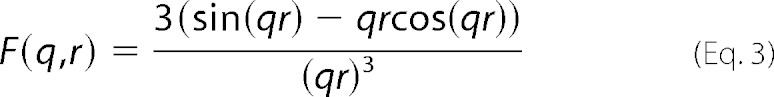
Here R is the radius of the cylinder and J1(x) is the first-order Bessel function of the first kind (29). The form factor of the sphere was calculated as Psph(q) = (F(q))2, where F(q,r) is the scattering amplitude of a sphere of radius r as shown in Equation 3,
 |
For the 0.9 mm SDS sample the model consisted of two parallel identical giving the expression shown in Equation 4 (31),
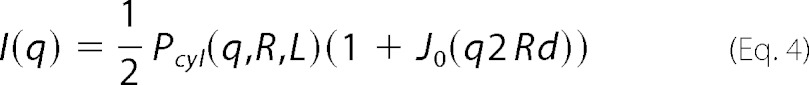 |
J0(x) is the zero order Bessel function of the first kind, and 2Rd is the center-to-center distance of the cylinders with the dimensionless scaling factor d.
The pure SDS micelles and the sample with Aβ and 10 mm SDS were fitted with a core shell ellipsoid of revolution with core radius Rc, core eccentricity ϵc, and shell thickness D, giving an outer shell radius Rs = Rc + D and an outer eccentricity of ϵs = (ϵcRc + D)/(Rc + D). The core-shell ellipsoid form factor was implemented as shown in Equation 5,
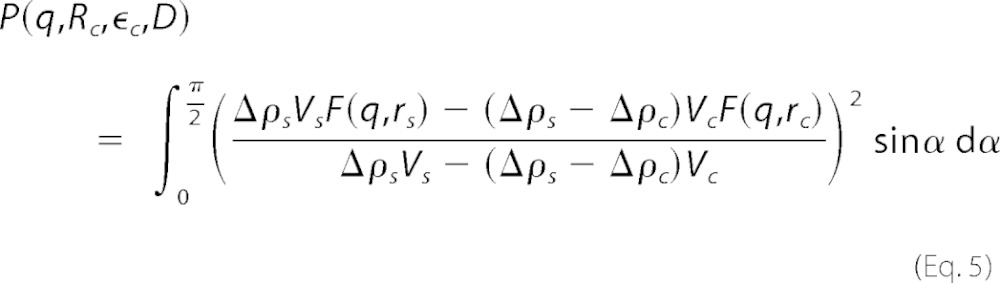 |
The subscript s denotes the shell and c the core; Δρ is the excess electron density; Vc and Vs are the volumes of the core and total ellipsoid, respectively, and Vi = 4/3 πϵiRi3, and ri = Ri(sin2 α + ϵi2 cos2 α)1/2. The micellar interfaces were made diffuse by multiplying the amplitudes by exp(−q2 σ2/2), where σ is the width of the interfaces, which was fixed to 1 and 3 Å for the core-shell and shell-solvent interfaces, respectively. In the pure SDS sample, an effective hard sphere structure factor (32) was included to fit the low q region, where the inter-micelle interactions influence the SAXS data.
TEM
Aliquots of 5 μl of fibril solution (150 μm peptide concentration) were mounted on 400-mesh carbon-coated, glow-discharged nickel grids for 30 s. The grids were washed with 1 drop of double distilled water and stained with 3 drops of 1% phosphotungstic acid, pH 7.2. Samples were inspected in a JEOL 1010 transmission electron microscope at 60 keV. Images were obtained using an electron-sensitive Olympus KeenView CCD camera (33). Samples were recorded before and after incubation at 28 °C for 30 min and 2, 4, and >45 h (45 h at 28 °C followed by storage at 4 °C for 4 days) with arbitrary magnifications of 25,000 (for samples after >45 h) and 40,000 (all other samples).
Nuclear Magnetic Resonance
All NMR experiments were conducted at 10 °C on a Bruker Avance 700 MHz spectrometer equipped with a cryogenic probe. LiDS was titrated into a 150 μm 15N-Aβ(1–40) sample to a final surfactant concentration of 1.15 mm corresponding to a molar ratio of 1:7.7 Aβ/LiDS. 1H-15N heteronuclear single quantum coherence (HSQC) experiments were performed using 1748 × 128 complex points and four scans per transient. Relaxation dispersion experiments were performed using a CPMG pulse train scheme (34). Transverse relaxation rates R2obs were calculated from the cross-peak intensities (peak heights). A fitting procedure yields the chemical exchange rate kex, the bound population pB, the relaxation rates R2calc, and the chemical shift difference |Δω| between the two states A and B (10, 35–37). A global fit analysis was performed where the global dynamic parameters kex and pB were kept fixed for all residues, whereas R2calc and |Δω| were individual residue-specific fitting parameters. Here, the Akaike Information Criterion was used to prefer the global motion model to a model where all four parameters were allowed to adopt individual residue-specific values. An F test was applied comparing a fit with four individual residue-specific parameters with a fit to a constant value, and only data with significant F test values (p < 0.02) were used for analysis. Only residues whose individual fitting parameters pB and kex lie within a confidence interval of 99% of the selection were assumed to undergo a global motion process and were included in the global fit analysis. The size of the co-aggregates may be estimated as described previously (10) by calculating the averaged transverse relaxation rates R̄2B0 of the bound state with the fitting parameters R̄2calc and pB and the experimental determined average relaxation rate of the free peptide (38) R̄2A0 = 7.1 s−1 by R̄2calc = (1 − pB) R̄2A0 + pB R̄2B0. Assuming a spherical form the corresponding hydrodynamic radius of the co-aggregate is obtained.
RESULTS
Surfactant Induces a Three-state Transition of Aβ
SDS titration experiments on 150 μm Aβ reveal three distinct structural states shown by CD (Fig. 1A). The structural starting point is a mixture of random coil and PII-helix with the random coil as the major constituent at 28 °C (20). With increasing surfactant concentration, a conformational change to β-structure was observed. An isodichroic point at 210.5 nm between 0 and ∼2.5 mm SDS indicated a two-state process in this concentration range. One indication of peptide β-content was a high value of the 215:208 nm ratio. There was a steep increase in this ratio between 1 and 2.75 mm SDS, followed by a short plateau region (2.75–3.25 mm) and a subsequent decline to a final plateau around 7–10 mm SDS (Fig. 1B). At higher SDS concentrations (≥10 mm), Aβ adopts an α-helical structure as shown previously (18, 21).
FIGURE 1.
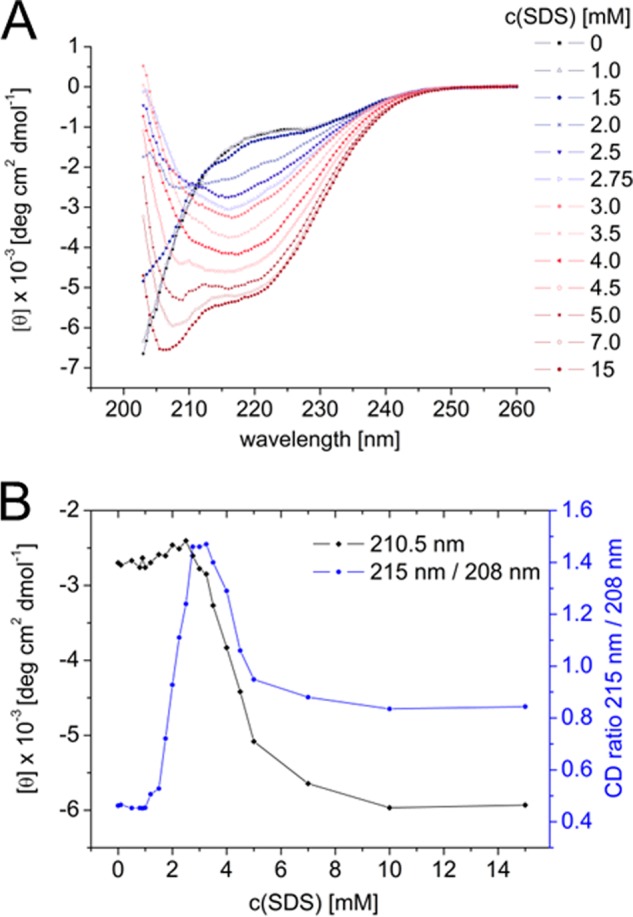
A, far-UV CD spectrum of 150 μm Aβ in 10 mm sodium-phosphate buffer, pH 7.4, in 0–15 mm SDS at 28 °C. B, molar ellipticity at the isodichroic point, 210.5 nm, and the 215:208 nm ratio (β-sheet and α-helix minimum, respectively) plotted versus SDS concentration.
Fluorophore Pyrene Monitors Hydrophobic Clusters That Correlate with Induction of β-Structure
We used the fluorophore pyrene to probe the formation of hydrophobic clusters formed by SDS and Aβ. Because the fluorescence of pyrene is sensitive to the hydrophobicity of the surrounding environment, pyrene is often used to detect formation of micelle-like structures (26, 39). The emission spectrum of pyrene features four peaks, two of which are poorly resolved (Fig. 2A). The ratio of the pyrene emission intensity peaks I3/I1 generally increases with the SDS concentration but shows emission plateaus that are reached at different SDS concentrations dependent on Aβ concentration (Fig. 2A). Fig. 2B shows the pyrene fluorescence intensity ratio and the ratio between the CD signal at 215 and 207 nm for 75 μm Aβ at increasing SDS concentrations. The increase of the fluorescence ratio I3/I1 between the first and second plateaus occurs at approximately the same SDS concentrations where β-rich structure is detected by CD. Thus, the appearance of hydrophobic clusters (detected by pyrene fluorescence) correlates well with the induction of β-structure in the peptide. Our observations also show that these spectral changes induced by the surfactant additions occur immediately upon mixing and then remain almost constant throughout the recording of the spectra.
FIGURE 2.
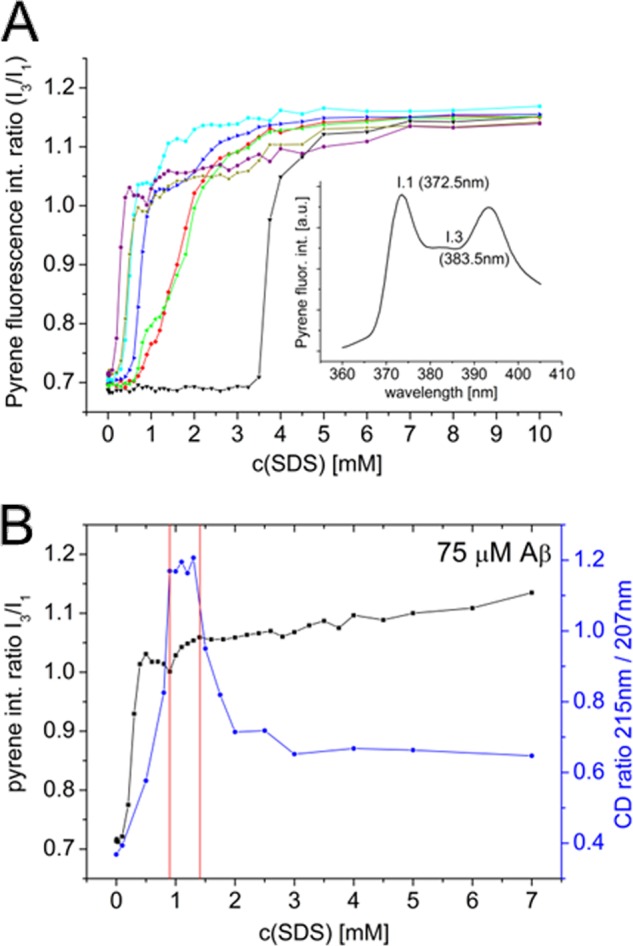
A, pyrene fluorescence intensity ratio of two emission maxima I3/I1 (I1 at 372.5 nm and I3 at 383.5 nm) in 0 (black), 5 (red), 10 (green), 20 (blue), 30 (cyan), 50 (ochre), and 75 (violet) μm Aβ. Inset graph, fluorescence emission spectrum of pyrene. B, pyrene intensity ratio I3/I1 (black) and CD ratio of molar ellipticitiy (blue) at 215 nm (β-sheet minimum) and 207 nm (α-helix minimum) displayed for 75 μm Aβ. The red lines indicate the SDS concentration range, where a small increase of the pyrene intensity ratio coincides with the region of maximal β-structure content (monitored by CD).
β-Structure Is the Most Aggregation-prone State as Monitored by Thioflavin T Fluorescence
To link these structural changes to amyloid aggregation propensities, we monitored the fluorescence of the amyloid-binding dye ThT over time with 150 μm Aβ at 0–12.5 mm SDS at 28 °C without agitation. There is an immediate increase in fluorescence intensity for 150 μm Aβ with 2.75 mm SDS, and at 0.9 mm SDS concentration, a short lag time of around 15 min is observed (Fig. 3A). CD measurements on the sample with 0.9 mm SDS reveal a structural conversion from a random coil-like spectrum at the onset of the incubation to a β-rich structure (minimum around 215 nm) at the end point state (Fig. 3B). The sample with 2.75 mm SDS exhibited a CD spectrum typical for a β-structure already at the onset of the reaction. However, the CD signal intensity is strongly increased after prolonged aggregation (Fig. 3B). Notably, the final states of both samples feature very similar CD spectra.
FIGURE 3.
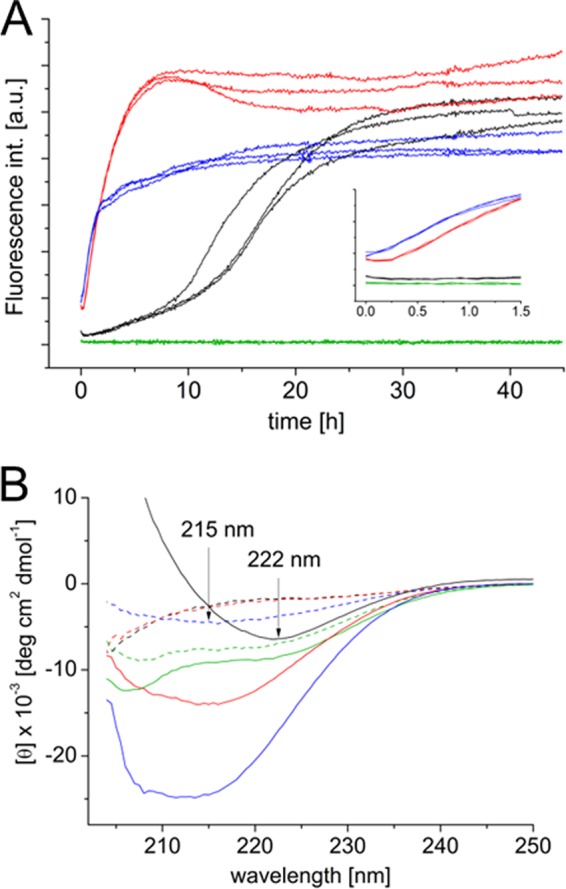
A, kinetic traces of 150 μm Aβ aggregation without (black) and in the presence of 0.9 (red), 2.75 (blue), and 12.5 mm (green) SDS monitored by ThT fluorescence at 28 °C without agitation. The inset graph shows a zoom of the first 1.5 h of aggregation. a.u., arbitrary unit. B, far-UV CD measurements on fresh (dashed line) and ThT end point samples (straight line).
The aggregation of Aβ in the absence of SDS shows sigmoidal ThT fluorescence traces with an average t½ value (time of half-completion of aggregation) of 15.5 ± 2.2 h and an average lag time of 7.5 ± 2.0 h. Thus, Aβ alone shows a significantly slower aggregation than in the presence of SDS, where the t½ values are 1.9 ± 0.2 and 1.2 ± 0.2 h at 0.9 and 2.75 mm SDS, respectively. The CD spectrum of the ThT end point state of Aβ alone displays a β-rich structure but with a minimum at 222 nm, indicating that the fibril structure of Aβ alone is not identical to surfactant-Aβ co-aggregates (Fig. 3B).
At high SDS concentrations (12.5 mm), the Aβ aggregation was completely inhibited. The ThT fluorescence intensity remains at base-line levels during the entire measurement time, and Aβ forms an α-helical state (minima around 208 and 222 nm) that remains essentially unchanged during the experiment (Fig. 3B). The SDS-induced structure and the formation of Aβ-SDS micelles prevent a structural conversion to a β-structure that is the aggregation-prone state (40).
Notably, the structural states of Aβ upon addition of SDS in one step to the final concentration (Fig. 3B) agree well with the structural states obtained by gradual titration of SDS (Fig. 1A). This suggests that, even though a slow time-dependent structural change may occur during the CD surfactant titration experiments, the final surfactant concentration is the decisive factor for the structural state of Aβ.
Structure of Surfactant-Aβ Co-aggregates Revealed by SAXS Experiments
To obtain structural information on the surfactant-Aβ complexes, SAXS experiments were conducted at three conditions selected from the SDS titration experiments as follows: a pre-β-structure state at 0.9 mm SDS, a β-structure state (2.75 mm SDS), and the final α-helical state at 10 mm SDS (above the critical micelle concentration of SDS (41)). The samples containing 0.9 and 2.75 mm SDS show a growth in aggregate size as a function of time (Fig. 4, A and D). The distance distribution function p(r) was derived from the SAXS data (42, 43). It represents a histogram of intra-particle distances, weighted by the excess electron density at their end points. At the end of the experiments (after 10–16 h), p(r) values of both SDS samples display a shape that is characteristic for cylindrical structures (44) and, hence, indicate fibril formation (Fig. 4, B and E).
FIGURE 4.

SAXS data of 150 μm Aβ in the presence of 2.75 mm (A–C), 0.9 mm (D–F) and 10 mm (G and H) SDS. Data from the 2.75 mm sample were fitted to a model with a mixture of cylinders and spheres (A), although data from the 0.9 mm (D) sample were fitted to two cylinders side-by-side (cross-section in I). Curves are shifted for clarity. The pair distance distribution function, p(r) at selected time points is shown in B and E. The fitting parameters as a function of time are depicted in C and F. Data from 20 mm SDS alone and Aβ in the presence of 10 mm SDS were fitted to a core-shell ellipsoid function (G). Their p(r) functions (H) show similar core radii and aspect ratios, although the shell thickness is larger in the presence of Aβ.
Data from the 2.75 mm SDS sample can be fitted to a structural model composed by a mixture of cylinders and objects simplified as spheres with a fixed radius (37 Å). The sphere radius was determined from the data of the first frame. The cylinder length exceeded the resolution of the SAXS setup and thus was set to 350 Å, which is the maximal measurable length by the SAXS setup. Out of the total particle volume, the fraction of spheres was determined to ∼80% at the start of the experiment, and it declined to 0% during the measurement time, suggesting that aggregation promoted formation of elongated cylindrical fibrils during the measurement. The cylindrically shaped structures show a time-dependent increase in radius to a final value of about 32 Å (Fig. 4C).
Data from the 0.9 mm SDS sample could not be fitted adequately with a single cylinder. However, a model with two identical cylinders of 350 Å in length arranged side-by-side (45) could be applied. A dimensionless scaling factor d is introduced (Fig. 4I) to characterize the distance between the cylinder centers so that the distance is given as 2Rd, where R is the radius of the cylinder. During the first 2 h, d decreases from about 1.2 to 0.9, which indicates that the two cylinders are tightly connected in the final state (Fig. 4F). The cylinder radii show about the same growth behavior and a final value of 30 Å as obtained for the data from the 2.75 mm SDS sample (Fig. 4F). The broader peak in the p(r) function of the 0.9 mm SDS sample compared with the 2.75 mm SDS sample indicated a larger cross-section area and therefore agreed with the two cylinder model.
For both 0.9 and 2.75 mm SDS samples, we considered the possibility of a core-shell structure in the Aβ-SDS co-aggregate, as has been suggested for αSN-SDS co-aggregates under similar conditions (19). The core-shell structure may consist of an inner micelle core formed by SDS hydrocarbon tails that are surrounded by a shell of SDS headgroups and peptides. In this case, oscillations in the p(r) function were expected. However, we found no such modulations of the p(r) functions, indicating a fairly homogeneous distribution of both molecules in the co-aggregate.
In contrast, SAXS data for the sample of Aβ in the presence of 10 mm SDS reveal a core-shell structure similar to that of 20 mm SDS alone (Fig. 4, G and H). Prolate or oblate ellipsoidal core-shell models fit the data equally well. Fitting parameters for an oblate ellipsoid (Table 1) are in good agreement with previous studies (46, 47). Both samples featured similar core radii and aspect ratios, whereas the shell thickness in the presence of the peptide was about twice as large as for SDS alone. This suggests that Aβ is attached to the SDS micelle headgroup shell in agreement with previous NMR studies (21) and SAXS studies for surfactant-protein systems (19, 22, 47). The upturn in intensity at low scattering vector values q for the SDS-Aβ sample (Fig. 4G) shows that also a few larger aggregates are present in the sample.
TABLE 1.
SAXS fitting parameters are listed for 20 mm SDS and 150 μm Aβ with 10 mm SDS samples using an oblate core-shell ellipsoid for the shape model
| Core radius | Shell thickness | Aspect ratio | |
|---|---|---|---|
| Å | Å | ||
| 20 mm SDS | 18.8 | 7.4 | 0.60 |
| 150 μm Aβ + 10 mm SDS | 16.3 | 13.0 | 0.63 |
Aβ alone shows only very low scattering intensity despite the long acquisition time. This shows that larger aggregates have not formed during the acquisition time.
Transmission Electron Microscope Images Reveal Time-dependent Formation of Fibrillar Structures
To visualize the structures of Aβ-surfactant complexes, TEM images were recorded of 150 μm Aβ after incubation with different SDS concentrations for 0 to >45 h at 28 °C (Fig. 5). TEM images of Aβ without and with 0.9 and 2.75 mm SDS directly after sample preparation reveal short fibrils and dot-like structures (Fig. 5, A–C). The tiny dot-like structures within the darkly stained material might originate from small globular oligomeric Aβ-surfactant structures. They are of the same size dimension as the globular co-aggregate fraction detected by SAXS. However, the resolution of these TEM images was limited, and the origin of these structures was therefore uncertain. The samples displayed a growth in fibril length and amount of fibrils during incubation time, and all samples showed similar fibril diameters. The estimated diameter of 50–70 Å is in good agreement with the SAXS results. In addition, the TEM images of these samples show that several of the fibrils associate side-by-side in pairs. This was observed only for the 0.9 mm SDS sample in the SAXS experiment. The twist length of the fibrils exceeded the detection limit of the SAXS measurements.
FIGURE 5.

TEM images of 150 μm Aβ incubated without (A) and with 0.9 (B), 2.75 (C), and 10 mm (D) SDS. Images were recorded before and after incubation at 28 °C for 30 min and 2, 4, and >45 h with arbitrary magnifications of 25,000 (for samples after >45 h) and 40,000 (all other samples), where the black bar corresponds to 100 nm.
The EM data also showed that micellar concentrations of SDS, which induce α-helical structure in Aβ, strongly inhibited aggregation. When Aβ is incubated with 10 mm SDS, there is no aggregate visible by TEM at the start and only very little after 2 h (Fig. 5D). This is in agreement with the findings from ThT fluorescence measurements that showed that at high SDS concentrations the Aβ fibril formation was in practice inhibited.
Surfactant-induced Co-aggregates Show Rapid Dynamic Exchange with Free Peptide
Solution NMR can provide information about the kinetic regime for exchange between different conformational states. Here, the exchange kinetics between monomeric and co-aggregated states of Aβ were measured by 15N NMR Carr-Purcell-Meiboom-Gill (CPMG) relaxation dispersion experiments. Because of favorable exchange kinetics and better NMR signal-to-noise ratio at low temperatures, the experiments were conducted at 10 °C. However, the low solubility of SDS at these temperatures made us replace SDS with LiDS. Besides its higher solubility, LiDS gives rise to the same three-state conformational changes as in the case of SDS at higher temperatures (data not shown) but at slightly lower surfactant concentrations. Both surfactants exhibit approximately the same critical micelle concentration values (41). As shown previously, addition of LiDS causes NMR signal attenuation along the whole peptide sequence (18), and the remaining NMR signal arises from Aβ monomers. Experiments were carried out on a sample with 150 μm Aβ in the presence of 1.15 mm LiDS corresponding to a molar ratio of 1:7.7 Aβ/LiDS. This state exhibits a mixture of β-structure and random coil signals in the CD spectrum. Under these conditions about 30–50% of the initial monomeric peptide NMR signal remains in a 1H-15N HSQC spectrum. During the relaxation dispersion measurement, peptide aggregation was evident from the severe signal loss of the HSQC cross-peak intensities at about 60–80% of the initial signal (data not shown). At 10 °C, aggregation was much slower than the ThT fluorescence and SAXS aggregation kinetics recorded at 28 °C, and the NMR signal from monomeric peptide was still detectable. To reduce the effect of aggregation on the relaxation measurement, all data sampling was performed using an inter-leaved mode, i.e. aggregation affects all measurements in the same way and is averaged over the acquisition time. Nonetheless, beside this slow aggregation process, faster exchange kinetics could be detected by relaxation dispersion measurements.
15N CPMG relaxation profiles fit well to a two-state model where state A describes free peptide and state B peptide bound to the surfactant (Fig. 6). The fitting reveals the intrinsic relaxation rates R2calc, populations of the free (A) and bound (B) states pA (= 1 − pB) and pB, respectively, magnitude of the chemical shift differences, |Δω|, between states A and B, and the chemical exchange rate kex. A globular fit was applied, where pB and kex were constrained to the same value for all residues, whereas |Δω| and R2calc are residue-specific values, yielding an exchange rate of 1100 ± 150 s−1, where only 1.0 ± 0.1% of the peptide was bound. Residues that exhibit chemical exchange are primarily located in the hydrophobic parts of the peptide sequence involving the central hydrophobic cluster (residues 15–22) and the hydrophobic C terminus (residues 34–40 excluding glycine residues) (Fig. 6 and supplemental Table S1). However, the residues Arg-5 and Asp-7 also positioned in the hydrophilic N terminus showed significant chemical exchange. This suggested that, in particular, the hydrophobic parts of the peptide bind to the hydrophobic regions of the co-aggregate. The residues Val-18 and Val-36 showed much larger exchange rates determined from individual residue-specific parameter fitting and thus were excluded from the global fit analysis. Because of the hydrophobic character of these residues, one possible explanation may be a strong interaction with the hydrophobic part of the co-aggregate.
FIGURE 6.
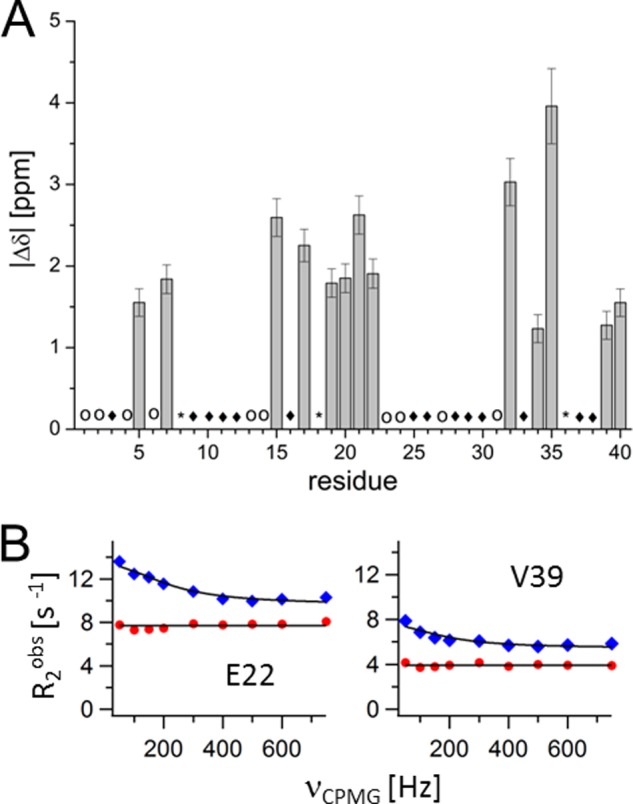
A, chemical shift changes |Δδ| for 15N (corresponds to |Δω| in ppm units) from relaxation dispersion fitting for 150 μm Aβ with 1.15 mm LiDS at 10 °C. Only data with significant F test values (p < 0.02) are shown. Residues that do not show significant relaxation dispersion profiles are denoted with filled diamonds. Outliers from individual residue-specific parameter fitting are marked with a star (Ser-8, Val-18 and Val-36). Cross-peaks that are not analyzed due to overlap or low intensity are denoted with open circles. B, 15N CPMG relaxation dispersion profiles for selected residues Glu-22 and Val-39 at 10 °C. Data were fitted to a constant value and a two-state exchange model for 150 μm Aβ alone (red circles) and in the presence of 1.15 mm LiDS (blue diamonds), respectively.
Aβ alone at 150 μm peptide concentration and at 10 °C shows low amplitude dispersion profiles that indicate no or much slower exchange kinetics (Fig. 6B). This suggests that the exchange rate in the presence of LiDS is mainly determined by the exchange of Aβ with a LiDS-Aβ co-aggregate.
For a quantitative comparison with the NMR results, SAXS experiments were performed under similar conditions on a sample of Aβ in the presence of β-structure inducing concentrations of LiDS (2.5 mm) at low temperature (3 °C). The data are similar to the first frame of the 2.75 mm SDS sample and the same model fits the data reasonably, yielding a volume fraction of spheres of 68% with a sphere radius of 39 Å (data not shown). A cylinder radius of 27 Å was obtained, and the cylinder length was fixed to 350 Å as in the 2.75 mm SDS sample.
The calculated relaxation rates together with the population of the bound state may be used to determine the averaged transverse relaxation rate of the bound state (R̄2B0 = 447 s−1) and thus provide an estimate of the complex size (10). By applying the general relation of the overall correlation time and the transverse relaxation rate and neglecting contribution from internal motion, the hydrodynamic radius of the co-aggregate can be determined (48–50). Thus, assuming a spherical complex, the hydrodynamic radius of a 1:7.7 Aβ/LiDS co-aggregate at 10 °C may be estimated to 60 Å. Because of a dynamic hydration layer, the measured hydrodynamic radius is typically 30% larger than the hydration-free dimensions (51).
The hydrodynamic radius (60 Å) agrees reasonably well with the size of the globular co-aggregate fraction (radius 39 Å) of a 2.5 mm LiDS sample determined by SAXS at 3 °C. This suggests that the dynamic exchange measured here occurs mainly between monomeric Aβ and the globular fraction of the co-aggregates. Hence, the results suggest that NMR and SAXS give information on the same species, also considering that the analyses are performed under slightly different conditions.
DISCUSSION AND CONCLUSIONS
In this study, we have investigated the surfactant-induced aggregation of Aβ by using a broad range of biophysical techniques. Aβ in surfactant co-aggregates show a surfactant concentration-dependent secondary structure and therefore may be used as model systems for studying β-rich pre-fibrillar oligomeric species that appear during the aggregation process (1).
The kinetics of the aggregation process was monitored by ThT fluorescence experiments as well as by the time dependence of 1H-15N HSQC cross-peak intensities, SAXS patterns, and TEM images. The aggregation process occurs on a time scale of minutes to hours under the conditions used here; however, the surfactant-Aβ co-aggregates show rapid dynamic chemical exchange between free and surfactant-bound peptide on a micro- to millisecond time scale. In particular, the hydrophobic parts of the Aβ peptide show a structural change when binding to the surfactant. This suggests that hydrophobic parts of Aβ bind to the hydrophobic regions of surfactant-Aβ co-aggregates. Previous kinetic studies on small, hydrophobic molecular interactions with Aβ reveal that dynamic exchange on a similar time scale involves structural alterations in the two hydrophobic segments in the peptide as well as part of the hydrophilic N terminus (10). Hence, transient interactions of these peptide segments with hydrophobic compound may be an intrinsic property of Aβ and important for the aggregation process and co-aggregated oligomer formation. As reported in two recent studies (52, 53), Aβ alone shows dynamic exchange between monomers and oligomers, however, on a significantly slower time scale (kon = 3 s−1 and koff = 51 s−1 at 270 μm Aβ) than in the presence of small hydrophobic compounds (10) and surfactants. This suggests that the faster kinetics of Aβ interactions with small hydrophobic molecules and surfactants kinetically modulate the Aβ self-assembly. The nature of these transient interactions then determines whether the peptide is kinetically driven to or from self-association and aggregation.
Our SAXS analysis reveals a fraction of small globular co-aggregates at the beginning of the experiment. This fraction decreases and finally vanishes during the course of the experiment. Instead, a growing fraction of long (>350 Å) cylindrical structures is observed. At the same time, the cylindrically shaped fraction that is already present at the start of the measurement shows a growth in radius to a final value of 30–32 Å. This suggests that Aβ and surfactant molecules initially co-aggregate to small globular β-rich clusters that eventually give rise to cylindrically shaped fibrils. The globular species may act as a fibrillation nucleus and gradually convert to elongated fibrils; however, fibril formation might also be mediated by alternative processes, e.g. direct association of monomeric peptides. The co-aggregated fibrils may slowly grow in length, as this structure allows free Aβ molecules to integrate into the growing fibrils. The slope of the reaction time for formation of large aggregates is typically proportional to the number of monomers in solution (54, 55). The fibril growth may be assisted by fragmentation or surface-catalyzed nucleation mechanisms (55, 56).
The mature fibrils may interact with each other and be localized side-by-side as found by TEM images and SAXS analysis in the case of 0.9 mm SDS. Diverse arrangement patterns with several fibrils, including a side-by-side pattern, have been reported for SDS-free Aβ (5, 57) and other amyloid fibrils (58).
In general, formation of amyloid-like structures requires a conformational change of the peptide into the β-structure present in final fibrils (59–61). Whether this structural transition occurs prior to fibril association, upon binding to the fibril, or at later stage maturation is not known in detail. Nonetheless, NMR relaxation measurements provide some information about this question. Chemical exchange is mainly evident in the hydrophobic parts of the Aβ peptide that are also involved in β-sheet formation (59, 61, 62). A transition to a β-structure occurs in the peptide directly upon binding to the surfactant-Aβ co-aggregates. The binding is a dynamic rapid exchange process between free and bound peptide molecules, and at any given time point only a small fraction (∼1%) is bound to the co-aggregates.
Taken together, structural and kinetic characterization of surfactant-Aβ co-aggregates provides a basis for understanding the mechanistic details of surfactant-induced aggregation (Fig. 7). In this model, monomeric peptide and surfactant co-aggregate to dynamic globular oligomers, where free peptide transiently binds to the hydrophobic regions of the co-aggregate and eventually forms elongated co-aggregated fibrils. Surfactant at intermediate concentration (around 1–3 mm) facilitates a β-structure conformation in the peptide by strengthening inter- or intramolecular hydrogen bonds (17). A high β-structure propensity favors formation of amyloid-like material (63) and eventually leads to fibril growth. Therefore, the structural state with the highest β-structure content is the most aggregation-prone state as demonstrated by ThT fluorescence experiments. SDS generally induces amyloid formation within a relatively narrow submicellar concentration range (17, 19, 64). Transient interactions between free peptide and surfactant-Aβ co-aggregates may mediate the conformational transition, although, at any given time point, only a small population that undergoes dynamic exchange is bound to the co-aggregates. Hence, when interacting with substances that promote β-rich conformations, such as surfactants, Aβ is kinetically driven toward an aggregation-prone species. In contrast, transient interactions that promote other structural states of Aβ kinetically drive the peptide to a nonaggregated monomeric state.
FIGURE 7.

Formation and dynamic exchange of surfactant-induced Aβ co-aggregates. In this model, free monomeric peptide and surfactant initially assemble to dynamic small globular co-aggregates (oligomers) where free peptide transiently binds to the hydrophobic regions of the co-aggregate with an exchange rate of 1100 s−1. Elongated co-aggregated fibrils are eventually formed on a time scale of minutes to hours. Aβ is kinetically driven to an aggregation-prone state when interacting with β-structure promoters, such as surfactants. The structural model represents the constraints determined by SAXS in the presence of 2.75 mm SDS.
Surfactants may also be considered as a model system for natural lipids that were found to be located around and within in vivo amyloid plaques (13, 14) and revert Aβ(1–42) aggregates to neurotoxic protofibrils (15). This underlines the significant role of lipids in the aggregation process.
In conclusion, we present a detailed description of the early aggregation process of Aβ(1–40) in the presence of surfactant as follows: A cylindrical co-aggregate forms slowly (minutes to hours), and the bound peptides undergo rapid dynamic exchange (on a micro- to millisecond time scale) with monomeric peptide in solution.
This study highlights that several different kinetic processes are involved in the peptide aggregation. Although Aβ self-assembly is induced and driven by surfactants, similar intermediate oligomeric states might occur without the presence of surfactants that act here as an aggregation mediator or in the presence of lipids. The general aggregation-inducing character of anionic surfactants at submicellar concentrations (around 1–3 mm) (17, 65, 66) suggests that the proposed aggregation mechanism and fibrillation intermediates may be general for a large number of amyloidogenic proteins. The improved molecular understanding of the mechanisms underlying amyloid formation is potentially important for future attempts to interfere with these processes for therapeutic purposes.
Supplementary Material
This work was supported by the Swedish Research Council (to A. G.), the Swedish Brain Foundation (to A. G.), EMBO (to A. A.), the Danish Research Foundation (inSPIN) (to D. E. O.), the Lundbeck Foundation (BioNet 2) (to J. D. K., S. B. N., J. S. P., and D. E. O.), and the Danish Research Council, Natural Sciences (to J. S. P., S. B. N., and D. E. O.).

This article contains supplemental Table S1.
- Aβ
- amyloid β
- αSN
- α-synuclein
- LiDS
- lithium dodecyl sulfate
- SAXS
- small angle x-ray scattering
- ThT
- thioflavin T
- TEM
- transmission electron microscope
- CPMG
- Carr-Purcell-Meiboom-Gill
- HSQC
- heteronuclear single quantum coherence.
REFERENCES
- 1. Chiti F., Dobson C. M. (2006) Protein misfolding, functional amyloid, and human disease. Annu. Rev. Biochem. 75, 333–366 [DOI] [PubMed] [Google Scholar]
- 2. Haass C., Selkoe D. J. (2007) Soluble protein oligomers in neurodegeneration: lessons from the Alzheimer's amyloid β-peptide. Nat. Rev. Mol. Cell Biol. 8, 101–112 [DOI] [PubMed] [Google Scholar]
- 3. Benilova I., Karran E., De Strooper B. (2012) The toxic Aβ oligomer and Alzheimer's disease: an emperor in need of clothes. Nat. Neurosci. 15, 349–357 [DOI] [PubMed] [Google Scholar]
- 4. Fändrich M. (2012) Oligomeric intermediates in amyloid formation: structure determination and mechanisms of toxicity. J. Mol. Biol. 421, 427–440 [DOI] [PubMed] [Google Scholar]
- 5. Fändrich M. (2007) On the structural definition of amyloid fibrils and other polypeptide aggregates. Cell. Mol. Life Sci. 64, 2066–2078 [DOI] [PMC free article] [PubMed] [Google Scholar]
- 6. Greenwald J., Riek R. (2010) Biology of amyloid: structure, function, and regulation. Structure 18, 1244–1260 [DOI] [PubMed] [Google Scholar]
- 7. Tycko R. (2011) Solid-state NMR studies of amyloid fibril structure. Annu. Rev. Phys. Chem. 62, 279–299 [DOI] [PMC free article] [PubMed] [Google Scholar]
- 8. Härd T., Lendel C. (2012) Inhibition of amyloid formation. J. Mol. Biol. 421, 441–465 [DOI] [PubMed] [Google Scholar]
- 9. Abelein A., Bolognesi B., Dobson C. M., Gräslund A., Lendel C. (2012) Hydrophobicity and conformational change as mechanistic determinants for nonspecific modulators of amyloid β self-assembly. Biochemistry 51, 126–137 [DOI] [PubMed] [Google Scholar]
- 10. Abelein A., Lang L., Lendel C., Gräslund A., Danielsson J. (2012) Transient small molecule interactions kinetically modulate amyloid β peptide self-assembly. FEBS Lett. 586, 3991–3995 [DOI] [PubMed] [Google Scholar]
- 11. Lendel C., Bolognesi B., Wahlström A., Dobson C. M., Gräslund A. (2010) Detergent-like interaction of Congo red with the amyloid β peptide. Biochemistry 49, 1358–1360 [DOI] [PubMed] [Google Scholar]
- 12. Feng B. Y., Toyama B. H., Wille H., Colby D. W., Collins S. R., May B. C., Prusiner S. B., Weissman J., Shoichet B. K. (2008) Small-molecule aggregates inhibit amyloid polymerization. Nat. Chem. Biol. 4, 197–199 [DOI] [PMC free article] [PubMed] [Google Scholar]
- 13. Kuzyk A., Kastyak M., Agrawal V., Gallant M., Sivakumar G., Rak M., Del Bigio M. R., Westaway D., Julian R., Gough K. M. (2010) Association among amyloid plaque, lipid, and creatine in hippocampus of TgCRND8 mouse model for Alzheimer disease. J. Biol. Chem. 285, 31202–31207 [DOI] [PMC free article] [PubMed] [Google Scholar]
- 14. Liao C. R., Rak M., Lund J., Unger M., Platt E., Albensi B. C., Hirschmugl C. J., Gough K. M. (2013) Synchrotron FTIR reveals lipid around and within amyloid plaques in transgenic mice and Alzheimer's disease brain. Analyst 138, 3991–3997 [DOI] [PubMed] [Google Scholar]
- 15. Martins I. C., Kuperstein I., Wilkinson H., Maes E., Vanbrabant M., Jonckheere W., Van Gelder P., Hartmann D., D'Hooge R., De Strooper B., Schymkowitz J., Rousseau F. (2008) Lipids revert inert Aβ amyloid fibrils to neurotoxic protofibrils that affect learning in mice. EMBO J. 27, 224–233 [DOI] [PMC free article] [PubMed] [Google Scholar]
- 16. LaFerla F. M., Green K. N., Oddo S. (2007) Intracellular amyloid-β in Alzheimer's disease. Nat. Rev. Neurosci. 8, 499–509 [DOI] [PubMed] [Google Scholar]
- 17. Otzen D. E. (2010) Amyloid formation in surfactants and alcohols: membrane mimetics or structural switchers? Curr. Protein Pept. Sci. 11, 355–371 [DOI] [PubMed] [Google Scholar]
- 18. Wahlström A., Hugonin L., Perálvarez-Marín A., Jarvet J., Gräslund A. (2008) Secondary structure conversions of Alzheimer's Aβ(1–40) peptide induced by membrane-mimicking detergents. FEBS J. 275, 5117–5128 [DOI] [PubMed] [Google Scholar]
- 19. Giehm L., Oliveira C. L., Christiansen G., Pedersen J. S., Otzen D. E. (2010) SDS-induced fibrillation of α-synuclein: an alternative fibrillation pathway. J. Mol. Biol. 401, 115–133 [DOI] [PubMed] [Google Scholar]
- 20. Danielsson J., Jarvet J., Damberg P., Gräslund A. (2005) The Alzheimer β-peptide shows temperature-dependent transitions between left-handed 31-helix, β-strand and random coil secondary structures. FEBS J. 272, 3938–3949 [DOI] [PubMed] [Google Scholar]
- 21. Jarvet J., Danielsson J., Damberg P., Oleszczuk M., Gräslund A. (2007) Positioning of the Alzheimer Aβ(1–40) peptide in SDS micelles using NMR and paramagnetic probes. J. Biomol. NMR 39, 63–72 [DOI] [PubMed] [Google Scholar]
- 22. Lin J. M., Lin T. L., Jeng U. S., Huang Z. H., Huang Y. S. (2009) Aggregation structure of Alzheimer amyloid-β(1–40) peptide with sodium dodecyl sulfate as revealed by small-angle x-ray and neutron scattering. Soft Matter 5, 3913–3919 [Google Scholar]
- 23. Maltsev A. S., Grishaev A., Bax A. (2012) Monomeric α-synuclein binds Congo Red micelles in a disordered manner. Biochemistry 51, 631–642 [DOI] [PMC free article] [PubMed] [Google Scholar]
- 24. Bodner C. R., Dobson C. M., Bax A. (2009) Multiple tight phospholipid-binding modes of α-synuclein revealed by solution NMR spectroscopy. J. Mol. Biol. 390, 775–790 [DOI] [PMC free article] [PubMed] [Google Scholar]
- 25. Chimon S., Shaibat M. A., Jones C. R., Calero D. C., Aizezi B., Ishii Y. (2007) Evidence of fibril-like β-sheet structures in a neurotoxic amyloid intermediate of Alzheimer's β-amyloid. Nat. Struct. Mol. Biol. 14, 1157–1164 [DOI] [PubMed] [Google Scholar]
- 26. Goddard E. D., Turro N. J., Kuo P. L., Ananthapadmanabhan K. P. (1985) Fluorescence probes for critical micelle concentration determination. Langmuir 1, 352–355 [DOI] [PubMed] [Google Scholar]
- 27. Hellstrand E., Boland B., Walsh D. M., Linse S. (2010) Amyloid β-protein aggregation produces highly reproducible kinetic data and occurs by a two-phase process. ACS Chem. Neurosci. 1, 13–18 [DOI] [PMC free article] [PubMed] [Google Scholar]
- 28. Pedersen J. S. (2004) A flux- and background-optimized version of the NanoSTAR small-angle x-ray scattering camera for solution scattering. J. Appl. Crystallogr. 37, 369–380 [Google Scholar]
- 29. Pedersen J. S., Schurtenberger P. (1996) Cross-section structure of cylindrical and polymer-like micelles from small-angle scattering data. I. Test of analysis methods. J. Appl. Crystallogr. 29, 646–661 [Google Scholar]
- 30. Neugebauer T. (1943) Calculation of the light diffusion of filament chain solutions. Annalen Der Physik. 42, 509–533 [Google Scholar]
- 31. Oster G., Riley D. (1952) Scattering from cylindrically symmetric systems. Acta Crystallogr. 5, 272–276 [Google Scholar]
- 32. Kinning D. J., Thomas E. L. (1984) Hard-sphere interactions between spherical domains in diblock copolymers. Macromolecules 17, 1712–1718 [Google Scholar]
- 33. Andreasen M., Nielsen S. B., Runager K., Christiansen G., Nielsen N. C., Enghild J. J., Otzen D. E. (2012) Polymorphic fibrillation of the destabilized fourth fasciclin-1 domain mutant A546T of the transforming growth factor-β-induced protein (TGFBIp) occurs through multiple pathways with different oligomeric intermediates. J. Biol. Chem. 287, 34730–34742 [DOI] [PMC free article] [PubMed] [Google Scholar]
- 34. Tollinger M., Skrynnikov N. R., Mulder F. A., Forman-Kay J. D., Kay L. E. (2001) Slow dynamics in folded and unfolded states of an SH3 domain. J. Am. Chem. Soc. 123, 11341–11352 [DOI] [PubMed] [Google Scholar]
- 35. Palmer A. G., 3rd, Kroenke C. D., Loria J. P. (2001) Nuclear magnetic resonance methods for quantifying microsecond-to-millisecond motions in biological macromolecules. Methods Enzymol. 339, 204–238 [DOI] [PubMed] [Google Scholar]
- 36. Carver J., Richards R. (1972) A general two-site solution for the chemical exchange produced dependence of T2 upon the Carr-Purcell pulse separation. J. Magn. Reson. 6, 89–105 [Google Scholar]
- 37. Davis D. G., Perlman M. E., London R. E. (1994) Direct measurements of the dissociation-rate constant for inhibitor-enzyme complexes via the T1ρ and T2 (CPMG) methods. J. Magn. Reson. 104, 266–275 [DOI] [PubMed] [Google Scholar]
- 38. Danielsson J., Andersson A., Jarvet J., Gräslund A. (2006) 15N relaxation study of the amyloid β-peptide: structural propensities and persistence length. Magn. Reson. Chem. 44, S114–S121 [DOI] [PubMed] [Google Scholar]
- 39. Kalyanasundaram K., Thomas J. K. (1977) Environmental effects on vibronic band intensities in pyrene monomer fluorescence and their application in studies of micellar systems. J. Am. Chem. Soc. 99, 2039–2044 [Google Scholar]
- 40. Biancalana M., Koide S. (2010) Molecular mechanism of thioflavin-T binding to amyloid fibrils. Biochim. Biophys. Acta 1804, 1405–1412 [DOI] [PMC free article] [PubMed] [Google Scholar]
- 41. Mukerjee P., Mysels K., Kapauan P. (1967) Counterion specificity in the formation of ionic micelles–Size, hydration, and hydrophobic bonding effects. J. Phys. Chem. 71, 4166–4175 [Google Scholar]
- 42. Glatter O. (1977) A new method for the evaluation of small-angle scattering data. J. Appl. Crystallogr. 10, 415–421 [Google Scholar]
- 43. Pedersen J. S., Hansen S., Bauer R. (1994) The aggregation behavior of zinc-free insulin studied by small-angle neutron scattering. Eur. Biophys. J. 22, 379–389 [DOI] [PubMed] [Google Scholar]
- 44. Glatter O. (1979) The interpretation of real-space information from small-angle scattering experiments. J. Appl. Crystallogr. 12, 166–175 [Google Scholar]
- 45. Oliveira C. L., Behrens M. A., Pedersen J. S., Erlacher K., Otzen D., Pedersen J. S. (2009) A SAXS study of glucagon fibrillation. J. Mol. Biol. 387, 147–161 [DOI] [PubMed] [Google Scholar]
- 46. Bergström M., Pedersen J. S. (1999) A small-angle neutron scattering (SANS) study of tablet-shaped and ribbonlike micelles formed from mixtures of an anionic and a cationic surfactant. J. Phys. Chem. B 103, 8502–8513 [Google Scholar]
- 47. Andersen K. K., Oliveira C. L., Larsen K. L., Poulsen F. M., Callisen T. H., Westh P., Pedersen J. S., Otzen D. (2009) The role of decorated SDS micelles in sub-CMC protein denaturation and association. J. Mol. Biol. 391, 207–226 [DOI] [PubMed] [Google Scholar]
- 48. Cavanagh J., Fairbrother W. J., Palmer A. G., Rance M., Skelton N. J. (2007) Protein NMR Spectroscopy: Principles and Practice, 2nd Ed., pp. 333–404, Academic Press, San Diego [Google Scholar]
- 49. Kowalewski J., Mäler L. (2006) Nuclear Spin Relaxation in Liquids: Theory, Experiments, and Applications, pp. 243–287, Taylor & Francis Ltd., London [Google Scholar]
- 50. Palmer A. G., 3rd (2001) NMR probes of molecular dynamics: overview and comparison with other techniques. Annu. Rev. Biophys. Biomol. Struct. 30, 129–155 [DOI] [PubMed] [Google Scholar]
- 51. Halle B., Davidovic M. (2003) Biomolecular hydration: from water dynamics to hydrodynamics. Proc. Natl. Acad. Sci. U.S.A. 100, 12135–12140 [DOI] [PMC free article] [PubMed] [Google Scholar]
- 52. Fawzi N. L., Ying J., Ghirlando R., Torchia D. A., Clore G. M. (2011) Atomic-resolution dynamics on the surface of amyloid-beta protofibrils probed by solution NMR. Nature 480, 268–272 [DOI] [PMC free article] [PubMed] [Google Scholar]
- 53. Fawzi N. L., Ying J., Torchia D. A., Clore G. M. (2010) Kinetics of amyloid β monomer-to-oligomer exchange by NMR relaxation. J. Am. Chem. Soc. 132, 9948–9951 [DOI] [PMC free article] [PubMed] [Google Scholar]
- 54. Lang L., Kurnik M., Danielsson J., Oliveberg M. (2012) Fibrillation precursor of superoxide dismutase 1 revealed by gradual tuning of the protein-folding equilibrium. Proc. Natl. Acad. Sci. U.S.A. 109, 17868–17873 [DOI] [PMC free article] [PubMed] [Google Scholar]
- 55. Cohen S. I., Vendruscolo M., Dobson C. M., Knowles T. P. (2012) From macroscopic measurements to microscopic mechanisms of protein aggregation. J. Mol. Biol. 421, 160–171 [DOI] [PubMed] [Google Scholar]
- 56. Knowles T. P., Waudby C. A., Devlin G. L., Cohen S. I., Aguzzi A., Vendruscolo M., Terentjev E. M., Welland M. E., Dobson C. M. (2009) An analytical solution to the kinetics of breakable filament assembly. Science 326, 1533–1537 [DOI] [PubMed] [Google Scholar]
- 57. Meinhardt J., Sachse C., Hortschansky P., Grigorieff N., Fändrich M. (2009) Aβ(1–40) fibril polymorphism implies diverse interaction patterns in amyloid fibrils. J. Mol. Biol. 386, 869–877 [DOI] [PMC free article] [PubMed] [Google Scholar]
- 58. Jiménez J. L., Nettleton E. J., Bouchard M., Robinson C. V., Dobson C. M., Saibil H. R. (2002) The protofilament structure of insulin amyloid fibrils. Proc. Natl. Acad. Sci. U.S.A. 99, 9196–9201 [DOI] [PMC free article] [PubMed] [Google Scholar]
- 59. Lührs T., Ritter C., Adrian M., Riek-Loher D., Bohrmann B., Döbeli H., Schubert D., Riek R. (2005) 3D structure of Alzheimer's amyloid-β(1–42) fibrils. Proc. Natl. Acad. Sci. U.S.A. 102, 17342–17347 [DOI] [PMC free article] [PubMed] [Google Scholar]
- 60. Antzutkin O. N., Balbach J. J., Leapman R. D., Rizzo N. W., Reed J., Tycko R. (2000) Multiple quantum solid-state NMR indicates a parallel, not antiparallel, organization of β-sheets in Alzheimer's β-amyloid fibrils. Proc. Natl. Acad. Sci. U.S.A. 97, 13045–13050 [DOI] [PMC free article] [PubMed] [Google Scholar]
- 61. Petkova A. T., Ishii Y., Balbach J. J., Antzutkin O. N., Leapman R. D., Delaglio F., Tycko R. (2002) A structural model for Alzheimer's β-amyloid fibrils based on experimental constraints from solid state NMR. Proc. Natl. Acad. Sci. U.S.A. 99, 16742–16747 [DOI] [PMC free article] [PubMed] [Google Scholar]
- 62. Fändrich M., Schmidt M., Grigorieff N. (2011) Recent progress in understanding Alzheimer's β-amyloid structures. Trends Biochem. Sci. 36, 338–345 [DOI] [PMC free article] [PubMed] [Google Scholar]
- 63. Pawar A. P., Dubay K. F., Zurdo J., Chiti F., Vendruscolo M., Dobson C. M. (2005) Prediction of “aggregation-prone” and “aggregation-susceptible” regions in proteins associated with neurodegenerative diseases. J. Mol. Biol. 350, 379–392 [DOI] [PubMed] [Google Scholar]
- 64. Khan J. M., Qadeer A., Chaturvedi S. K., Ahmad E., Rehman S. A., Gourinath S., Khan R. H. (2012) SDS can be utilized as an amyloid inducer: a case study on diverse proteins. PLoS One 7, e29694. [DOI] [PMC free article] [PubMed] [Google Scholar]
- 65. Otzen D. (2011) Protein-surfactant interactions: a tale of many states. Biochim. Biophys. Acta 1814, 562–591 [DOI] [PubMed] [Google Scholar]
- 66. Pertinhez T. A., Bouchard M., Smith R. A., Dobson C. M., Smith L. J. (2002) Stimulation and inhibition of fibril formation by a peptide in the presence of different concentrations of SDS. FEBS Lett. 529, 193–197 [DOI] [PubMed] [Google Scholar]
Associated Data
This section collects any data citations, data availability statements, or supplementary materials included in this article.