Abstract
Sickle cell disease is an increasing global health burden. This inherited disease is characterized by a remarkable phenotypic heterogeneity, which can only partly be explained by genetic factors. Environmental factors are likely to play an important role but studies of their impact on disease severity are limited and their results are often inconsistent. This study investigated associations between a range of environmental factors and hospital admissions of young patients with sickle cell disease in London and in Paris between 2008 and 2012. Specific analyses were conducted for subgroups of patients with different genotypes and for the main reasons for admissions. Generalized additive models and distributed lag non-linear models were used to assess the magnitude of the associations and to calculate relative risks. Some environmental factors significantly influence the numbers of hospital admissions of children with sickle cell disease, although the associations identified are complicated. Our study suggests that meteorological factors are more likely to be associated with hospital admissions for sickle cell disease than air pollutants. It confirms previous reports of risks associated with wind speed (risk ratio: 1.06/standard deviation; 95% confidence interval: 1.00–1.12) and also with rainfall (1.06/standard deviation; 95% confidence interval: 1.01–1.12). Maximum atmospheric pressure was found to be a protective factor (0.93/standard deviation; 95% confidence interval: 0.88–0.99). Weak or no associations were found with temperature. Divergent associations were identified for different genotypes or reasons for admissions, which could partly explain the lack of consistency in earlier studies. Advice to patients with sickle cell disease usually includes avoiding a range of environmental conditions that are believed to trigger acute complications, including extreme temperatures and high altitudes. Scientific evidence to support such advice is limited and sometimes confusing. This study shows that environmental factors do explain some of the variations in rates of admission to hospital with acute symptoms in sickle cell disease, but the associations are complex, and likely to be specific to different environments and the individual’s exposure to them. Furthermore, this study highlights the need for prospective studies with large numbers of patients and standardized protocols across Europe.
Introduction
The clinical severity of sickle cell disease (SCD) is extremely variable.1 Genetic and genome-wide association studies have so far only explained a small fraction of this phenotypic variability.2–4 Investigations of the impact of environmental factors, including meteorological factors and air quality, on the severity of the disease conducted across a range of countries have provided inconsistent results partly because of: (i) the use of potentially inaccurate coded data (e.g. International Classification of Disease 10) rather than specific hospital records; (ii) the intricate relationships between weather and air quality exposure variables; and (iii) the use of different modeling approaches to assess such interactions.5–9 Furthermore, the impact of environmental factors on different types of SCD (HbSS versus HbSC) and on the specific clinical complications leading to hospital admissions has not been previously reported (i.e. all genotypes and clinical complications have typically been lumped together).
The costs of care for SCD patients are high and increasing.10 For the year 2010–2011, it was estimated that the total costs of hospital admissions for a SCD crisis (as a primary diagnosis) added up to more than £18,000,000 in England.11 In London, the highest hospital admission rates are seen among males in their forties, a demographic group in which rates increased from 7.6 to 26.8 per 100,000 between 2001 and 2009.12 The vast majority of patients with SCD in the UK and in France live in capital cities (68% in London, 70% in the Paris area).13 Identifying environmental factors triggering clinical complications in urban settings could therefore lead to better patient care, which could result in improved quality of life for patients with SCD and their relatives, as well as in reductions in hospital admissions and healthcare costs.
We investigated the associations between weather, air quality, and daily hospital admissions for pain, fever and acute chest syndrome (ACS) of young patients known to have SCD, over a 5-year period in London and Paris using generalized additive models (GAM) and distributed lag non-linear models (DLNM), adjusted for long-term trends and day of the week. We then compared our results with those of previous studies and discuss the direct impact that these results could have on the prevention of hospital admissions for SCD.
Methods
Data sources
We extracted anonymized daily hospital admission records from 1st January, 2008 to 31st December, 2012 for patients with SCD under the age of 18 years old at the time of admission living within a radius of ten kilometers from each of the following hospitals: King’s College Hospital (Camberwell), Evelina Children’s Hospital (Lambeth) and Royal London Hospital (Whitechapel) in London; and the Necker Hospital for Sick Children (15th arrondissement) in Paris (Online Supplementary Figure S1). Recorded reasons for hospital admissions were pain, fever, ACS and other. Information on the patients’ genotype, either HbSS or HbSC, was available for individuals admitted to the three hospitals in London, but not the one in Paris. Outcome data were collected by inspection of specific databases of SCD patients and admissions at each hospital to optimize accuracy. Too few admissions of patients with HbS β-thalassemia, a third common form of SCD, were available to be included in the study.
Official meteorological data on daily rainfall (mm); air temperature (°C), relative humidity (%), wind speed (m/s) and atmospheric pressure (hPa) were extracted from the British Atmospheric Data Centre (BADC, http://badc.nerc.ac.uk/view/badc.nerc.ac.uk__ATOM__dataent_ukmo-midas) for several monitoring stations, including Heathrow (51°28′13″N, 0°27′02″W, code 708, the reference station in London) and St. James Park (51°30′17″N, 0°07′52″W, code 697, the nearest station to the three hospitals). Measurements were highly consistent across different monitoring stations and, as a result, only data from Heathrow were included in the final analyses. Based on these preliminary analyses (not shown), data were purchased from Météo France only for one meteorological station, Paris Montsouris (48°49′18″N, 2°20′12″E). A composite index of temperature and relative humidity was calculated as a measure of apparent (or “feels like”) temperature using the following equations:14,15
| Equation 1: |
| Equation 2: |
where DT is the dew point temperature in °C; RH is the relative humidity; AT is the apparent temperature in °C; and T is the ambient temperature in °C. Lawrence’s simple approximation is fairly accurate for relative humidity values above 50%, which match conditions in London and Paris.
In addition, a “wind chill” index was also included as a composite index of temperature and wind speed:16
| Equation 3: |
where Twc is the wind chill index; Ta is the air temperature in °C; and V is the wind speed at standard anemometer height (10 meters), in km/h.
Daily mean concentrations of carbon monoxide (CO, mg/m3), nitrogen oxides (NOX = NO + NO2; μg/m3), sulfur dioxide (SO2, μg/m3), and ozone (O3, μg/m3), particle matter in two size ranges (<10 μm or PM10; and <2.5 μm, both expressed in μg/m3), black carbon (μg/m3) and particle number (N/cm3) were extracted from the London Air Quality Network (http://www.londonair.org.uk/); the DEFRA Black Carbon (https://uk-air.defra.gov.uk/networks/network-info?view=ukbsn) and the DEFRA Particle Numbers and Concentrations Networks (https://uk-air.defra.gov.uk/networks/network-info?view=particle) for London; and from the AirParif Network (http://www.airparif.asso.fr/en/) for Paris. Because not all the monitoring stations recorded all the above pollutants for the entire period of time of the study, some records are missing from the time-series. We therefore kept only data from the most complete monitoring stations (i.e. records available for at least 80% of days during the study period) and filled the gaps using an expectation–maximization imputation algorithm for multivariate normal time-series implemented in the mnimput function of the mtsdi R package. Missing values were therefore estimated by accounting for both correlation between time-series (i.e. from other monitoring stations) and time structure of the series itself (Online Supplementary Code S1). Air pollutant concentrations were normalized using a log transformation. To assess the error in imputed values, cross-validation based on a left-out sample of 100 daily records was conducted and the root mean squared error and normalized root mean square error were calculated (Online Supplementary Table S1). Separate analyses were run for monitoring stations categorized as “background” and “roadside” sites in London in order to identify potential associations with specific pollution caused by traffic.
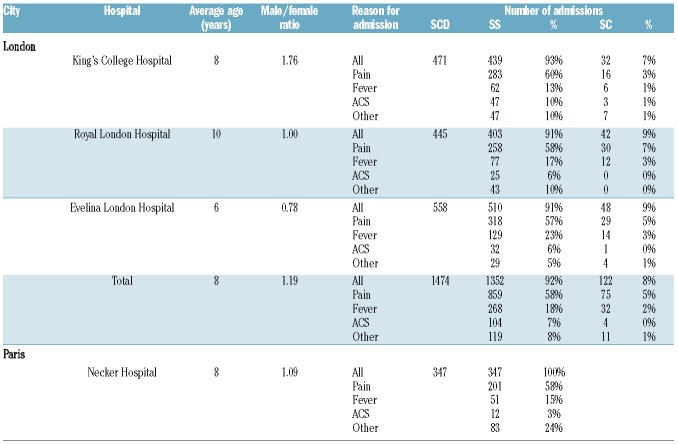
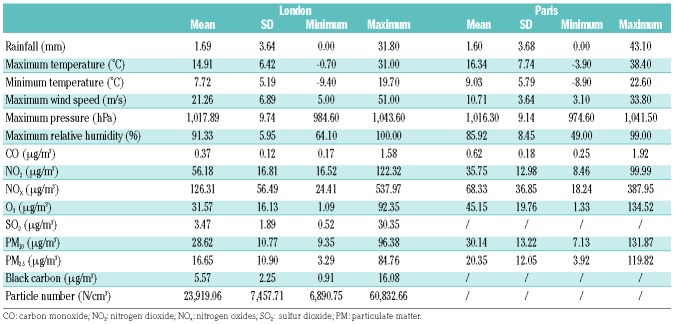
Descriptive statistics of hospital admissions (outcome) and environmental variables (exposure) in each of the study settings are shown in Table 1 and Table 2, respectively. Standardized z-score meteorological and air pollution data (Equation 4) were used in the time-series analyses in order to generate relative risks per one standard deviation increase. Statistical differences between admission rates per year, season, month and day of the week were identified by analyses of variance with the Tukey honestly significant difference test.
Table 1.
Summary statistics of sickle cell disease admission data (outcome) in London and Paris between 1st January, 2008 and 31st December, 2012.
Table 2.
Summary statistics of the meteorological and air quality parameters (exposure) in London and Paris between 1st January, 2008 and 31st December, 2012.
| Equation 4: |
where x is the exposure record, μ is the mean of the exposure records over the study period, and σ is the standard deviation of the exposure records over the study period.
Data analysis
We first explored the relationships between the different outcomes and standardized exposure variables using a quasi-Poisson GAM. We used flexible thin-plate regression splines with shrinkage for long-term trends, seasonality, effects of the year, month and day of the week, and tested for weekend effects.
Secondly, we implemented two standard methods commonly used to assess the relationship between an exposure variable and a health outcome in time-series analyses: the DLNM and an aggregated case-crossover study. DLNM is a flexible modelling framework to describe potential associations with non-linear and delayed effects in time-series data.17 Aggregated case-crossover studies provide an efficient framework for evaluating associations between transient exposures and the onset of rare acute events, when exposure measurements are not available for each individual18 In a DLNM, seasonality, long-term trends and confounding by other time-varying factors (e.g. temperature) are typically corrected by fitting flexible spline functions of the different covariates. While delayed exposure effects can be explored for a specific lag, the DLNM offers the advantage of considering all lags under investigation together. While various maximum lags (up to 3 weeks) were tested, a lag of 1 week was considered the most relevant, biologically. The standard analysis of aggregated case-crossover studies is by conditional logistic regression on a time-series dataset, in which each case day (a day with at least one hospital admission for SCD) is matched to all the other days within a given time window (e.g. 1 month). Relatively short time windows avoid long-term or seasonal effects, accounted for by strata, Fourier series or splines in DLNM. Various levels of constraints can be added by matching case and control days for a given covariate (e.g. temperature within 1°C) or a combination of covariates (e.g. temperature within 1°C and day of the week). While both methods have been previously used individually to assess environmental influences on SCD hospital admissions,8,9 the consistency of results between them has not been previously investigated.
Thirdly, based on the results from single-exposure models, we explored multiple-exposure GAM for combined lags of 0 and 1. The different combinations of exposure variables used are shown in Online Supplementary Table S5.
Finally, sensitivity analyses were performed throughout the whole model selection by: (i) exploring a full range of measurements (e.g. NO, NOX, NO2 in turn) from several individual monitoring stations and average values; (ii) checking the consistency of the results across different methods; and (iii) selecting the best-performing model based on objective criteria (generalized cross-validation, Bayesian information criteria or Akaike information criterion). All the analyses were performed with R 3.2.4 and full scripts of the code used are provided in the Online Supplementary Material and are available on request.
The study was discussed with the local research ethics committees, and formal ethical approval was not deemed necessary. All analyzed data were fully anonymized. The research was conducted in accordance with the Helsinki Declaration of 1975, as revised in 2008.
Results
Over the 5-year study period, 1,887 and 346 hospital admissions for SCD (HbSS and HbSC only) were recorded in London and Paris, respectively. The proportions of HbSS and HbSC in London, and the reasons for admissions in London and Paris are shown in Table 1. The average daily number of SCD admissions was 1.03 in London (across the 3 hospitals) and 0.19 in Paris (1 hospital), with maximums of five and four per day, respectively. Although individual patients’ data were not analyzed as part of this study, it is worth noting that some patients may have been admitted several times over the study period.
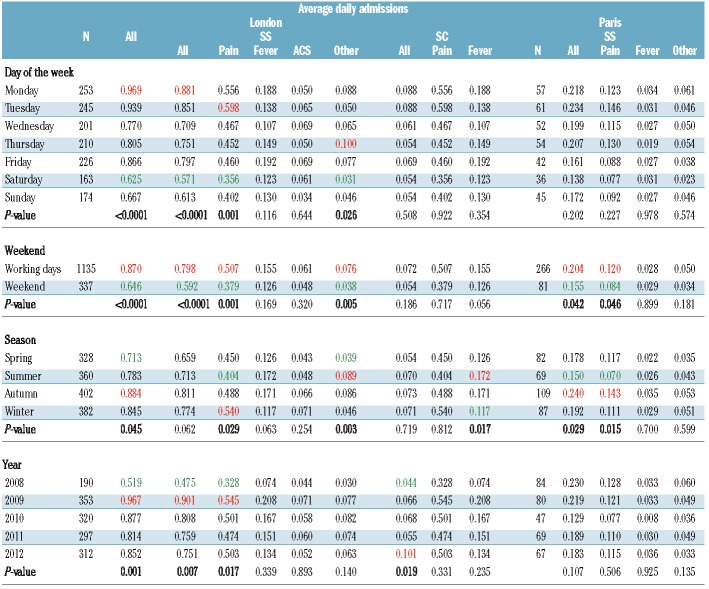
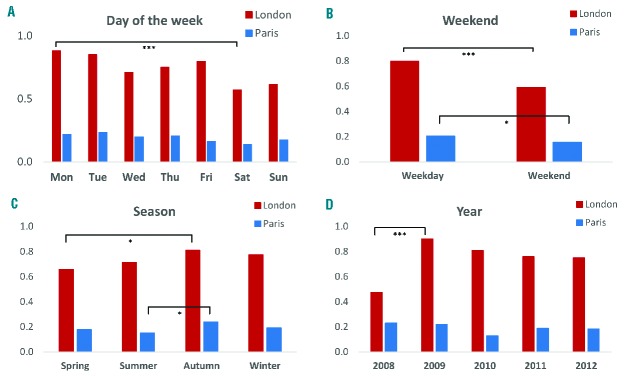
Average daily hospital admissions of SCD patients revealed differences in temporal patterns (yearly, monthly, daily and per season) between cities, genotypes and reasons for admissions (Table 3 and Figure 3). Average daily hospital admissions in London increased significantly from 0.52/day in 2008 to 0.98/day in 2009 (ANOVA, P=0.001) before stabilizing around 0.85 admissions per day, probably reflecting increasing numbers of patients over that time period. No statistically significant difference was observed between years in Paris. In London, admission rates were significantly higher in autumn than in spring (P=0.045), while in Paris, there were fewest admissions in summer (P=0.029). Hospital admissions, particularly for pain, were less frequent during weekends, in both London (P<0.0001) and Paris (P=0.042). In London, there were significantly more admissions of SCD patients on Mondays than on Saturdays (P<0.0001), although the peak of admissions of HbSS patients for pain was observed on Tuesday.
Table 3.
Effects of day of the week, weekend, season and year on admissions for sickle cell disease in Paris and London between 1st January, 2008 and 31st December, 2012, based on analyses of variance. Minimum and maximum values are highlighted in green and red, respectively, for columns in which a statistically significant difference was found (P<0.05).
Figure 3.
Average daily hospital admissions for sickle cell anemia. The average daily admissions are shown per (A) day of the week, (B) weekday/weekend, (C) season and (D) year between 1st January, 2008 and 31st December, 2012 in three hospitals in London (red) and one hospital in Paris (blue). The number of * indicates the level of statistical significance (***P<0.001, *P<0.05).
GAM testing for associations between environmental factors and hospital admissions for SCD in London revealed relative risks per one standard deviation increase of 1.06 with a 95% confidence interval (CI) of 1.01–1.12 for rainfall, and 0.93 (95% CI: 0.88–0.99) for maximum atmospheric pressure (Figure 1 and Online Supplementary Table S2). Specific GAM looking at genotypes and reasons for admissions suggested that the former association was mostly seen in HbSS patients admitted for pain (1.07; 95% CI: 1.01–1.14), whereas the latter association was strongest in SCD patients with fever (0.84; 95% CI: 0.75–0.95). Further associations were found between HbSS patients with pain and maximum wind speed (1.09; 95% CI: 1.02–1.16); with fever and CO (1.14; 95% CI: 1.01–1.30), and with other complications and PM2.5 (1.22; 95% CI: 1.02–1.46). Similar results were obtained when looking only at “background” or “roadside” monitoring stations (results not shown). No specific associations were identified for HbSC patients, possibly due to their smaller numbers. In Paris, we found a relative risk of 0.75 (95% CI: 0.57–0.99) for patients with pain in relation to minimum temperature.
Figure 1.
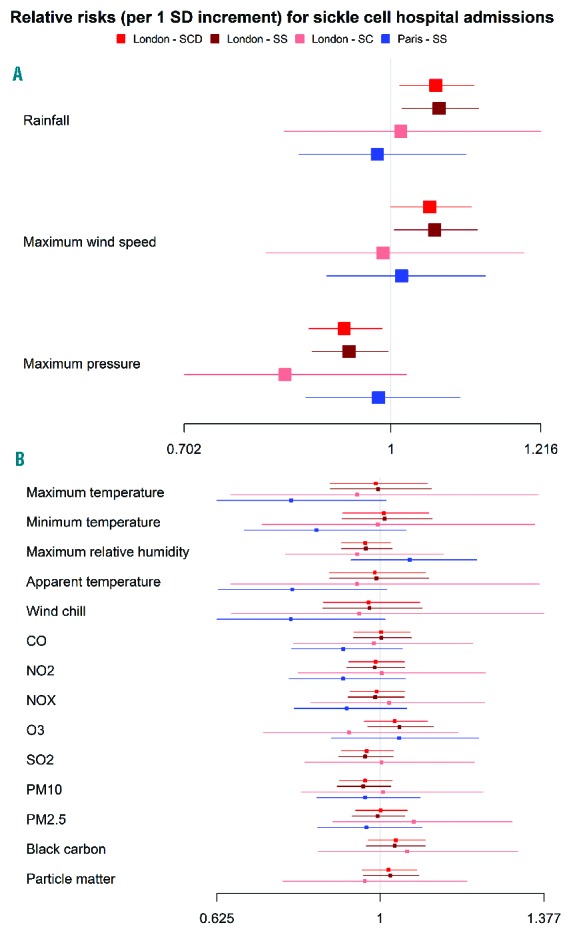
Forest plots of associations between environmental factors and admissions for sickle cell disease. The plots show associations at lags 0 and 1 between environmental factors, including weather and air pollution, and hospital admissions for sickle cell disease in London and Paris, based on generalized additive models corrected for long-term trends and weekend effect. Panel A shows variables with statistically significant associations, while panel B shows those with non-statistically significant associations.
DLNM, which account for lag effects, only supported associations with rainfall (1.06; 95% CI: 1.01–1.12) at lag 0 in London (Figure 2 and Online Supplementary Table S3). An association with black carbon at lag 6 was also found (1.08; 95% CI: 1.02–1.16). A similar effect of wind speed was found in Paris for a lag of 3 days (1.08; 95% CI: 1.02–1.13). In addition, an association was found with CO at lag 6 (1.14; 95% CI: 1.00–1.29). For HbSC, significant associations with maximum pressure (0.66; 95% CI: 0.52–0.83 at lag 0) and maximum relative humidity (0.91; 95% CI: 0.84–1.00 at lag 3; 0.88; 95% CI: 0.79–0.99 at lag 4) were found (Online Supplementary Figure S2). Statistically significant associations often differed when comparing the main reasons for hospital admission (Online Supplementary Figure S3). For example, maximum temperature was a risk factor at lags 1 and 2 for ACS but not for fever or pain, while maximum pressure appeared protective at lag 0 for pain and fever but not for ACS.
Figure 2.
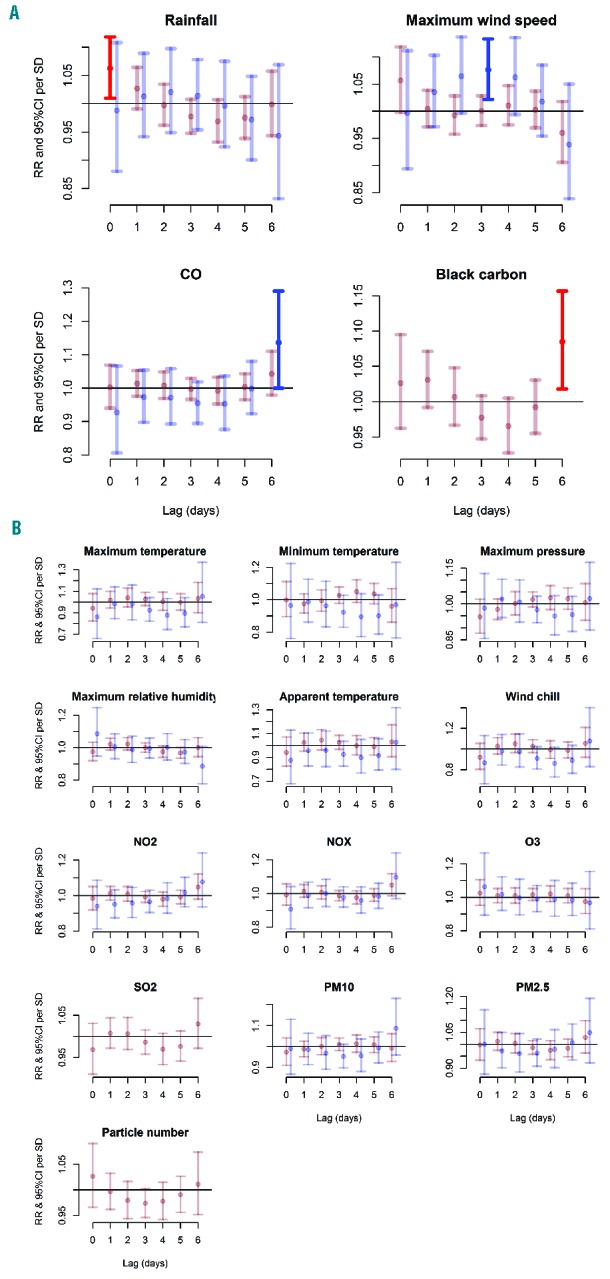
Lag plots of relative risks of hospital admissions for sickle cell disease according to exposure to environmental factors. The lag plots of relative risks (RR) and 95% confidence intervals (CI) per standard deviation (SD) increase in 17 exposure variables (8 for meteorological conditions and 9 for air quality) are based on distributed lag non-linear models with all lags (0–7 days) modeled together using a polynomial constraint for sickle cell anemia (HbSS) admissions in London (red) and Paris (blue) between 1st January, 2008 and 31st December, 2012. Panel A shows variables with statistically significant associations, while panel B shows those with non-statistically significant associations. Statistically significant risks are shown in a brighter red or blue for London and Paris, respectively. Data on black carbon and particle number were not available for Paris.
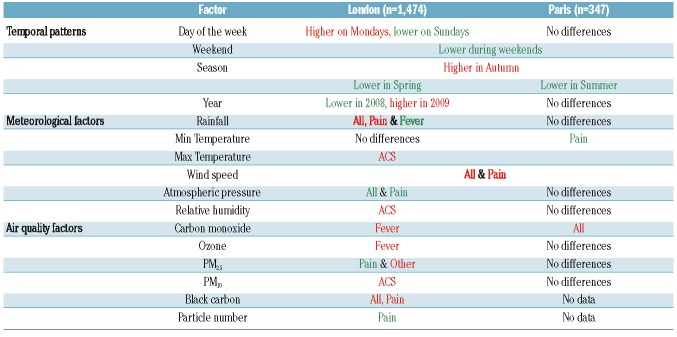
In London, the results of multiple-exposure GAM support an association between admissions for pain for patients with HbSS, and rainfall and maximum wind speed, while maximum pressure appeared protective for HbSS patients with fever (Online Supplementary Table S5). No statistically significant associations were found in multiple-exposure analyses for Paris. These results were consistent with the findings of single-exposure GAM. A summary of the convergence and divergence of associations identified in London and Paris is presented in Table 4.
Table 4.
Summary of the congruence and divergence of statistically significant associations between environmental factors and hospital admissions for sickle cell anemia (SS) in London and Paris between 1st January, 2008 and 31st December, 2012. Red indicates risk factors, while green indicates protective factors for the following reasons of admissions: all, pain, fever, acute chest syndrome (ACS) or other. Main associations are shown in bold.
Discussion
A better understanding of the environmental factors triggering clinical complications in patients with SCD could allow healthcare professionals to give more accurate information to patients about the risks associated with certain conditions, facilitating behavioral changes to avoid clinical complications and hospital admissions. Evidence generated so far about the influence of meteorological factors and pollutants on symptoms in SCD has often provided discordant results, which are difficult to translate into health policies and advice for patients. This is partly because previous studies were mostly small, combining reasons for admissions and not distinguishing between different types of SCD, in addition to the variability of climate effects in different countries. Perhaps the most consistently quoted effect is the increase in episodes of acute pain associated with cold weather. Using high-quality hospital records from London and Paris, combined with rigorous time-series analysis methods, our results do not support strong associations between hospital admissions for SCD and temperature. This might be related to the urban environment in high-income countries, in which the effects of temperature changes may be countered by access to warm clothes and heated buildings. Environmental factors that consistently appeared significant throughout our analyses were rainfall, wind speed and atmospheric pressure. Wind speed has been identified in several previous studies in urban settings, and is emerging as one of the most important meteorological factors.13 Rainfall has not been consistently linked to increased hospital admissions, but emerges as an important factor, particularly precipitating pain in children with HbSS. Both high wind speed and rainfall have the effect of causing rapid skin cooling, which has been implicated as a cause of vaso-occlusive pain in physiological experiments,19 and might be the mechanism of action in this case. While standard composite indices used in this study (i.e. apparent temperature and wind chill) did not reveal statistically significant associations, the development of a novel, specific composite index allowing the risk of hospitalization of SCD patients to be predicted based on the above results would warrant further investigation.
We also identified a clear weekend effect, in both London and Paris, which is relevant in the broader context of healthcare provision.20 Lower admission rates during weekends, particularly for pain, may arise from many different social and logistical issues, but are unlikely to be primarily related to environmental factors. Perhaps the most plausible explanation is that parents were able to stay at home and look after their children at the weekends, whereas this becomes much harder during the working week. It does suggest that improved community support for families with sick children may be effective at reducing hospital admissions. Although patients included in this study were managed by hematologists familiar with SCD, delaying seeking healthcare could also reflect the distress of facing common misconceptions (e.g. lack of tolerance to pain, drug addiction) previously reported among medical staff and of longer waiting times compared to other complications (e.g. long bone fracture) previously reported in emergency departments.21
To the best of our knowledge, this study is the largest to use accurate hospital-based registers of patients with SCD with data specifically collected for this study. Other large studies have relied on coded data generated for routine administrative purposes, which are often associated with misclassification errors. We also analyzed the different types of SCD separately, as there is considerable evidence that the pathophysiology of HbSS and HbSC disease is significantly different.22 Furthermore, we focused on young children to avoid a series of confounding factors involved at older ages (e.g. smoking, occupational exposure, comorbidities) and used rigorous statistical methods, which revealed mostly consistent results for the main associations identified. Conducting separate analyses for each genotype and reason for admission revealed important differences, which could partly explain the inconsistency of previous results. Despite focusing on a 5-year period, the number of admissions in Paris and the number of admissions of HbSC patients in London remained relatively limited, which led to large confidence intervals, potentially masking some associations.
Extreme temperatures are believed to trigger acute vaso-occlusive complications in patients with SCD. This is reflected in advice given to patients, but we could not find consistent support for such an association in our study, although increasing minimum temperature was associated with a significant reduction in admissions for acute pain in Paris (relative risk 0.75; 95% CI: 0.57 – 0.99) (Online Supplementary Table S2). Instead, we found significant associations with maximum wind speed, which have previously been reported for London.6 In contrast to an earlier, smaller study in London, we did not find significant associations between increased numbers of SCD admissions and low concentrations of NOx, low concentrations of CO and high concentrations of O3.7
A recent study of 17,710 emergency hospital admissions of SCD patients in Paris concluded that most weather conditions and air pollutants assessed were correlated to each other and influenced the rate of such admissions in SCD patients over a lag period of 1 week.8 CO concentrations, day-to-day mean temperature drop and higher wind speed were associated with increased risks in a multiple-exposure analysis. Contrary to our study, the authors did not find a weekend effect, which might be due to their focus on emergency admissions. Despite using a much larger number of admissions, their data were partly based on International Classification of Disease codes, included all types of SCD and all reasons for admission, and covered a much broader age range (2 to 70 years old). These findings may differ from ours because risk factors for acute complications may be very different in children than adults; additionally, children are known to spend most of their time close to home, exposed to the same environment, whereas adults often work far from home and are potentially exposed to several different environments each day.
Another recent study assessing the association between air pollution and emergency visits of children with SCD in Sao Paulo, Brazil, found remarkably high increases in relation to PM10, NO2, CO and O3.9 We could not find consistent risks associated with pollutants in this study, particularly of the magnitude described in Brazil. While both studies tested for lag effects, the Brazilian study looked at lags of up to 4 days while we tested for effects up to 1 week. The levels of exposure to pollution and environmental co-factors are very different in Brazil (e.g. NO2 = 104.59 μg/m3 ± 48.56; T°min = 15.23°C ± 3.40) compared to London (NO2 = 56.18 μg/m3 ± 16.84; T°min = 7.73°C ± 5.19) and Paris (NO2 = 35.76 μg/m3 ± 13.00; T°min = 9.04°C ± 5.79), and it is perhaps unsurprising that the findings are different.
Environmental factors are important determinants of acute complications in children with SCD, but these effects are complex and differ significantly with geography and city design, even between apparently similar cities such as London and Paris. Better understanding of these factors in different geographic settings is important to allow patients and families to be given accurate information on how to reduce the risk of acute complications. This approach is particularly important in a chronic disease, such as SCD, for which there are few effective therapeutic options. Although the precise mechanism by which wind speed could trigger complications in SCD is not clear, it represents the environmental factor that is most consistently identified in association studies in European cities.
Further studies are needed to accurately define environmental effects in SCD. These are particularly relevant in some cities in sub-Saharan Africa and India, where pollution levels and patient numbers are very high,23 and are likely to become more relevant as global warming and air pollution increase. Future studies need to consider the different types of SCD separately, and also consider how these may change with the age of the patient. Other important questions on environmental effects which need to be answered include the role of the home environment and the long-term effects of exposure to air pollutants.13 Due to the range of complications associated with SCD and to differences in exposures between patients living in urban environments, monitoring the exposure of large number of patients through personal devices (e.g mobile phone apps or personal monitors) might be particularly informative. Environmental factors in SCD are particularly important to understand because they can be manipulated relatively easily and cheaply with simple advice, unlike genetic causes of variation. Increased knowledge in this area will also be valuable for public health services, to understand when more patients will be admitted to hospital, and what housing requirements are important for families with SCD.
Supplementary Material
Acknowledgments
The authors acknowledge METEO FRANCE for supplying meteorological data for Paris, and Véronique Ghersi from AirParif for advice about air quality data for Paris. This study had no specific funding. The authors would like to thank the Stroke Association for supporting some of the work involved in this study, although this Association had no role in the study design, data collection and analysis, decision to publish, or preparation of the manuscript.
Footnotes
Check the online version for the most updated information on this article, online supplements, and information on authorship & disclosures: www.haematologica.org/content/102/4/666
References
- 1.Rees DC, Williams TN, Gladwin MT. Sickle-cell disease. Lancet. 2010;376(9757):2018–2031. [DOI] [PubMed] [Google Scholar]
- 2.Steinberg MH. Predicting clinical severity in sickle cell anaemia. Br J Haematol. 2005;129(4):465–481. [DOI] [PubMed] [Google Scholar]
- 3.Sebastiani P, Solovieff N, Hartley SW, et al. Genetic modifiers of the severity of sickle cell anemia identified through a genome-wide association study. Am J Hematol. 2010;85(1):29–35. [DOI] [PMC free article] [PubMed] [Google Scholar]
- 4.Serjeant GR. The natural history of sickle cell disease. Cold Spring Harb Perspect Med. 2013;3(10):a011783. [DOI] [PMC free article] [PubMed] [Google Scholar]
- 5.Redwood AM, Williams EM, Desal P, Serjeant GR. Climate and painful crisis of sickle-cell disease in Jamaica. BMJ. 1976;1(6001):66–68. [DOI] [PMC free article] [PubMed] [Google Scholar]
- 6.Jones S, Duncan ER, Thomas N, et al. Windy weather and low humidity are associated with an increased number of hospital admissions for acute pain and sickle cell disease in an urban environment with a maritime temperate climate. Br J Haematol. 2005;131(4):530–533. [DOI] [PubMed] [Google Scholar]
- 7.Yallop D, Duncan ER, Norris E, et al. The associations between air quality and the number of hospital admissions for acute pain and sickle-cell disease in an urban environment. Br J Haematol. 2007;136(6):844–848. [DOI] [PubMed] [Google Scholar]
- 8.Mekontso Dessap A, Contou D, Dandine-Roulland C, et al. Environmental influences on daily emergency admissions in sickle-cell disease patients. Medicine. 2014;93(29):e280. [DOI] [PMC free article] [PubMed] [Google Scholar]
- 9.Barbosa SM, Farhat SC, Martins LC, et al. Air pollution and children’s health: sickle cell disease. Cad Saude Publica. 2015;31(2):265–275. [DOI] [PubMed] [Google Scholar]
- 10.Kauf TL, Coates TD, Huazhi L, Mody-Patel N, Hartzema AG. The cost of health care for children and adults with sickle cell disease. Am J Hematol. 2009;84(6):323–327. [DOI] [PubMed] [Google Scholar]
- 11.Pizzo E, Laverty AA, Phekoo KJ, et al. A retrospective analysis of the cost of hospitalizations for sickle cell disease with crisis in England, 2010/11. J Public Health. 2015;37(3):529–539. [DOI] [PMC free article] [PubMed] [Google Scholar]
- 12.AlJuburi G, Laverty AA, Green SA, et al. Trends in hospital admissions for sickle cell disease in England, 2001/02–2009/10. J Public Health. 2012;34(4):570–576. [DOI] [PubMed] [Google Scholar]
- 13.Tewari S, Brousse V, Piel FB, Menzel S, Rees DC. Environmental determinants of severity in sickle cell disease. Haematologica. 2015;100(9):1108–1116. [DOI] [PMC free article] [PubMed] [Google Scholar]
- 14.Lawrence MG. The relationship between relative humidity and the dewpoint temperature in moist air: a simple conversion and applications. B Am Meteorol Soc. 2005;86(2):225–233. [Google Scholar]
- 15.Rodopoulou S, Samoli E, Analitis A, Atkinson RW, de’Donato FK, Katsouyanni K. Searching for the best modeling specification for assessing the effects of temperature and humidity on health: a time series analysis in three European cities. Int J Biometeorol. 2015;59(11):1585–1596. [DOI] [PubMed] [Google Scholar]
- 16.Blazejczyk K, Epstein Y, Jendritzky G, Staiger H, Tinz B. Comparison of UTCI to selected thermal indices. Int J Biometeorol. 2012;56(3):515–535. [DOI] [PMC free article] [PubMed] [Google Scholar]
- 17.Bhaskaran K, Gasparrini A, Hajat S, Smeeth L, Armstrong B. Time series regression studies in environmental epidemiology. Int J Epidemiol. 2013;42(4):1187–1195. [DOI] [PMC free article] [PubMed] [Google Scholar]
- 18.Armstrong BG, Gasparrini A, Tobias A. Conditional Poisson models: a flexible alternative to conditional logistic case cross-over analysis. BMC Med Res Methodol. 2014;14:122. [DOI] [PMC free article] [PubMed] [Google Scholar]
- 19.Mohan J, Marshall JM, Reid HL, Thomas PW, Hambleton I, Serjeant GR. Peripheral vascular response to mild indirect cooling in patients with homozygous sickle cell (SS) disease and the frequency of painful crisis. Clin Sci. 1998;94(2):111–120. [DOI] [PubMed] [Google Scholar]
- 20.Freemantle N, Ray D, McNulty D, et al. Increased mortality associated with weekend hospital admission: a case for expanded seven day services? BMJ. 2015;351:h4596. [DOI] [PubMed] [Google Scholar]
- 21.Haywood C, Tanabe P, Naik R, Beach MC, Lanzkron S. The impact of race and disease on sickle cell patient wait times in the emergency department. Am J Emerg Med. 2013;31(4):651–656. [DOI] [PMC free article] [PubMed] [Google Scholar]
- 22.Rees DC, Thein SL, Osei A, et al. The clinical significance of K-Cl cotransport activity in red cells of patients with HbSC disease. Haematologica. 2015;100(5):595–600. [DOI] [PMC free article] [PubMed] [Google Scholar]
- 23.Piel FB, Hay SI, Gupta S, Weatherall DJ, Williams TN. Global burden of sickle cell anaemia in children under five, 2010–2050: modelling based on demographics, excess mortality, and interventions. PLoS Med. 2013;10(7):e1001484. [DOI] [PMC free article] [PubMed] [Google Scholar]
Associated Data
This section collects any data citations, data availability statements, or supplementary materials included in this article.


