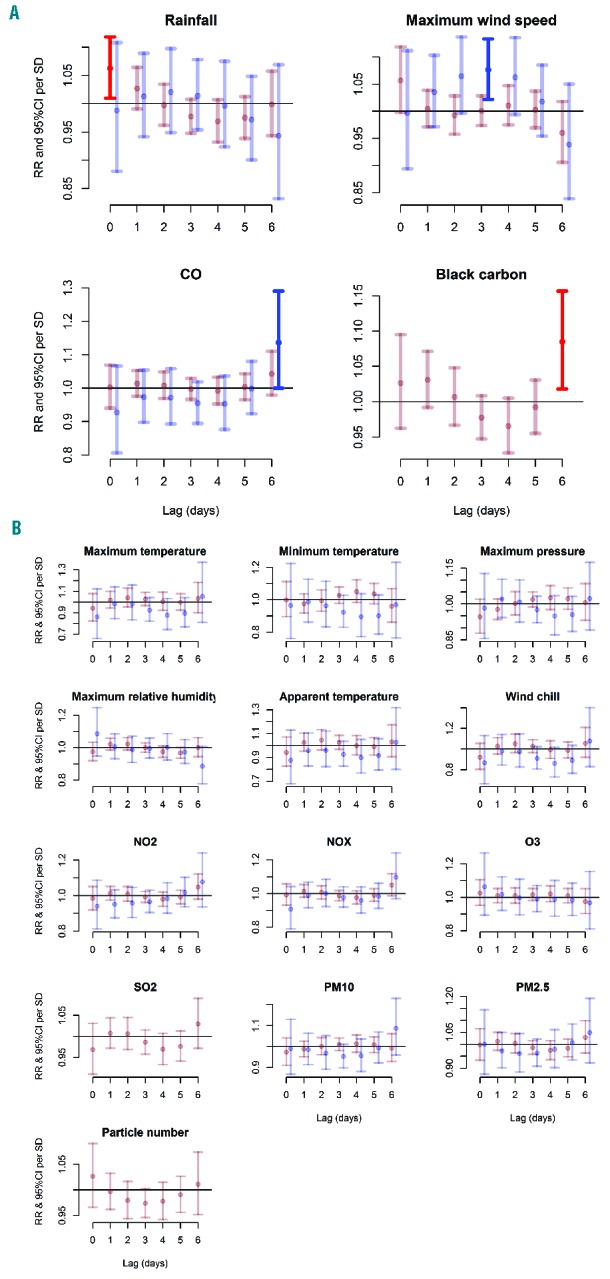
Figure 2.

Lag plots of relative risks of hospital admissions for sickle cell disease according to exposure to environmental factors. The lag plots of relative risks (RR) and 95% confidence intervals (CI) per standard deviation (SD) increase in 17 exposure variables (8 for meteorological conditions and 9 for air quality) are based on distributed lag non-linear models with all lags (0–7 days) modeled together using a polynomial constraint for sickle cell anemia (HbSS) admissions in London (red) and Paris (blue) between 1st January, 2008 and 31st December, 2012. Panel A shows variables with statistically significant associations, while panel B shows those with non-statistically significant associations. Statistically significant risks are shown in a brighter red or blue for London and Paris, respectively. Data on black carbon and particle number were not available for Paris.
