

Abstract
B-cell maturation antigen is expressed on plasma cells. In this study, we have identified serum B-cell maturation antigen as a novel biomarker that can monitor and predict outcomes for multiple myeloma patients. Compared to healthy donors, patients with multiple myeloma showed elevated serum B-cell maturation antigen levels (P<0.0001). Serum B-cell maturation antigen levels correlated with the proportion of plasma cells in bone marrow biopsies (Spearman’s rho = 0.710; P<0.001), clinical status (complete response vs. partial response, P=0.0374; complete response vs. progressive disease, P<0.0001), and tracked with changes in M-protein levels. Among patients with non-secretory disease, serum B-cell maturation antigen levels correlated with bone marrow plasma cell levels and findings from positron emission tomography scans. Kaplan-Meier analysis demonstrated that serum B-cell maturation antigen levels above the median levels were predictive of a shorter progression-free survival (P=0.0006) and overall survival (P=0.0108) among multiple myeloma patients (n=243). Specifically, patients with serum B-cell maturation antigen levels above the median level at the time of starting front-line (P=0.0043) or a new salvage therapy (P=0.0044) were found to have shorter progression-free survival. Importantly, serum B-cell maturation antigen levels did not show any dependence on renal function and maintained independent significance when tested against other known prognostic markers for multiple myeloma such as age, serum β2 microglobulin, hemoglobin, and bone disease. These data identify serum B-cell maturation antigen as a new biomarker to manage multiple myeloma patients.
Introduction
Multiple myeloma (MM) is a bone marrow (BM)-based B-cell malignancy of terminally differentiated plasma cells.1–3 These clonal cells produce excessive amounts of monoclonal immunoglobulins (Ig).3
The clinical course of MM patients is quite variable and, with the currently available tools, predicting individual patient outcomes is a difficult task. The introduction of several new therapeutic agents for MM patients has resulted in a dramatic increase in the number of effective combination therapies and led to a marked improvement in their median overall survival (OS).4 More recently, therapeutic options for MM patients have expanded to include immune-based approaches.5 Unfortunately, the methods for evaluating MM patients’ disease status have not kept pace with this expanding profile. Thus, developing more effective methods to characterize and follow these patients is becoming increasingly important. The Durie-Salmon classification system is commonly used to determine MM patients’ outcomes.6 Though a correlation between disease stage and length of survival was demonstrated, a number of the parameters used in this staging system were shown to have considerable shortcomings. The number of lytic lesions identified is subject to the radiologist’s interpretation, creating inconsistencies in the determination of stage.7 Elevated serum creatinine and reduced hemoglobin levels have many different etiologies, and may not necessarily be related to the patient’s MM.8,9
Serum beta 2 microglobulin (β2M) has also been used to help stratify myeloma patients and predict OS.10,11 Its utility is limited, however, in the presence of renal failure from any cause, since β2M cannot be effectively cleared by the kidneys. With compromised renal function, serum β2M levels remain elevated and confound the interpretation of its test results. Predicting patients’ outcomes is no longer feasible under these conditions.12,13 Although serum free light chain (SFLC) levels also have a rapid turnover, their reliability as an early determinant of response has been less than optimal.14,15 Thus, establishing more effective prognostic indicators remains an area of interest.
The International Staging System (ISS) has largely replaced the Durie-Salmon staging system to predict OS for MM patients, relying on serum β2M and albumin levels at the time of diagnosis.16 However, Bataille et al. have indicated that ISS staging may, in fact, be a rather potent staging system for “pathological aging” rather than a specific MM staging system.17 Consistent with this, recent studies have shown that ISS is not consistent in predicting outcomes in the era of novel targets.18,19 Our recent findings have also demonstrated that there were no significant differences in OS between patients with different ISS stages.20 Besides the problems with using serum β2M levels mentioned above, the other component of the ISS staging system, serum albumin, is similarly subject to numerous limitations in that its levels are influenced by many factors unrelated to MM, including poor nutrition, acute or chronic inflammation, and loss of albumin via gastrointestinal or renal disorders.21
A variety of other prognostic markers and indicators have also been evaluated, including plasma cell labeling index, C-reactive protein, plasmablast morphology, cytogenetics, and BM angiogenesis.10,22,23 Combining these factors with genetic markers based on cytogenetics, fluorescent in situ hybridization and gene expression profiling from BM specimens have been used to assign different risk categories for MM patients.24–27 However, in addition to the hardships associated with undergoing invasive procedures to obtain suitable material, these tests can be both quite costly and lead to inconsistent results depending upon the quality and the amount of malignant tumor cells obtained. Thus, there remains much confusion regarding which factors and methods can be effectively used to predict outcomes for MM patients.
The levels of several other serum proteins, such as soluble interleukin (sIL)-6, syndecan-1 and sclerostin have also been explored for MM patients and their usefulness as prognostic markers evaluated. Studies have shown a correlation between high levels of sIL-6 and progressive disease (PD).28,29 sIL-6 levels have also been used to distinguish monoclonal gammopathy of undetermined significance (MGUS) from MM.27 Although sIL-6 is not directly produced by MM cells, its levels correlate with OS for MM patients. However, sIL-6 is only present in a small minority of MM patients, limiting its usefulness as a prognostic marker.28,29 Syndecan-1 and sclerostin levels have been determined in MM patients. Both proteins accumulate in the BM and their levels are primarily reflective of myeloma-related bone disease. Serum syndecan-1 levels are elevated in MM patients and correlated with poor prognosis, whereas serum sclerostin levels have not been found to be significantly different from that of a control group.30–33
There are also significant limitations with respect to the tests that are currently used to monitor these patients’ course of disease. Changes in M-protein levels from results of protein electrophoresis, measured in serum, urine or both are widely accepted as markers of disease status.4,14,23 However, measurement of M-protein can be unreliable, especially given that its levels are determined subjectively. Furthermore, Katzmann et al. have suggested that the 24-hour urine collection be eliminated as a test to monitor MM patients due to the advent of the similarly effective SFLC assay.34 The measurements of specific paraprotein types, such as IgA can also be problematic when assessed using an electrophoretic assay making their levels unreliable to monitor disease status.23,34
Other traditional methods of following MM include the quantitative evaluation of Igs, but this method also has its limitations. Differences in reagents over time lead to variations in these results, and the levels do not specifically measure only the monoclonal antibody that can be problematic especially among patients with low levels of paraprotein. The HevyLite assay has been used to help identify the involved Ig, but it still does not specifically identify the paraprotein within all of the matching isotype pairs.35 Notably, the serum half-life of Ig is also long,36,37 so that real-time measurements do not necessarily reflect current disease activity. More recently, the measurement of SFLC levels has been used; its levels and ratios and differences between the involved and uninvolved light chains are useful for monitoring and predicting outcomes for MM patients.34,38 The rapid turnover of these levels in the blood also allows for a more current indication of tumor load than measurement of conventional M-protein levels. However, SFLCs are not always elevated among patients with active disease and previous studies have reported a high degree of variability from results of the test especially during the first few weeks following initiation of a new therapy and among patients with renal impairment.15,34,38
A major drawback of all of the currently used tests to follow the course of disease is their inability to determine changes in clinical status among MM patients with non-secretory disease (NSD).39,40 Currently, these individuals are treated by following an expensive and invasive paradigm involving frequent BM biopsies with variable results depending upon the site where the sample is obtained and positron emission tomography (PET) scans.40
B-cell maturation antigen (BCMA), a member of the tumor necrosis factor receptor family, is another protein whose function has been implicated in B-cell malignancies. It is expressed on the cell surface of mature and malignant B lymphocytes41,42 and is known to bind B-lymphocyte stimulator (BLyS), also known as B cell-activating factor (BAFF), a protein which plays a significant role in the growth and survival of MM cells.43 We have recently identified BCMA in serum and shown its levels are higher among patients with monoclonal gammopathies.44 In mice, studies have shown that soluble BCMA has a half-life of approximately 24–36 hours45 which is much faster than the turnover rates for IgG (21 days) and IgA (7 days),36,37 suggesting that soluble BCMA levels can be used to evaluate the effect of a given treatment much more rapidly than through measurement of monoclonal antibody levels.
In the current preliminary study, we determined the diagnostic, prognostic and monitoring values of serum (s)BCMA levels in a population of MM patients including patients with non-secretory disease (NSD) and also compared it to other known independent prognostic and monitoring markers.
Methods
Patients
Serum was collected from 243 MM patients followed in a single clinic that specialized in the treatment of MM (James R. Berenson, MD, Inc.). All patients provided informed consent in accordance with local institutional review board requirements and the Declaration of Helsinki. The International Myeloma Working Group Uniform Response Criteria (IMWG-URC) was used to determine the patient’s clinical status.7
Assessment of serum BCMA
Frozen serum samples were thawed and diluted 1:500. An enzyme-linked immunosorbent assay (ELISA) was used to determine sBCMA levels according to the manufacturer’s protocol (R&D Systems, Minneapolis, MN, USA; catalogue # DY193E) and as previously published.44 sBCMA levels were represented as the mean of triplicate samples for each specimen. Its levels were compared with the proportion of plasma cells in BM biopsy specimens. sBCMA was compared to the patients’ current clinical status and changes in M-protein levels during their course of disease. In addition, for patients with NSD, sBCMA was correlated with changes in their PET scan findings and plasma cell involvement in their BM.
Statistical analysis
The percentage of plasma cell infiltration as measured by bone marrow biopsy was scatter plotted against serum BCMA and a line of best fit was regressed through the data using an exponential function. To correlate the two, sBCMA levels were log10 transformed and the results were compared using Spearman’s correlation coefficient.
Mann-Whitney U-test was used to compare sBCMA levels of smoldering MM or active MM patients to healthy controls and to compare sBCMA levels among patients with differences in clinical status.
An ROC curve threshold analysis was used to determine the sensitivity and specificity of sBCMA when used as a tool to determine presence or absence of active disease requiring therapy.
Kaplan-Meier survival analysis and log-rank comparison tests were used to determine the associations between sBCMA levels and OS and PFS. OS was evaluated from the time of initial sBCMA measurement to date of last follow up or death from any cause. PFS was evaluated from the time of initial sBCMA measurement to the first day of disease progression or death from any cause.
Proportional Hazard Regression Analysis was utilized to determine the predictive ability of sBCMA on OS and other prognostic factors, including age, serum creatinine, serum hemoglobin, and ISS staging.
One-way univariate analysis of variance was performed to study the relationship of sBCMA with bone disease status, based on presence of osteopenia, osteolytic lesions and/or fractures40 as well as the patient’s clinical status. A multivariate analysis of sBCMA with the other covariates including age, serum β2M, hemoglobin, creatinine, and bone disease was also performed to analyze the relationship of sBCMA levels with other covariates. All of the statistical analysis was performed using JMP Pro for Windows by SAS, GraphPad Prism 4 (San Diego, CA, USA) and R. P<0.05 was considered statistically significant.
Results
Patients
Multiple myeloma patients’ characteristics (n=243) at baseline are shown in Table 1. The Ig isotype was found to be IgA, IgG, and IgM in 48 (19.8%), 156 (64.4%), and 3 (1.2%) patients, respectively, whereas 33 (16.6%) showed the absence of a serum monoclonal heavy chain-containing Ig component and 3 were non-secretory patients. The median serum β2M level was 3.5 mg/L (range 1.0–26.4 mg/L). According to ISS criteria, 85 (35.1%), 42 (17.3%) and 54 (22.3%) patients had stage I, II and III disease at diagnosis, respectively, and 61 patients (25.3%) could not be classified. The median follow-up time from the time of their diagnosis for all MM patients, those without a detectable serum M-protein, and NSD were 51 months (range 3–367 months), 32 months (range 4–215 months) and 11 months (range 11–53 months), respectively.
Table 1.
Patients’ demographics.

Serum BCMA levels correlate with bone marrow plasma cell involvement and are elevated in MM patients
Among 57 patients with MM, the percentage of plasma cells in BM biopsy specimens was compared to their sBCMA levels, and found to correlate with one another (Spearman’s r=0.710; P<0.001) (Figure 1A and B). sBCMA levels were evaluated for 43 age-matched healthy donors, 46 patients with smoldering MM and 44 patients with untreated active MM (Figure 2), and compared using the Mann-Whitney U-test. Results demonstrated that sBCMA levels were higher among smoldering and untreated active MM patients than healthy donors (P<0.0001). Specifically, healthy donors had a median sBCMA of 36.8 ng/mL whereas SMM patients had higher levels (median 88.9 ng/mL; P<0.0001) and patients with active untreated MM had the highest levels (median 505.9 ng/mL, P<0.0001 compared to healthy subjects and P<0.0001 compared to SMM patients) (Figure 2A). In addition, a threshold analysis was performed using a Receiver Operator Characteristic (ROC) curve. We compared the sBCMA levels of patients diagnosed as age-matched healthy donors or patients with smoldering MM (n=89) and the sBCMA levels of patients diagnosed with active, untreated MM (n=44). Patients who were part of the healthy donor and smoldering MM group were assigned a value of 0 and were therefore treated as a negative result. Patients who were part of the active, untreated MM group were assigned a 1 and were therefore treated as a positive result. The ROC curve analyzed the optimal level of sBCMA at which the number of false positives and false negatives were minimized. The analysis determined that the optimal threshold level of sBCMA for indication of active, untreated MM was 107.6 ng/mL [sensitivity (i.e. detection of active untreated MM cases) 93.2% (95%CI: 84%–100%); specificity (i.e. identifying only cases of active untreated MM above the threshold) 76.4% (95%CI: 67.4%–85.3%); area under curve 0.8805] (Figure 2B).
Figure 1.

Correlation of the proportion of plasma cells in bone marrow (BM) biopsy specimens with serum B-cell maturation antigen (sBCMA) levels in multiple myeloma (MM) patients. (A) Scatter plot showing correlation between the percentage of plasma cells in BM biopsy specimens and sBCMA levels in 57 MM patients was generated using GraphPad Prism 4. A regression line was generated using exponential growth model (Y=Start*exp [K*X]) with best-fit values (START=73.88; K=0.03404). (B) Scatter plot of Log10 transformation of sBCMA levels showing linearized correlation: Spearman correlation assessment (P<0.0001; Spearman’s rho=0.710). A regression line was generated using first order polynomial (Y=intercept +slope[X]; equation Y=0.01533[X] + 1.674; R2=0.5125.
Figure 2.
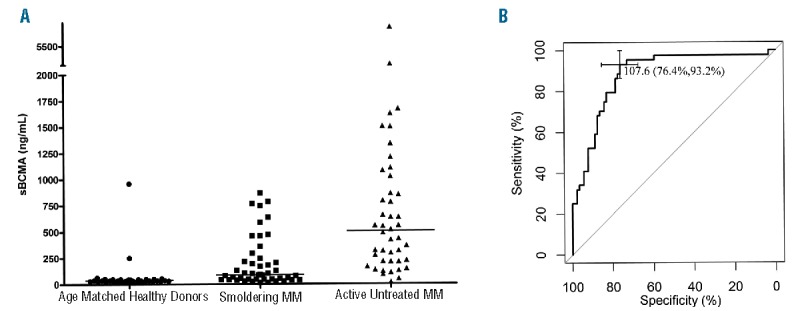
Serum B-cell maturation antigen (sBCMA) levels are elevated in multiple myeloma (MM) patients. (A) Specifically, 43 age-matched healthy donors (●) had significantly lower sBCMA levels (median 36.8 ng/mL) than 46 patients with smoldering MM (■) (median BCMA 88.9 ng/mL; P<0.0001) and 44 patients with active MM (▲) prior to any treatment (median BCMA 505.9 ng/mL; P<0.0001). (B) A threshold determination performed by ROC curve analysis indicated that the optimal threshold of sBCMA level to compare patients diagnosed as age-matched healthy donors or patients with smoldering MM (n=89) and patients diagnosed with active, untreated MM (n=44) was 107.6 ng/mL [sensitivity 93.2% (95%CI: 84%–100%); specificity 76.4% (95%CI: 67.4%–85.3%); area under curve 0.8805]. For our analysis “sensitivity” refers to the ability of sBCMA levels above a chosen threshold to be able to detect active untreated MM cases and “specificity” to sBCMA levels above a chosen threshold to identify only cases of active untreated MM above the threshold.
Serum BCMA levels correlate with M-protein levels
sBCMA levels were correlated with the levels of conventional serum protein markers and involved SFLCs during the course of disease (Figure 3 and Online Supplementary Table S1). Figure 3A demonstrates changes in conventional M-protein levels closely matched the changes in sBCMA levels in 2 representative MM patients out of 44 MM patients (Online Supplementary Table S1) whose sBCMA was evaluated during their course of disease. Consistent with the M-protein findings, sBCMA levels also correlated with the levels of the involved SFLC levels. Two examples, Patients 1547 and 2116, are shown in Figure 3B.
Figure 3.

Serum B-cell maturation antigen (sBCMA) levels correlate with changes in M-protein and serum free light chain (SFLC) levels in individual multiple myeloma (MM) patients. (A) Analysis of sBCMA (▲) versus M-protein (■) levels during the course of disease in 4 MM patients among 44 patients analyzed. (B) Analysis of sBCMA (▲) versus SFLC (■) in 2 representative MM patients during the course of their disease.
Serum BCMA levels among patients with non-secretory disease
To determine whether sBCMA can be used to monitor MM patients with NSD, sBCMA levels were compared with changes in patients’ PET scans and BM findings. NSD patients showed changes in sBCMA levels that correlated with changes in their PET scan and the percentage of BM plasma cells during their course of disease (Figure 4).
Figure 4.
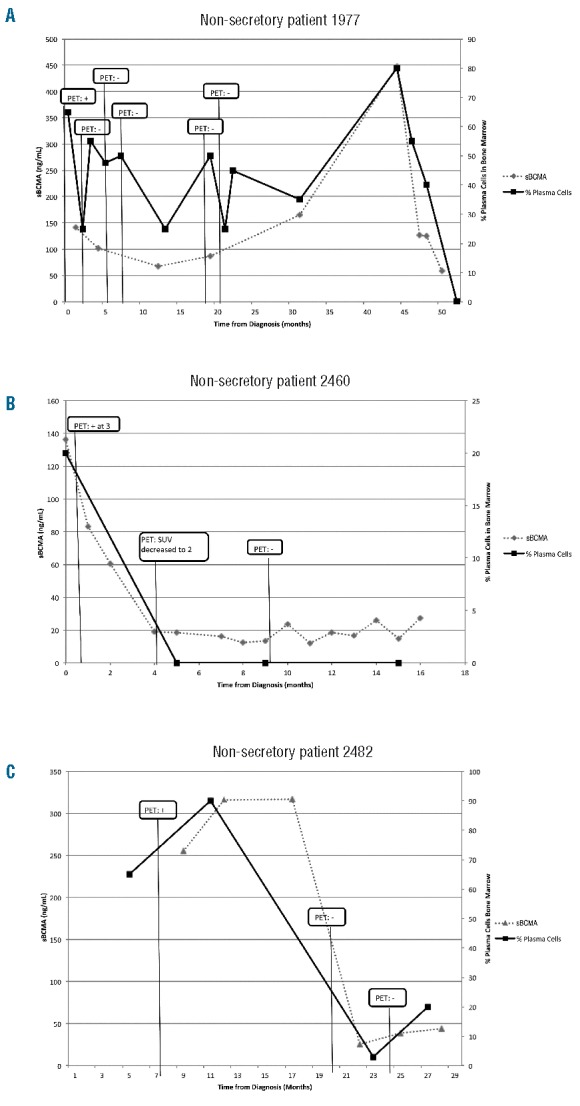
Serum B-cell maturation antigen (sBCMA) levels during the course of disease among 3 patients with non-secretory disease (NSD). (A) non-secretory Patient #1977, (B) non-secretory Patient #2460 and (C) non-secretory Patient #2482. Notably, the 3 patients with NSD showed a correlation between changes in sBCMA levels and their clinical status as reflected by positron emission tomography (PET) scan and bone marrow findings during their disease course.
Analysis of serum BCMA levels and MM patients’ response to treatment and clinical status
One hundred and sixty-four MM patients were grouped either based on the quality of response (Figure 5A) as complete response (CR) [n=23 (14%)]; partial response (PR) and minor response (MR) [n=46 (28%)]; or ND [n=95 (58%)], or by the IMWG-URC (Figure 5B) as CR [n=23 (14%)]; PR [n=33 (20%)]; less than PR [n=42 (26%)]; or PD [n=66 (40%)], and their sBCMA levels were compared. sBCMA levels showed a high correlation with these patients’ current clinical status.
Figure 5.
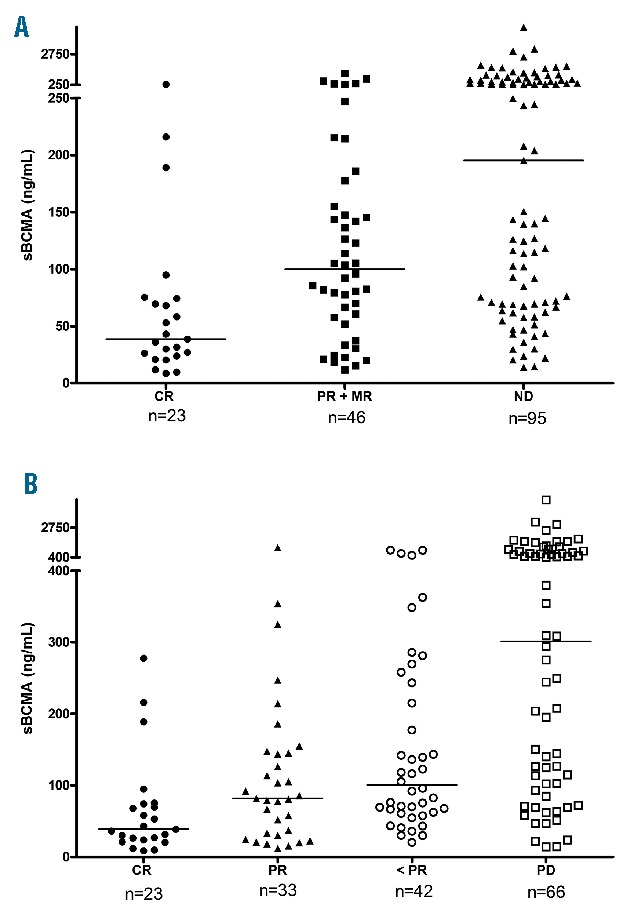
Analysis of serum B-cell maturation antigen (sBCMA) levels and multiple myeloma (MM) patients’ response to treatment and clinical status. sBCMA levels correlated with patients’ clinical status at the time of its determination. Specifically, (A) patients with complete response (CR) (●) had significantly lower sBCMA levels (median 38.6 ng/mL) than those with partial response (PR) or minor response (MR) (■) (median 99.7 ng/mL; P=0.0045) and non-responsive disease (ND) (▲), including those with either stable or progressive disease (PD) (median 195.3 ng/mL; P<0.0001). (B) Using International Myeloma Working Group (IMWG) criteria, patients with CR (●) had significantly lower sBCMA levels (median 38.6 ng/mL) than those with PR (▲; P=0.0374; median 81.7 mg/mL), less than PR (MR+SD; o; P=0.0002; median 100.6 mg/mL) and PD (□; P<0.0001; median 301.4 mg/mL). Total number of patients=164; *P versus CR.
Using the quality of response (Figure 5A), patients with CR had markedly lower sBCMA levels (median 38.9 ng/mL) than those with a response less than CR (PR or MR; median 99.7 ng/mL; P=0.0045) or ND (median 195.3 ng/mL; P<0.0001) (Figure 5A). Notably, the median sBCMA level among those patients in CR was similar to healthy subjects (median 36.8 ng/mL) (Figure 2).
When patients were grouped based on IMWG-URC (Figure 5B), sBCMA levels were significantly lower among patients in CR as compared to all other groups (CR vs. PR, P=0.0374; CR vs. less than PR, P=0.0002; CR vs. PD, P<0.0001). In addition, levels of sBCMA were significantly higher among PD patients as compared to all other groups (PD vs. PR, P<0.0001; PD vs. less than PR, P=0.0005).
Serum BCMA levels predict progression-free survival and overall survival
Figure 6A shows PFS for 184 MM patients whose sBCMA was determined just prior to the start of a new treatment regimen. PFS was longer (P=0.0006) for patients with sBCMA levels below the median (326.4 ng/mL) when compared with those with levels above the median (median 9.0 vs. 3.6 months) (Figure 6A, left). When comparing patients with sBCMA levels in the highest quartile (>971.0 ng/mL) to those with levels in the lower three quartiles, a marked difference in PFS was observed (P=0.0002; median 3.1 vs. 7.2 months) (Figure 6A, right). Prior to initiation of their first treatment (n=38) (Figure 6B) or a salvage therapy (n=146) (Figure 6C), the median PFS was longer among patients with sBCMA levels below the median (Figure 6B and C, left) or in the lowest three quartiles (Figure 6B and C, right). In the subgroup analysis of 99 MM patients who achieved MR or less, patients with baseline sBCMA levels above the median (261.7 ng/mL) or in the highest quartile (> 852.2 ng/mL) both achieved shorter PFS (Figure 6D).
Figure 6.

Correlation of serum B-cell maturation antigen (sBCMA) levels with progression-free survival (PFS) in multiple myeloma (MM) patients. MM patients were assessed according to their sBCMA levels being above or below the median level (left) or in the top quartile or bottom three quartiles (right). Kaplan-Meier analysis was performed to analyze PFS of 184 MM patients before start of a new treatment (A) with a baseline sBCMA level above or below the median level of 326.4 ng/mL (left) and for those with levels in the lowest three quartiles (range 14.3–970.9 ng/mL) or the highest quartile (≥ 971.0 ng/mL) (right). (B) Progression-free survival (PFS) of 38 MM patients before starting their front-line treatment according to whether their baseline sBCMA was above or below the median level of 430.5 ng/mL (left) and for those with levels in the lowest three quartiles (range 17.8–861.7 ng/mL) or highest quartile (≥ 861.8 ng/mL) (right). (C) PFS of 146 MM patients from time of starting a new salvage therapy according to whether their baseline sBCMA was above or below the median level of 281.9 ng/mL (left) and for those in the lowest three quartiles (range 14.3–962.3 ng/mL) or highest quartile (≥ 962.4 ng/mL) (right). (D) Among 99 MM patients who had a sBCMA determination just prior to starting a new treatment and achieved at least a minor response (MR), PFS was determined from the time of determination of their baseline sBCMA according to whether it was above or below a median of 261.7 ng/mL (left) and for those in the lowest three quartiles (range 17.8–852.1 ng/mL) or highest quartile (>852.2 ng/mL) (right).
Overall survival was longer among those with sBCMA levels below the median compared with those above (median 155 vs. 96 months; P=0.0108) (Figure 7A). Similarly, those in the lower three quartiles had a prolonged OS compared with those in the highest quartile (P=0.0075) (Figure 7B). To estimate the relative risk of an event and its 95% Confidence Interval, a proportional-hazard regression model was used. It showed that sBCMA levels significantly correlated with OS, whereas there was a lack of correlation with age, creatinine, hemoglobin, or ISS and/or stage (Online Supplementary Figure S3).
Figure 7.
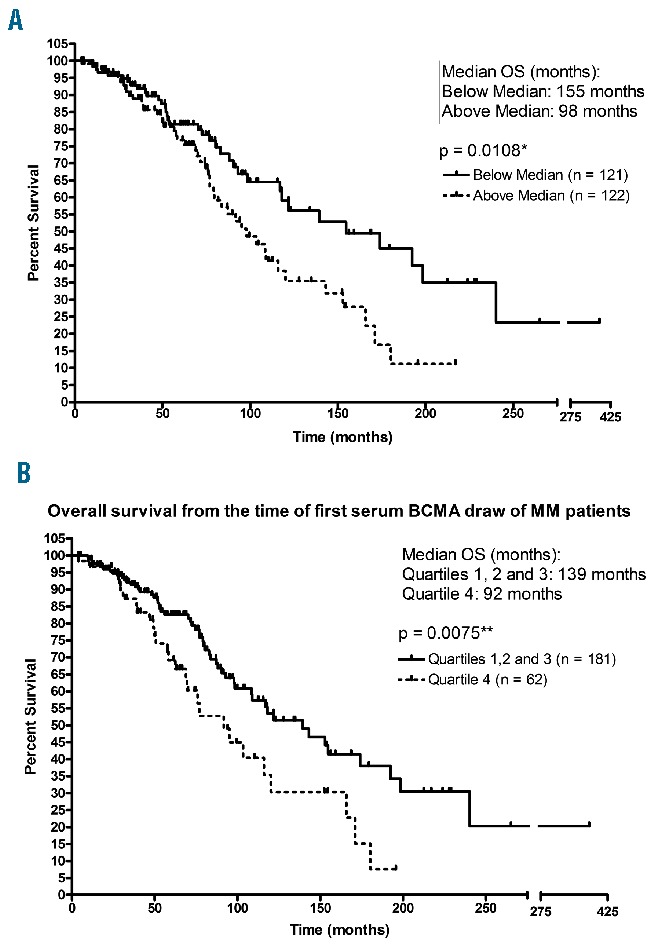
Correlation of serum B-cell maturation antigen (sBCMA) levels with overall survival (OS) in 243 multiple myeloma (MM) patients. MM patients were assessed according to their sBCMA levels being above or below the median (A), or in the highest quartile compared with the bottom three quartiles (B). Kaplan-Meier analysis showed that OS was longer among patients with BCMA below the median (136.2 ng/mL), and was shorter in the highest quartile (> 470.1 ng/mL) compared with the other three quartiles (range 14.4–470.0 ng/mL).
Serum BCMA levels are independent of other prognostic markers
Statistical comparison of sBCMA levels from MM patients with different clinical outcomes was performed to show that the serum levels of BCMA were specific to the clinical status of the response. The entire data set was grouped into different sub-cohorts based on the current clinical status. sBCMA level of patients in each group was compared using Dunnett’s test, where patients belonging to the CR group were used as the control group. As shown in Online Supplementary Figure S1, sBCMA levels of cohorts grouped under PD and untreated patients showed a significant difference (P<0.05) from the control group whereas other sub-cohorts such as MR or PR did not. This analysis demonstrated that sBCMA levels among patients with PD and untreated patients were significantly different and could be used as an indicator of the disease status.
The independence of sBCMA levels from other prognostic markers such as age, serum β2M, hemoglobin, and creatinine was investigated using multivariate analysis and a proportional hazards regression model. As shown in Online Supplementary Table S2 and Online Supplementary Figure S2, sBCMA levels were independent of other prognostic variables and did not display any substantial correlation with the other prognostic markers.
Lastly, the entire data set was grouped into two cohorts based on the presence of bone disease. The sBCMA level of patients with bone disease (group 1) was compared to those without bone disease (group 0), using Dunnett’s test. As shown in Online Supplementary Figure S3, sBCMA levels of group 1 did not show a difference from group 0 (P=0.45). This analysis demonstrated that sBCMA levels among patients with and without bone disease did not differ from one another; indicating that sBCMA levels are independent of an MM patient’s bone disease status.
Discussion
The results from this study demonstrate that the measurement of sBCMA levels provides important diagnostic, prognostic and monitoring information for patients with MM. sBCMA levels were highly correlated with the percentage of plasma cell infiltration in BM biopsies from MM patients. Next, we demonstrated that sBCMA levels were elevated among patients with MM compared with healthy individuals, and MM patients with smoldering disease showed lower sBCMA levels than those with active disease.
A strong correlation between patients’ current clinical status and sBCMA level was also identified. Specifically, patients who were in CR displayed lower sBCMA levels than those who were in MR or PR; those with ND had the highest levels. The ability of sBCMA to predict clinical outcomes, PFS and OS, was also examined. Patients with lower BCMA levels at the time of starting initial or a new salvage therapy were both found to have a much longer PFS. OS was also longer for patients with sBCMA levels below the median or in the lowest three quartiles. Our results indicate that sBCMA represents a novel prognostic marker capable of predicting current disease status, PFS and OS for MM patients.
To further evaluate sBCMA as an independent determinant of OS, we performed a multivariate analysis comparing sBCMA to other known prognostic factors linked to MM: age, β2M, hemoglobin, and creatinine. We also used a proportional-hazards regression model to examine the relative risk of events for each of these covariates. Notably, prognostic effect of sBCMA was found to be significant and independent of all tested covariates, including serum creatinine. Renal impairment commonly occurs in MM patients and remains a major disadvantage of utilizing renal dependent biomarkers such as serum β2M (as a prognostic indicator) and SFLC (as a laboratory test) to monitor disease.7,34 Similarly, the manifestations from bone involvement in MM patients can have negative clinical effects as well as shorten OS.46 In this study, we have demonstrated that sBCMA levels in MM patients were not influenced by patients’ bone disease status and, therefore, further validates its value as an MM-specific biomarker.
To demonstrate that sBCMA is predictive of treatment benefit and can be used to monitor patients’ disease status, its levels were monitored through the disease course of 44 MM patients. Using M-protein and involved SFLC levels as standard reference monitoring tests, we demonstrated that changes in these patients’ levels correlated with those observed in their M-protein and involved SFLC levels. In addition, sBCMA was also shown to effectively monitor MM patients with NSD. The monitoring of these patients has been problematic, relying on invasive and expensive procedures including frequent BM aspirates and biopsies and radiological evaluation with tests such as PET CT scans. The availability of a reliable serum test should help considerably in their care and importantly provide the opportunity for NSD patients to be able to enroll in clinical trials for which they have been previously excluded.
Although many other markers have been previously used to monitor these patients, sBCMA offers several potential advantages. Its rapid turnover in the blood (24–36 hours half life)45 compared to conventional Ig levels36,37 would potentially allow for early determination of changes in clinical status. Preliminary results from monitoring our patients suggest that this is the case (JR Berenson, 2017, unpublished observations). This should identify when a patient is not responding to their current therapy much quicker, allowing them to change to another therapy more rapidly. Another fortuitous byproduct of this would be to reduce a patient’s exposure to ineffective treatments and, as a result, prevent them from experiencing unnecessary side effects from their therapy. Moreover, although SFLC levels turn over rapidly, early data do not demonstrate consistent results with early evaluation for responses to new therapy. The variability of the results of this test, especially among patients with renal failure, makes this assay problematic for determining response status accurately.15,34 In addition, M-protein and SFLC levels cannot be used to follow disease progression for all MM patients, as some have, and others eventually develop NSD. Our results show that sBCMA can now be used to monitor these types of patients.
We have recently shown that circulating BCMA has other important roles. Specifically, the circulating protein has been implicated in the pathway that leads to immune deficiency in MM patients, a hallmark of the disease.45 The shed TNF receptor acts as a decoy receptor and binds B-cell ligands including BAFF preventing them from performing their normal function to stimulate late B-cell development and their production of normal antibodies. Many groups are developing antibodies to BCMA as a therapeutic approach to combat myeloma and other plasma cell malignancies.47,48 It will be interesting to see whether sBCMA levels will predict responsiveness to these targeted approaches. On the one hand, it may be possible that patients with high sBCMA will have more BCMA on their plasma cells making them better candidates for this targeted approach. Conversely, it is also possible that patients with high levels of circulating BCMA may derive less clinical benefit because these soluble proteins may bind to the targeted antibodies preventing them from attaching to their intended target, the malignant plasma cell.
Patients with other late B-cell malignancies also show elevated levels of circulating BCMA, including those with chronic lymphocytic leukemia (CLL), lymphoma and Waldenstrom macroglobulinemia.49,50 These levels were found to correlate with patients’ clinical status. In CLL patients, sBCMA correlates with standard prognostic factors including IgVH mutational status, ZAP-70 expression, chromosome 13 deletion, and white blood cell counts.50 sBCMA levels also can be used to monitor changes in CLL patients’ disease status and predict both their time to first treatment and OS.
We have identified a specific serum protein, BCMA, as a novel independent marker for both monitoring and predicting outcomes for MM patients. We have shown that sBCMA is elevated in MM patients, and can be used to follow their disease status, PFS and OS. It also provides, for the first time, a non-invasive blood test to monitor the disease of MM patients with NSD. Additional studies are warranted to further explore the role of sBCMA to predict outcomes for the plethora of new agents that are now being used to treat MM patients. Given that sBCMA helps orchestrate the immune deficient state in these patients,46 it will also be of interest to determine whether its levels predict responsiveness. It will also be of interest to see if it can be used to monitor patients undergoing the immune-based treatments that have recently become available and in clinical development, including research into BCMA itself.47,48
Supplementary Material
Acknowledgments
Dr. Berenson is a director, employee and shareholder in OncoTracker, Inc. a company that is involved in the development of BCMA as a marker. Haiming Chen, Eric Sanchez, Mingjie Li, and Cathy Wang are shareholders in OncoTracker, Inc.
Footnotes
Check the online version for the most updated information on this article, online supplements, and information on authorship & disclosures: www.haematologica.org/content/102/4/785
References
- 1.Smith ML, Newland AC. Treatment of myeloma. QJM. 1999;92(1):11–16. [DOI] [PubMed] [Google Scholar]
- 2.Morgan GJ. Advances in the biology and treatment of myeloma. Br J Haematol. 1999;105(Suppl 1):4–6. [PubMed] [Google Scholar]
- 3.Kastrinakis NG, Gorgoulis VG, Foukas PG, et al. Molecular aspects of multiple myeloma. Ann Oncol. 2000;11(10):1217–1228. [DOI] [PubMed] [Google Scholar]
- 4.Kumar SK, Rajkumar SV, Dispenzieri A, et al. Improved survival in multiple myeloma and the impact of novel therapies. Blood. 2008;111(5):2516–2520. [DOI] [PMC free article] [PubMed] [Google Scholar]
- 5.van de Donk NW, Moreau P, Plesner T, et al. Clinical efficacy and management of monoclonal antibodies targeting CD38 and SLAMF7 in multiple myeloma. Blood. 2016;127(6):681–695. [DOI] [PubMed] [Google Scholar]
- 6.Durie BG. Staging and kinetics of multiple myeloma. Semin Oncol. 1986;13(3):300–309. [PubMed] [Google Scholar]
- 7.Durie BG, Harousseau JL, Miguel JS, et al. International uniform response criteria for multiple myeloma. Leukemia. 2006;20(9): 1467–1473. [DOI] [PubMed] [Google Scholar]
- 8.Kleber M, Ihorst G, Deschler B, et al. Detection of renal impairment as one specific comorbidity factor in multiple myeloma: multicenter study in 198 consecutive patients. Eur J Haematol. 2009;83(6):519–527. [DOI] [PubMed] [Google Scholar]
- 9.Mittelman M. The implications of anemia in multiple myeloma. Clin Lymphoma. 2003;4(Suppl 1):S23–29. [DOI] [PubMed] [Google Scholar]
- 10.Bataille R, Boccadoro M, Klein B, et al. C-reactive protein and beta-2 microglobulin produce a simple and powerful myeloma staging system. Blood. 1992;80(3):733–737. [PubMed] [Google Scholar]
- 11.Turesson I, Abildgaard N, Ahlgren T, et al. Prognostic evaluation in multiple myeloma: an analysis of the impact of new prognostic factors. Br J Haematol. 1999; 106(4):1005–1012. [DOI] [PubMed] [Google Scholar]
- 12.Cuzick J, Cooper EH, MacLennan IC. The prognostic value of serum beta 2 microglobulin compared with other presentation features in myelomatosis. Br J Cancer. 1985;52(1):1–6. [DOI] [PMC free article] [PubMed] [Google Scholar]
- 13.Merlini G, Waldenström JG, Jayakar SD. A new improved clinical staging system for multiple myeloma based on analysis of 123 treated patients. Blood. 1980;55(6):1011–1019. [PubMed] [Google Scholar]
- 14.Kyle RA, Gertz MA, Witzig TE, et al. Review of 1027 patients with newly diagnosed multiple myeloma. Mayo Clin Proc. 2003;78:21–33. [DOI] [PubMed] [Google Scholar]
- 15.Jacobs JF, Tate JR, Merlini G. Is accuracy of serum free light chain measurement acheiveable¿ Clin Chem Lab Med. 2016; 54(6):1021–1030. [DOI] [PubMed] [Google Scholar]
- 16.Greipp PR, San Miguel J, Durie BG, et al. International staging system for multiple myeloma. J Clin Oncol. 2005;23(15):3412–3420. [DOI] [PubMed] [Google Scholar]
- 17.Bataille R, Annweiler C, Beauchet O. Multiple Myeloma International Staging System “Staging” or Simply “Aging” system¿ Clin Lymphoma Myeloma Leuk. 2013;13(6):635–637. [DOI] [PubMed] [Google Scholar]
- 18.Maltezas D, Dimopoulos MA, Katodritou I, et al. Re-evaluation of prognostic markers including staging, serum free light chains or their ratio and serum lactate dehydrogenase in multiple myeloma patients receiving novel agents. Hematol Oncol. 2013; 31(2):96–102. [DOI] [PubMed] [Google Scholar]
- 19.Majithia N, Rajkumar VS, Lacy MQ, et al. Outcomes of primary refractory multiple myeloma and the impact of novel therapies. Am J Hematol. 2015;90(11):981–985. [DOI] [PMC free article] [PubMed] [Google Scholar]
- 20.Berenson A, Vardanyan S, David M, et al. Improved Clinical Outcomes for Multiple Myeloma Patients Treated at a Single Specialty Clinic. Ann Hematol. 2016. December 2 [Epub ahead of print] [DOI] [PubMed] [Google Scholar]
- 21.Arques S, Ambrosi P. Human serum albumin in the clinical syndrome of heart failure. J Card Fail. 2011;17(6):451–458. [DOI] [PubMed] [Google Scholar]
- 22.Greipp PR, Leong T, Bennett JM, et al. Plasmablastic morphology-an independent prognostic factor with clinical and laboratory correlates: Eastern Cooperative Oncology Group (ECOG) myeloma trial E9486 report by the ECOG Myeloma Laboratory Group. Blood. 1998; 91(7):2501–2507. [PubMed] [Google Scholar]
- 23.Rajkumar SV, Greipp PR. Prognostic factors in multiple myeloma. Hematol Oncol Clin North Am. 1999;13(3):1295–1314. [DOI] [PubMed] [Google Scholar]
- 24.Avet-Loiseau H, Andree-Ashley LE, Moore D, et al. Molecular cytogenetic abnormalities in multiple myeloma and plasma cell leukemia measured using comparative genomic hybridization. Genes Chromosomes Cancer. 1997;19(2):124–133. [DOI] [PubMed] [Google Scholar]
- 25.Dewald GW, Kyle RA, Hicks GA, et al. The clinical significance of cytogenetic studies in 100 patients with multiple myeloma, plasma cell leukemia, or amyloidosis. Blood. 1985;66(2):380–390. [PubMed] [Google Scholar]
- 26.Broyl A, Hose D, Lokhorst H, et al. Gene expression profiling for molecular classification of multiple myeloma in newly diagnosed patients. Blood. 2010;116(14):2543–2553. [DOI] [PubMed] [Google Scholar]
- 27.Rajan AM, Rajkumar SV. Interpretation of cytogenetic results in multipe myeloma for clinical practice. Blood Cancer J. 2015;5:e365. [DOI] [PMC free article] [PubMed] [Google Scholar]
- 28.Wierzbowska A, Urbanska-Rys H, Robak T. Circulating IL-6-type cytokines and sIL-6R in patients with multiple myeloma. Br J Haematol. 1999;105(2):412–419. [PubMed] [Google Scholar]
- 29.Lauta VM. Interleukin-6 and the network of several cytokines in multiple myeloma: an overview of clinical and experimental data. Cytokine. 2001;16(3):79–86. [DOI] [PubMed] [Google Scholar]
- 30.Lovell R, Dunn JA, Begum G, et al. Soluble syndecan-1 level at diagnosis is an independent prognostic factor in multiple myeloma and the extent of fall from diagnosis to plateau predicts for overall survival. Br J Haematol. 2005;130(4):542–548. [DOI] [PubMed] [Google Scholar]
- 31.Brunetti G, Oranger A, Mori G, et al. Sclerostin is overexpressed by plasma cells from multiple myeloma patients. Ann NY Acad Sci. 2011;1237:19–23. [DOI] [PubMed] [Google Scholar]
- 32.Delgado-Calle J, Bellido T, Roodman GD. Role of osteocytes in multiple myeloma bone disease. Curr Opin Support Palliat Care. 2014;8(4):407–413. [DOI] [PMC free article] [PubMed] [Google Scholar]
- 33.Kim JM, Lee JA, Cho IS, et al. Soluble syndecan-1 at diagnosis and during follow up of multiple myeloma: a single institution study. Korean J Hematol. 2010;45(2):115–119. [DOI] [PMC free article] [PubMed] [Google Scholar]
- 34.Katzmann JA, Dispenzieri A, Kyle RA, et al. Elimination of the need for urine studies in the screening algorithm for monoclonal gammopathies by using serum immunofixation and free light chain assays. Mayo Clin Proc. 2006;81:1575–1578. [DOI] [PubMed] [Google Scholar]
- 35.Harutyunyan NM, Vardanyan S, Ghermezi M, et al. Levels of uninvolved immunoglobulins predict clinical status and progression free survival for multiple myeloma patients. Br J Haematol. 2016; 174(1):81–87. [DOI] [PubMed] [Google Scholar]
- 36.Waldmann TA, Strober W. Metabolism of immunoglobulins. Prog Allergy. 1969; 13(1):1–110. [DOI] [PubMed] [Google Scholar]
- 37.Mariani G, Strober W. Immunoglobulin metabolism. In: Metzger H. (ed.). Fc receptors and the action of antibodies. Am Soc Microbiol 1990;94–177. [Google Scholar]
- 38.Hansen CT, Pedersen PT, Nielsen LC, et al. Evaluation of the serum free light chain (sFLC) analysis in prediction of response in symptomatic multiple myeloma patients: rapid profound reduction in involved FLC predicts achievement of VGPR. Eur J Haematol. 2014;93(5):407–413. [DOI] [PubMed] [Google Scholar]
- 39.Dreicer R, Alexanian R. Non-secretory multiple myeloma. Am J Hematol. 1982;13(4): 313–318. [DOI] [PubMed] [Google Scholar]
- 40.Lonial S, Kaufman JL. Non-secretory myeloma: a clinician’s guide. Oncology (Williston Park). 2013;27:924–928. [PubMed] [Google Scholar]
- 41.Laabi Y, Gras MP, Brouet JC, et al. The BCMA gene, preferentially expressed during lymphoid maturation, is bidirectionally transcribed. Nucleic Acids Res. 1994; 22(7):1147–1154. [DOI] [PMC free article] [PubMed] [Google Scholar]
- 42.Novak AJ, Darce JR, Arendt BK, et al. Expression of BCMA, TACI, and BAFF-R in multiple myeloma: a mechanism for growth and survival. Blood. 2004; 103(2):689–694. [DOI] [PubMed] [Google Scholar]
- 43.Tai YT, Li XF, Breitkreutz I, et al. Role of B-cell-activating factor in adhesion and growth of human multiple myeloma cells in the bone marrow microenvironment. Cancer Res. 2006;66(13):6675–6682. [DOI] [PubMed] [Google Scholar]
- 44.Sanchez E, Li M, Kitto A, et al. Serum B-cell maturation antigen is elevated in multiple myeloma and correlates with disease status and survival. Br J Haematol. 2012; 158(6):727–738. [DOI] [PubMed] [Google Scholar]
- 45.Sanchez E, Gillespie A, Tang G, et al. Soluble B-cell maturation antigen mediates tumor induced immune deficiency in multiple myeloma. Clin Cancer Res. 2016; 22(13): 3383–3397. [DOI] [PubMed] [Google Scholar]
- 46.Melton LJ, Kyle RA, Achenbach SJ, et al. Fracture risk with multiple myeloma: a population-based study. J Bone Miner Res. 2005;20(3):487–493. [DOI] [PubMed] [Google Scholar]
- 47.Ryan MC, Hering M, Peckham D, et al. Antibody targeting of B-cell maturation antigen on malignant plasma cells. Mol Cancer Ther. 2007;6(11):3009 3018. [DOI] [PubMed] [Google Scholar]
- 48.Tai YT, Mayes PA, Acharya C, et al. Novel anti-B-cell maturation antigen antibody-drug conjugate (GSK2857916) selectively induces killing of multiple myeloma. Blood. 2014;123(20):3128–3138. [DOI] [PMC free article] [PubMed] [Google Scholar]
- 49.Vardanyan S, Meid K, Udd KA, et al. Serum levels of B-cell maturation antigen are elevated in Waldenstrom’s macroglobulinemia patients and correlate with disease status and conventional M-protein and IgM levels. Blood. 2015;126:(Abstract 1778). [Google Scholar]
- 50.Udd KA, Rassenti LZ, David ME, et al. Plasma B-cell maturation antigen levels are elevated and correlate with disease activity in patients with chronic lymphocytic leukemia. Blood. 2015;126: (Abstract 2931). [DOI] [PubMed] [Google Scholar]
Associated Data
This section collects any data citations, data availability statements, or supplementary materials included in this article.