Abstract
Cannabinoid receptor 2 (CB2), a G protein-coupled receptor (GPCR), is a promising target for the treatment of neuropathic pain, osteoporosis, immune system, cancer, and drug abuse. The lack of an experimental three-dimensional CB2 structure has hindered not only the development of studies of conformational differences between the inactive and active CB2 but also the rational discovery of novel functional compounds targeting CB2. In this work, we constructed models of both inactive and active CB2 by homology modeling. Then we conducted two comparative 100 ns molecular dynamics (MD) simulations on the two systems—the active CB2 bound with both the agonist and G protein and the inactive CB2 bound with inverse agonist—to analyze the conformational difference of CB2 proteins and the key residues involved in molecular recognition. Our results showed that the inactive CB2 and the inverse agonist remained stable during the MD simulation. However, during the MD simulations, we observed dynamical details about the breakdown of the “ionic lock” between R1313.50 and D2406.30 as well as the outward/inward movements of transmembrane domains of the active CB2 that bind with G proteins and agonist (TM5, TM6, and TM7). All of these results are congruent with the experimental data and recent reports. Moreover, our results indicate that W2586.48 in TM6 and residues in TM4 (V1644.56–L1694.61) contribute greatly to the binding of the agonist on the basis of the binding energy decomposition, while residues S180–F183 in extracellular loop 2 (ECL2) may be of importance in recognition of the inverse agonist. Furthermore, pharmacophore modeling and virtual screening were carried out for the inactive and active CB2 models in parallel. Among all 10 hits, two compounds exhibited novel scaffolds and can be used as novel chemical probes for future studies of CB2. Importantly, our studies show that the hits obtained from the inactive CB2 model mainly act as inverse agonist(s) or neutral antagonist(s) at low concentration. Moreover, the hit from the active CB2 model also behaves as a neutral antagonist at low concentration. Our studies provide new insight leading to a better understanding of the structural and conformational differences between two states of CB2 and illuminate the effects of structure on virtual screening and drug design.
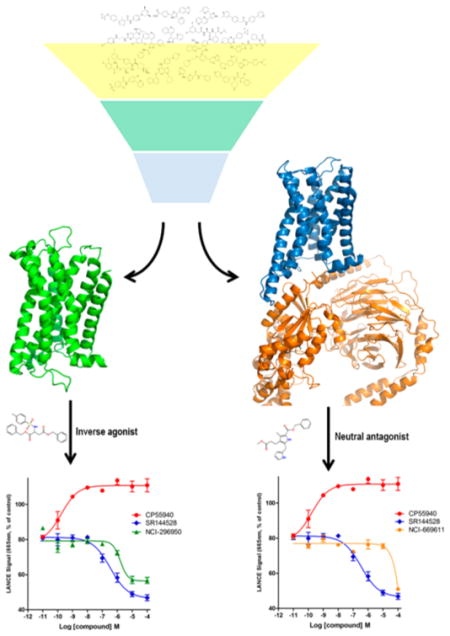
Graphical Abstract
INTRODUCTION
Seven transmembrane domain G protein-coupled receptors (GPCRs), which are important molecular sensors in various vital physiological processes throughout the body, constitute the largest family of protein targets engaged in drug discovery. An increasing number of solved cocrystal structures of GPCRs have emerged to illustrate the structural basis of biochemical functions of the superfamily and assist the discovery of novel therapeutic drugs.1
For each GPCR, there is a distinctive orthosteric binding site for its endogenous ligands.2 This binding site can be bound with orthosteric ligands (either native or synthetic ligands),3 including agonists (full/partial), neutral antagonists, and inverse agonists. An agonist can bind to and activate the receptor, producing a biological response. An inverse agonist also can bind to the same pocket as an agonist, but it can induce an opposite pharmacological response as an agonist. A neutral antagonist has no activity in the absence of an inverse agonist or agonist but can block the action of either an agonist or an inverse agonist.
Two GPCRs, the principal cannabinoid (CB) receptors CB1 and CB2, are critical components of the endogenous CB (endocannabinoid) signaling system, which is involved in a variety of physiological processes, including appetite, pain sensation, mood, and memory.4 The CB1 and CB2 receptors are both coupled through Gi/o proteins, negatively to adenylate cyclase and positively to mitogen-active protein kinase. CB1 receptors, expressed most densely in some brain regions, are supposed to mediate several psychoactive effects of ligands, while CB2 receptors, mainly distributed in immune cells and neurons, play roles in cytokine release modulation.5 Recently, Xi’s group reported that the CB2 receptor can modulate midbrain dopamine neuronal activity and dopamine-related behavior in mice, indicating that CB2 is a promising target for the treatment of drug abuse.6
There are few experimental data about the structures of CB1 and CB2, mainly because of the inherent difficulties in isolating sufficient purified protein for the requirement of quality analysis by X-ray crystallography and NMR spectroscopy.7 The absence of crystal structures of protein–ligand complexes makes computer-aided homology modeling together with site-directed mutagenesis studies increasingly important for facilitating the discovery and development of new ligands for cannabinoid receptors. Several three-dimensional (3D) crystal structures of GPCRs have been used by different groups to construct CB receptor homology models, including rhodopsin, A2AAR, and β2AR.8,9 The first 3D CB2 homology model was reported in 1999 by Reggio and co-workers10 for the inactive CB2 model, based on the CB2 sequence α-helical periodicity detected by Fourier transform analysis. Gouldson et al.11 generated a CB2 model based on a previous rat β2AR model, in which a docking position in their model resembled the results in the mutagenesis studies. Xie and co-workers12–14 constructed a comparative 3D CB2 model in 2003 based on the first class-A GPCR crystal structure, for bovine rhodopsin.15 In 2006, other CB2 comparative models based on rhodopsin were clarified by Tuccinardi et al.,16 Stern et al.,17 and Raduner et al.18 Our previous work13 showed that the CB2 model constructed from β1AR/β2AR/D3R afforded better predictions for prescreening than the models built from seven other GPCR crystal structures, involving SMO, bovine rhodopsin, CXCR4, M2MAR, A2AAR, H1R, and S1P. Therefore, in the present work, we used the inactive CB2 model that was constructed according to β2AR. However, most of the currently reported CB2 models are actually the inactive CB2 model as built on the reported inactive GPCRs.
It has been reported19,20 that there are multiple states of GPCRs, including inactive, intermediate, and active states. The inactive and active states are more stable during the protein dynamics in the function of GPCRs. However, the intermediate state of a GPCR is maintained for a short time and accounts for a small proportion of the entire structural ensemble. In order to effectively compare with the previous abundant experimental and modeling data, here we mainly focused on two stable states, namely, the active and inactive states of CB2. Switching between the two states results in a sequenced physiological or pharmacological process through binding with agonists and the G protein partners sequentially. Many groups have tried to elucidate the differences between GPCRs in different states using computational methods combined with bioassays. Bhattacharya et al.21 studied the inactive state of GPCR and the ligand-stabilized β2-adrenergic receptor (β2AR) conformations in the presence of five different agonists with varied efficacy. They found that the binding sites in the inactive and active models were very similar to each other but that the residues had some slight differences that triggered the outward movement of the intracellular ends of TM5 and TM6, inducing a large conformational change in the cytoplasmic interfaces, which was implicated with the G protein activation. Daga and Zaveri22 conducted a molecular dynamics (MD) simulation of the active-state nociceptin receptor (NOP) model and the inactive-state model in comparison. Their results indicated that NOP activation involves some activation microswitches at the intracellular ends of TM3 and TM6, which was also reported in Bhattacharya’s results. Recently, Mnpotra et al.23 studied the structural basis of cannabinoid CB2 coupled with Gi protein. Their CB2–G protein model was constructed according to the β2AR–G protein template (PDB entry 3SN6).24 They showed that the second intracellular loop of CB2 plays a key role in the formation of the Gi complex, which was supported by their mutation data. In the present work, we adapted the reported templates and protocols that were used by Mnpotra et al.23 to construct the active CB2 model.
In the present work, we systematically analyzed the structural and conformational differences between CB2 in two states and illuminated the effects of structure on virtual screening and drug design. To do this, we built models of the inactive and active states of CB2. MD simulations carried out for these two models showed no significant change in the ligand binding sites but did reveal several conformational switches, including outward movement of the intracellular ends of transmembrane loops, which are closely related to the G protein activation. We also performed virtual screening by using these two CB2 models. Our results showed that both of these CB2 models could yield hits. However, the hits from the inactive CB2 model acted as inverse agonist or neutral antagonist, while the hits obtained from the active CB2 model behaved as neutral antagonist.
MATERIALS AND METHODS
Homology Modeling and Structure Validation of CB2
In the present work, we built two conformations of CB2, one for the inactive state and one for the active state. The inactive conformation of CB213 was constructed according to the crystal structure of inactive β2AR bound with the partial inverse agonist carazolol (PDB entry 2RH1, resolution 2.40 Å).25 To represent the CB2 active state, we built a CB2 model based on X-ray crystal structures of β2AR bound with both agonists and G proteins (PDB entry 3SN6, resolution 3.20 Å).24 Moreover, the crystal structure of Gαi1β1γ2 (PDB entry 1GP2, resolution 2.30 Å)26 was used to construct the complex of active-state CB2 and Gαi1β1γ2. All of the crystal structures were downloaded from the Protein Data Bank (http://www.pdb.org/pdb/). SYBYL-X 1.327 was used to repair all of the residues and minimize the energy.
The full sequence of the human CB2 receptor (CNR2_HUMAN or P34972, 360 residues) and the full sequence of guanine nucleotide-binding protein G (i) subunit α-1 (Gαi1 or P10824, 354 residues) were retrieved from UniProtKB/Swiss-Prot (http://www.uniprot.org/uniprot/). In the present work, we truncated the residues of CB2 before A351.34 at the N terminus as well as the residues after H3127.66 at the C terminus. The sequence alignments and homology modeling were based on this generated sequence of CB2 using our reported protocol.14 The disulfide bridge between C1744.66 and C1794.71 in ECL211 was also patched for both the inactive and active models of CB2. For the crystal structure of Gαi1, both the extreme C-terminus (residues 1–4, MGCT) and N-terminus (residues 349–354, KDCGLF) were unresolved. However, we built the full sequence of Gαi1 in this work.
MODELLER 9.1228 was used to construct both the structure of CB2 and the whole sequence of Gαi1. The detailed parameters can be found in our previous publications.3,12–14,29
Once the 3D models were generated, SYBYL-X 1.3 was used to perform the energy minimizations.3,12–14,29 Then proSA-web Z-scores30 and PROCHECK Ramachandran plots31 were used for validation of all of the models.
Construction of the CB2–G Protein–GDP Complex
The relative orientations of active CB2 and Gαi1β1γ2 were based on the crystal structure of β2AR bound with Gαsβ1γ2. Superimposition and adjustment were applied to obtain an accurate complex. Briefly, CB2 was superimposed onto the α-carbon (Cα) atoms of β2AR (especially for N1.50, D2.50, R3.50, W4.50, and W6.48), while Gαi1β1γ2 was superimposed onto Gαsβ1γ2. In order to relieve steric clashes between CB2 and Gαi1β1γ2, we translated Gαi1β1γ2 along the z direction.23 The detailed interactions between G proteins and GDP were revealed in the work of Wall et al.26
Data Set of Agonists and Inverse Agonists for CB2
A set of 879 chemical structures and their bioactivities (IC50 or EC50 values) for CB2 were retrieved from ChEMBL (https://www.ebi.ac.uk/chembl/). We chose 833 CB2 agonists (EC50 for CB2 < 2 μM) and 46 inverse agonists (IC50 for CB2 < 8 μ M) for our studies.
Docking of Ligands into the CB2 Receptor or CB2–G Protein Complex
The docking program Surflex-Dock GeomX (SFXC) in SYBYL-X 1.3 was applied to construct3,12–14,29 the complex between the receptor and ligand, in which the total score was expressed as −log10(Kd).32 We used the MOLCAD module implemented in SYBYL-X 1.3 to explore the potential binding pocket for CB2. The main protocols and parameters of docking were displayed in our previous publications.
Molecular Dynamics Simulations in a Lipid–Water Box
We carried out an MD simulation of the active CB2 bound with both the agonist and G protein. For comparison, we also performed a MD simulation of the inactive conformation of CB2 bound with the inverse agonist SR144528.
Special caution was applied to histidine (H) residues, which can be ionized at pH 7.40. We used VEGA ZZ 2.4.033 and PROPKA 3.134 software for the prediction of the pK values for the protein. For the CB2 models, none of the His were protonated, since the calculated pK values were lower than 7.40 (from 4.0 to 7.0). The side chains of Asp, Glu, Arg, and Lys were charged (Asp−, Glu−, Arg+, and Lys+) in all of the simulations.
The VMD program35 was applied to embed the structure of the receptor bound with ligands into a pre-equilibrated and periodic structure of 1-palmitoyl-2-oleoyl-sn-glycero-3-phosphatidylcholine (POPC). We eliminated the lipid molecules within 3 Å of the protein. Then we inserted it into a water box with TIP3P36 water molecules and eliminated the water within 3 Å of the protein.
The simulation boxes for CB2–SR144528 and CB2–WIN55212-2–G protein–GDP contained the CB2 model and 167 or 339 lipid molecules, 13 441 or 47 478 water molecules, 0 or 5 sodium ions, and 11 or 0 chloride ions, for a total of 67 165 or 203 973 atoms, respectively, per periodic cell. The box sizes were 94 Å × 94 Å × 88 Å and 117 Å × 112 Å × 148 Å, respectively. The first minimization with 100 000 steps was performed with the protein fixed, while the second minimization, also with 100 000 steps, was carried out with flexible protein. Then 1.0 ns of MD for heating from 0 to 300 K and equilibration was performed.
Starting from the last frame of the equilibration, 100 ns MD simulations were carried out. The NAMD package37 (version 2.9b1) with the AMBER38–40 force field was applied in all of the MD simulations. The particle mesh Ewald41 method with a 12 Å nonbonded cutoff and a grid spacing of 1 Å per grid point in each dimension was used to calculate the electrostatics. A smooth cutoff (switching radius 10 Å, cutoff radius 12 Å) was used to calculate the van der Waals energies. The temperature and pressure were kept constant using a Langevin thermostat (300 K) and a Langevin barostat (1 atm), respectively. The time step was set to 1 fs. The data were saved every 10 ps for analysis. AMBER tools and VMD software were applied to analyze all of the trajectories.
Molecular Mechanics/Generalized Born Surface Area (MM/GBSA) Calculations
The MM/GBSA method42 was used to calculate the binding energies of the CB2 receptors in the inactive and active states under treatment with the inverse agonist SR144528 and the agonist WIN55,212-2, respectively. It was also applied to assess the G protein coupling energies of the active CB2 with G proteins and of the G proteins with GDP. In order to calculate the mean binding energy, 100 snapshots were extracted from the trajectory every 400 ps from 60 to 100 ns. The following formula was used:
where ΔEbind is the binding energy and ΔEMM denotes the sum of molecular mechanical energies in vacuo, which can be further divided into contributions from electrostatic, van der Waals, and internal energies. This term could be computed through molecular mechanics method. ΔESOL is the solvation energy, which includes the polar solvation energy (ΔEGB) calculated with the Generalized Born (GB) approximation model43,44 and the nonpolar part (ΔESA) obtained by fitting the solvent-accessible surface area (SASA)45 with the LCPO model.46,47 Additionally, the energies of each residue were decomposed into energies of backbone and side-chain atoms. Through energy decomposition, we can analyze the contributions of the key residues to the binding.
Pharmacophoric Filtering and Virtual Screening Using the Inactive and Active CB2 Models
The GALAHAD program in SYBYL was used to construct five-point pharmacophore models for WIN55,212-2 (agonist) and SR144528 (inverse agonist). These two pharmacophore models were used to filter the National Cancer Institute chemical library (NCI2011, 210 000 compounds) to yield two compound libraries that satisfied the corresponding geometric or physicochemical constraints. The parameters used for the generation of the pharmacophore models and UNITY search in SYBYL were described in our previous publication.3 After filtering the NCI database, we performed virtual-docking screening against the corresponding optimized 3D chemical compound library using either the inactive or active CB2 model, respectively (thus, we had two sets of hits). The detailed docking parameters can be found in our previous publications.3,13,14
Validation by Radioligand Competition Binding Assay
The CB ligand competition binding assay was carried out as described previously.48,49 Briefly, nonradioactive ligands were diluted in binding buffer supplemented with 10% dimethyl sulfoxide and 0.4% methylcellulose. Each assay-plate well contained a total of 200 μL of reaction mixture comprising 5 μg of CB1 or CB2 membrane protein, labeled [3H]CP-55,940 ligand at a final concentration of 3 nM, and the unlabeled ligand at its varying dilutions as stated above. Plates were incubated at 30 °C for 1 h with gentle shaking. The reaction was terminated by rapid filtration through Unifilter GF/B filter plates using a Unifilter cell harvester (PerkinElmer). After the plate was allowed to dry overnight, 30 μL of MicroScint-0 cocktail (PerkinElmer) was added to each well, and the radioactivity was counted using a PerkinElmer TopCounter. All of the assays were performed in duplicate, and data points are presented as mean ± standard error of the mean (SEM). The bound radioactivity data were analyzed for Ki values by nonlinear regression analysis using GraphPad Prism 5.0 software. The saturation binding of [3H]CP-55,940 to the membrane proteins was performed as described previously.49,50 Briefly, the CB1 or CB2 membrane fractions (5 μg) were incubated with increasing concentrations of [3H]CP-55,940 (0.05–4 nM) in 96-well plates at 30 °C with slow shaking for 1 h. The incubation buffer was composed of 50 mM Tris-HCl (pH 7.4), 5 mM MgCl2, 2.5 mM EGTA, and 0.1% (w/v) fatty-acid-free bovine serum albumin (BSA). The ligand was diluted in incubation buffer supplemented with 10% dimethyl sulfoxide and 0.4% methylcellulose. Nonspecific binding was determined in the presence of unlabeled CP-55,940 (5000 nM). The reaction was terminated and the radioactivity counted as stated above. Nonlinear regression analysis revealed the receptor density (Bmax) and the equilibrium dissociation constant (Kd) values of [3H]CP-55,940 for the CB2 receptor.
Validation by cAMP Assay
Cellular cAMP levels were measured according to a reported method with modifications using LANCE cAMP 384 kits (PerkinElmer).50,51 The assay is based on competition between a europium-labeled cAMP trace complex and total cAMP for binding sites on cAMP-specific antibodies labeled with a fluorescent dye. CB2 receptor wild-type (WT) transfected Chinese hamster ovary (CHO) cells were seeded in 384-well white ProxiPlates with a density of 2000 cells/well in 5 μL of RPMI-1640 medium containing 1% dialyzed fetal bovine serum, 25 mM HEPES, 100 μg/mL penicillin, 100 units/mL strepmicin and 200 μg/mL G-418. After culture overnight, 2.5 μL of cAMP antibody and RO20-1724 (final concentration 50 μM) in stimulation buffer (1× DPBS containing 0.1% BSA) was added to each well, followed by the addition of either 2.5 μL of compound or forskolin (final 5 μM) for the agonist-inhibited adenylate cyclase activity assay. After incubation at room temperature for 45 min, 10 μL of detection reagent was added into each well. The plate was then incubated for 1 h at room temperature and measured in a Synergy H1 hybrid reader (BioTek) with excitation at 340 nm and emission at 665 nm. Each cAMP determination was made via at least two independent experiments, each in triplicate. EC50 values were determined by nonlinear regression of dose–response curves using GraphPad Prism 5.
RESULTS AND DISCUSSION
CB2 Ligand Data Set for Validating the 3D CB2 Models
Ten inactive and 10 active CB2 models were obtained from homology modeling. Once the 3D models were generated, energy minimizations were carried out using SYBYL-X 1.3. The CB2 models were also validated using proSA-web Z-scores30 and PROCHECK Ramachandran plots.31 The best three inactive CB2 and the best three active CB2 conformations were used to perform the prescreen against the data set of 879 CB2 compounds. These compounds were retrieved from ChEMBL (https://www.ebi.ac.uk/chembl/). Among them, 833 were CB2 agonists (EC50 for CB2 < 2 μ M), and 46 were inverse agonists (IC50 for CB2 < 8 μM).
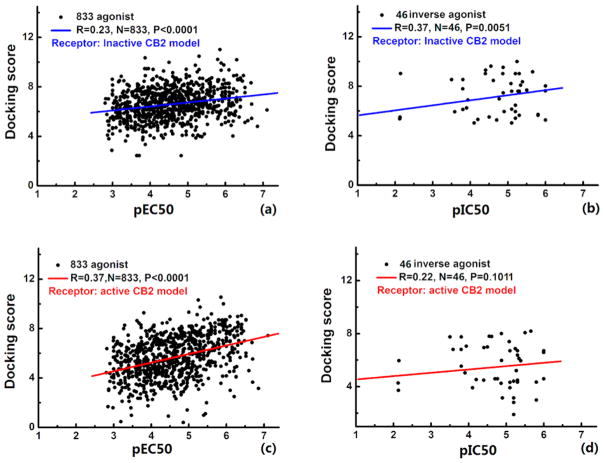
In order to test the rationality of the active and inactive CB2 models generated from homology modeling, we carried out a prescreen of three inactive and three active CB2 models against a data set that included agonists (833 samples with EC50 values of 0.14–1580 nM) and inverse agonists (46 samples with IC50 values of 0.078–7550 nM). Figure 1 shows the best correlations between the docking scores and the corresponding pEC50 and pIC50 values of the agonists and inverse agonists within the inactive and active CB2 models, respectively. The correlations of the other two inactive and active CB2 models can be found in Figure S1 in the Supporting Information. In terms of the best inactive CB2 model, the docking score ranges of agonists and inverse agonists were from 2.435 to 11.017 and from 4.787 to 10.001, respectively, while for the best active CB2 model, the ranges of docking scores for agonists and inverse agonists were 0.398–10.541 and 1.904–8.188, respectively. We found that the docking scores of ligands in Figure 1 showed a poor correlation with the experimental data of pEC50 for agonists and pIC50 for inverse agonists. Part of this poor correlation may be a result of the fact that the docking scores of ligands cannot accurately reflect their activity data, and the docking score should not be regarded as the criterion for determining whether a ligand is an agonist or inverse agonist. This finding was also supported by the poor correlation (0.27) between the docking scores and Ki values of our 10 hits discussed below. Moreover, after examining the models, we found that few residues involved in the potential binding pocket were in the unfavored region. For example, Leu182 in the inactive model and Phe281 in the active one pointed to the binding pocket and lowered the docking scores (steric restraint). These reasons may lead to the poor relationship between the docking scores and the activity data.
Figure 1.
Validation of the active and inactive CB2 models: (a, b) correlations between the calculated docking scores of the inactive CB2 model binding with (a) agonists and (b) inverse agonists and the experimental pEC50 and pIC50 values, respectively; (c, d) the same correlations for the active CB2 model.
Convergence Parameters of MD
In order to validate the homology model, the binding poses of agonists and inverse agonists, and the interactions as well as conformational changes of CB2 with and without G protein, we carried out two comparative 100 ns MD simulations for these two CB2 systems, respectively.
Figure S2a,b shows the overall parameters of MD for the inactive CB2 system. This system reached equilibrium after 5 ns with an average root-mean-square deviation (RMSD) of 3.9 Å. Notably, the radius of gyration of the inactive CB2 model remained stable at ~20.6 Å during the MD simulation. For the active CB2 model bound with G protein, the radius of gyration (see Figure S2c) remained at 21.4 ± 0.1 Å, which was slightly bigger than that for the inactive CB2. In addition, the radius of gyration of the G protein was maintained at 30.9 ± 0.2 Å. The RMSD value for the active CB2 remained stable at 3.6 Å after 40 ns (Figure S2d).
Next, we compared the root-mean-square fluctuation (RMSF) distributions for the inactive and active CB2, as shown in Figure S3. We found that both the RMSD and RMSF of the active CB2 were lower than those of the inactive one as a result of coupling of the active CB2 with G protein (steric restraint). All of the RMSD and RMSF values showed that our systems were very stable during the MD simulations.
Comparison of Inactive and Active CB2 Conformations after MD
We then aligned the inactive CB2 (green) with the active one (cyan) after 100 ns of MD, as shown in Figure 2a (from the extracellular side) and Figure 2b (from the intracellular side). All of the extracellular and intracellular loops have been removed for clarify. Conformational changes can be observed in the active CB2 when binding with G protein, especially for the contact surface portions. We believed that the structural differences between the active and inactive CB2 during the MD simulations were mainly caused by the significant difference in the templates that we used for the homology modeling. However, the results from our MD simulations showed more dynamic details. Our results showed that the intracellular side of TM6 in the active CB2 moved outward along the central axis of the receptor in comparison with the inactive CB2, while the intracellular side of TM7 in the active CB2 moved toward the central axis. In addition, no significant movements were observed from the extracellular side, but the residues endured conformational changes that may trigger these outward movements (see the following discussion). The outermost edge residues for each transmembrane domain are given for reference. All of these results were congruent with those of recent reports on GPCRs.52,53
Figure 2.
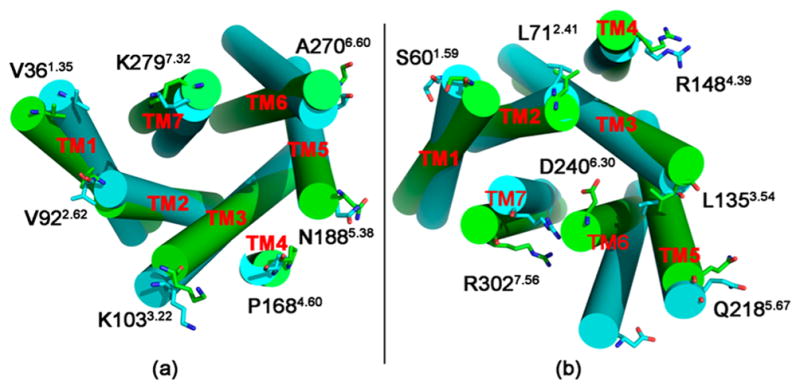
Alignment of the inactive (highlighted in green) and active (highlighted in cyan) CB2 after 100 ns MD simulation, viewd from (a) the extracellular side and (b) the intracellular side. Loops have been removed for clarity, and the outermost edge residues for each transmembrane domain are given for reference and are shown as sticks.
By comparing the intracellular side between the inactive CB2 and the active one, we found that the potential binding pocket of the active CB2 for coupling with G proteins is mainly formed by TM2, TM3, TM5, TM6, and TM7. A trumpet-shaped pocket toward the intracellular direction was defined using HOLE software,54 as shown in Figure S4. The potential residues interacting with the G protein and the distance between residual pairs are also shown in Figure S4. Our MD results showed that the radius of this binding pocket for G proteins became larger and moved from the middle part to the intracellular side of the TM as a result of the movement of the intracellular sides of TM5–TM7.
Ionic Lock
Our previous study13 and other groups’ work55–58 indicated that there is a stable “ionic lock” between R1313.50 and D2406.30 in the inactive CB2. Analysis of the distance change of the “ionic lock”55–58 can partially reflect the structural transformation for both the inactive and active CB2. The templates used for the construction of the CB2 models led to significant differences between the starting points of the “ionic lock”. However, our results and discussion in this section provide more dynamic information about the “ionic lock” during the MD simulations between the inactive CB2 and the active one.
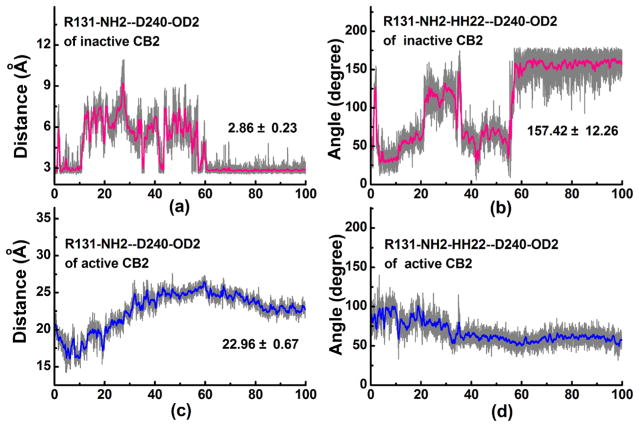
For the inactive CB2, an appropriate “ionic lock” distance (R1313.50-NH2 to D2406.30-OD2) of ~3 Å was found in the starting stage (0–10 ns) during the MD simulation, as shown in Figure 3a. Then this interaction endured a large change in lipid-soluble environment from 10–60 ns, with the distance changing from 3 to 9 Å. After 60 ns, these two residues formed a stable “ionic lock” with a distance of 3.0 ± 0.2 Å. A plot of the corresponding “ionic lock” angle (R131-NH2–HH22–D240-OD2) versus MD simulation time is shown in Figure 3b. Our results showed that the “ionic lock” angle was about 30° at 0–10 ns and then fluctuated from 30° to 125° from 10 to 60 ns during the MD simulation. After 60 ns of MD, the “ionic lock” angle remained stable at 157.42°, sharing the same trend with the distance.
Figure 3.
Distance and angle of the “ionic lock” as functions of the MD simulation time at the inactive and active CB2: (a) distance of the “ionic lock” at the inactive CB2; (b) angle of the “ionic lock” at the inactive CB2; (c) distance of the “ionic lock” at the active CB2; (d) angle of the “ionic lock” at the active CB2.
For the active CB2 system, our results showed that the “ionic lock” distance (Figure 3c) gradually decreased from 20 to 16 Å at 0–10 ns, then slowly increased and reached a peak at 26 Å at 10–60 ns, and finally remained stable at 23 Å at 80–100 ns. The distance variation may have a good correlation with the outward tilting of TM6 and the dramatic outward opening of the loop between TM5 and TM6. The “ionic lock” angle for active CB2 gradually decreased and remained stable at 55° after 33 ns of MD simulation (Figure 3d).
Binding Energy Analysis
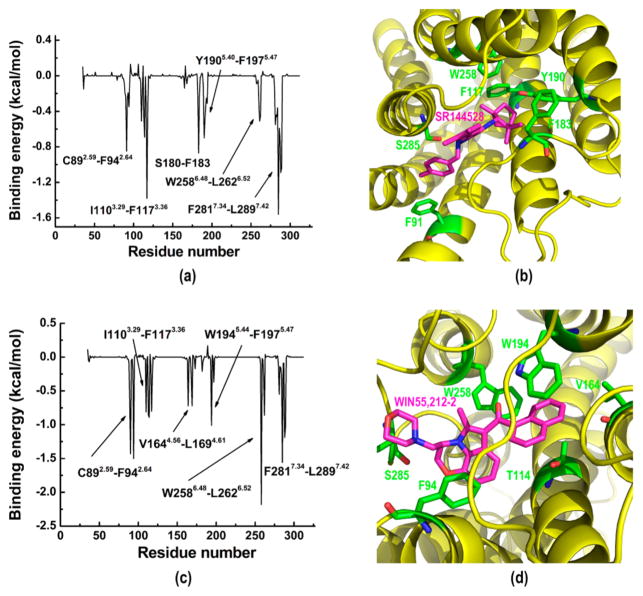
The MM/GBSA38,59,60 energy decomposition approach was applied to provide information on key residues that favored molecular recognition to the greatest extents from the energy point of view. First, our results showed that the calculated binding energy between the inactive CB2 and the inverse agonist SR144528 was −23.97 kcal/mol. For comparison, we also docked SR144528 into the active CB2 model after MD, as shown in Figure S5a, and obtained a binding energy of −15.75 kcal/mol. Figure 4a shows the contributions of different residues to the binding energy, and Figure 4b shows the binding pose of the inverse agonist SR144528. The RMSD of SR144528 during the MD simulation was 0.7 Å. Residues in six major domains contributed to the binding with SR144528, including C892.59–F942.64, L1103.29–F1173.36, S180–F183 in ECL2, Y1905.40–F1975.47, V2616.51–L2626.52, and F2817.34–L2897.42. However, the binding energy of the active CB2 bound with agonist WIN55,212-2 was −19.44 kcal/mol. For comparison, we also docked WIN55,212-2 into the inactive CB2 model after MD (Figure S5b) and obtained a binding energy of −7.63 kcal/mol. Figure 4c shows the contributions of different residues to the binding energy, and Figure 4d shows the binding pose of WIN55,212-2. Our results showed that the agonist WIN55,212-2 remained stable (~1.0 Å) during the MD simulation, indicating that the binding pose predicted by our docking was reasonable. Residues in six major domains contributed to the binding with the ligand, including C892.59–F942.64, L1103.29–F1173.36, V1644.56–L1694.61, W1945.44–F1975.47, V2616.51–L2626.52, and F2817.34–L2897.42.
Figure 4.
Binding energy contributions of CB2 for association with SR144528 and WIN55,212-2: (a) binding energy contributions of inactive CB2 bound with SR144528; (b) binding pose of SR144528; (c) binding energy contributiond of active CB2 bound with WIN55,212-2; (d) binding pose of WIN55,212-2.
By analyzing the contributions of residues for both the inverse agonist and the agonist, we found that most of the residues were the same, including V1133.32, W1945.44, and F1975.47. Among them, V1133.32 was important for the ligand recognition of CB2.13,56 Moreover, W1945.44 in TM5 was crucial for the CB2 ligand binding and adenylyl cyclase activity.61 Replacement of F197 with valine resulted in a 14-fold decrease in WIN55,212-2’s binding affinity to CB2, but this replacement showed no effect on the association of hU-210, CP55940, or AEA.10 However, our results showed that W2586.48 made a greater contribution to the binding of the agonist WIN55,212-2 (−2.18 kcal/mol) than to binding of the inverse agonist SR144528 (−0.08 kcal/mol). W2586.48 is highly conserved in GPCRs, supporting a proposal that its rotameric state has a role in CB2 activation.53 This result indicated that W2586.48 may have the role of distinguishing the agonist from the inverse agonist, which is congruent with recent reports.52,53 Importantly, our results showed that residues in TM4 (V1644.56–L1694.61) contributed greatly to the binding energy of the agonist WIN55,212-2 (Figure 4c), while extracellular loop 2 (ECL2, S180–F183) made a contribution to binding of the inverse agonist SR144528 (Figure 4a). Our results showed that many residues endured conformational changes related to the movements of transmembrane domains. All of these results helped us to understand the difference between recognition of the agonist and recognition of the inverse agonist.
Moreover, we also analyzed the molecular recognition of GDP and G proteins (Figure S6). The results indicated that GDP mainly interacted with the Gα subunit in G proteins, with a total binding energy of −38.86 kcal/mol. The most favorable areas of residues for binding were G42–K46, L175–R178, and N269–K270. Among them, the most important residues included R178, K46, and K270, with binding energies of −14.21, −5.16, and −2.63 kcal/mol, respectively. Additionally, there were seven relatively stable hydrogen bonds of GDP with D150 and R176 in the Gα subunit, especially R176 with a residue binding energy of −2.75 kcal/mol in favor of binding. On the other hand, both D150 and GDP were negative charged, and the binding energy between them was merely −0.02 kcal/mol, indicating that D150 is a residue that can contribute only to the specific binding between G proteins and GDP/GTP. All of these results are in accordance with the recent report of Louet et al.62
Finally, we looked into the binding energy between CB2 and G proteins. The calculated binding energy between G proteins and the active CB2 was −50.01 kcal/mol. During the long-time MD simulation, CB2 moved toward and interacted with the Gβ subunit, forming more interactions with Gα/Gβ protein. The following residues and regions played significant roles in binding: I58–R66, L213–H217, and R131–R147 in active CB2, E25–A31 and T340–D354 in the Gα subunit, and H311–D312 in the Gβ subunit (Figure S7). Importantly, two hydrogen bonds played key roles in the recognition, including a hydrogen bond between K215 (CB2, −2.1 kcal/mol) and D350 (Gα subunit, −1.59 kcal/mol) and a hydrogen bond between R147 (CB2, −7.89 kcal/mol) and E25 (Gα subunit, −2.72 kcal/mol). Similar results can be found in the crystal structure of β2 receptor bound with G proteins.25 Additionally, one nonpolar interaction between L135 (CB2, −3.06 kcal/mol) and I344 (Gα subunit, −1.05 kcal/mol) was also important for the system. Last but not least, interactions between the Gβ subunit and the active CB2 were mainly composed of long-range electrostatic interactions, in particular between S61 (CB2, −1.94 kcal/mol) and H311 (Gβ subunit, −4.43 kcal/mol) and between Q63 (CB2, 0.11 kcal/mol) and D312 (Gβ subunit, −0.97 kcal/mol). In the crystal structure of β2 receptor (PDB entry 3SN6),25 β2 also bound with D312 in the Gβ subunit of Gs proteins, suggesting that the interaction between the active CB2 after MD simulation with multiple β-sheet domains in the Gβ subunit is reasonable.25
Pharmacophore Model and Virtual Screening
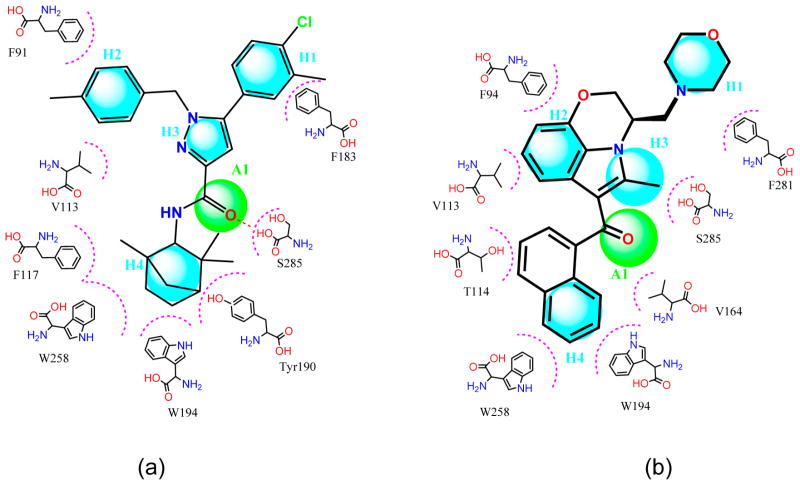
On the basis of the binding poses of compounds and the contributions of residues at CB2, we used the GALAHAD program in SYBYL to construct the pharmacophore models of SR144528 (inverse agonist) and WIN55,212-2 (agonist). As shown in Figure 5, we defined one H-bond acceptor (A) and four hydrophobic or hydrophobic aromatic centers (H) for these two compounds. The distance restrictions of the pharmacophore models are shown in Tables 1 and 2. For filtering of the database using the pharmacophore model of SR144528, we required a four-point pharmacophore match allowing the omission of either the H1, H2, or H3 interaction, i.e., H2–H3–A1–H4, H1–H3–A1–H4, or H1–H2–A1–H4, respectively. For filtering the database using the pharmacophore model of Win55,212-2, we used a five-point pharmacophore match allowing H1–H2–H3–A1–H4. These two pharmacophores were used to filter the National Cancer Institute chemical library (NCI2011, 210 000 compounds) with compounds that satisfied specific geometric or physicochemical constraints of the defined pharmacophores. For the pharmacophore model of the inverse agonist, the set of 210 000 NCI compounds was thereby narrowed down to 23 243 compounds (duplicates deleted). For the pharmacophore model of the agonist, an optimized 3D chemical compound library with 10 337 compounds was obtained.
Figure 5.
Two-dimensional pharmacophore models H4–A1 of SR144528 (inverse agonist) and WIN55,212-2 (agonist). (a) Pharmacophore model H4–A1 of SR144528 (inverse agonist). Distance restrictions can be found in Table 1. (b) Pharmacophore model H4–A1 of WIN55,212-2. Distance restrictions can be found in Table 2. For SR144528, we required a four-point pharmacophore match allowing the omission of either the H1, H2, or H3 interaction, i.e., H2–H3–A1–H4, H1–H3–A1–H4, or H1–H2–A1–H4, respectively. For Win55,212-2, we used a five-point pharmacophore match allowing H1–H2–H3–A1–H4.
Table 1.
Distance Restrictions of the Pharmacophore Model for the Inverse Agonist SR144528
| H1–H2a (distance 1b) | H2–H3 (distance 2) | H3–A1 (distance 3) | A1–H4 (distance 4) | H4–H1 (distance 5) |
|---|---|---|---|---|
| 3.7 | 4.6 | 3.6 | 5.0 | 11.4 |
A, hydrogen bond acceptor; H, hydrophobic or hydrophobic aromatic center.
The distances are given in Å with an error range of ±1 Å.
Table 2.
Distance Restrictions of the Pharmacophore Model for the Agonist WIN55,212-2
| H1–H2a (distance 1b) | H2–H3 (distance 2) | H3–A1 (distance 3) | A1–H4 (distance 4) | H4–H1 (distance 5) |
|---|---|---|---|---|
| 6.9 | 3.6 | 3.2 | 4.6 | 8.0 |
A, hydrogen bond acceptor; H, hydrophobic or hydrophobic aromatic center.
The distances are given in Å with an error range of ±1 Å.
Virtual screening was carried out for both the inactive CB2 and the active one against their corresponding optimized libraries (23 243 and 10 337, compounds, respectively). Two different conformations (inactive/active) of CB2 with the lowest energy during our MD simulations were used to perform the virtual screening in parallel. We selected the top 15 compounds for each screening for subsequent bioassay testing. For comparison, we also selected one more representative conformation in the inactive form to perform the virtual screening. Our results showed that 36 of the top 50 compounds (72%) were the same in two independent screenings of inactive CB2 models.
Novel Inhibitors from in Silico Screening To Characterize the Inactive and Active CB2 Models
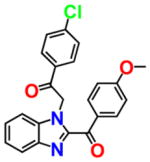
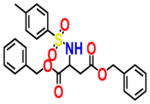
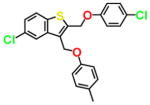
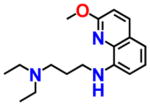
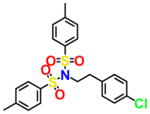
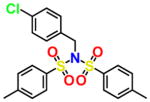
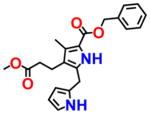
For an initial evaluation of the utility of the model for identifying novel structures with CB2 activity, we examined a panel of 30 compounds from the NCI database. Among the 30 compounds, 10 compounds yielded CB2 binding affinities with Ki values lower than 3 μM. Eight compounds were hits obtained from the inactive CB2 model, including NSC93299, NSC162677, NSC273936, NSC273939, NSC273940, NSC296950, NSC402300, and NSC745454, while other two compounds, NSC618804 and NSC669611, were obtained from the active CB2 model.
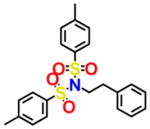
Among these 10 compounds, two compounds, NSC27393951 and NSC273940, inhibited [3H]CP-55,940 binding to CB2 with Ki values of 0.192 and 0.195 μM, respectively. NSC273936, NSC402300, and NSC618804 inhibited [3H]CP-55,940 binding to hCB2 with Ki values of 0.346, 0.398, and 0.656 μM, respectively. The other compounds yielded Ki values ranging from 0.923 to 2.360 μM. All of the structures, docking scores, and Ki values can be found in Table 3. Among all of the active ligands, NSC273936, NSC273939, and NSC273940 (obtained from H1–H2–A1–H4) had similar structures, while the other seven compounds differed from each other. Some compounds exhibited novel scaffolds and can be used as novel chemical probes for future studies of CB2, including NSC93299 and NSC162677 (obtained from H1–H3–A1–H4). In addition, we also predicted the correlation coefficient between the docking scores and Ki values of these 10 hits, with an R value of 0.27. This finding supported the conclusion that the docking scores of ligands cannot accurately reflect their activity data and that the docking score should not be regarded as the criterion for determining whether a compound is an agonist or inverse agonist.
Table 3.
Novel Structures of Compounds for CB2 Identified from the in Silico Screen
| Compound ID | Structure | Score | Ki (μM) | Compound ID | Structure | Score | Ki (μM) |
|---|---|---|---|---|---|---|---|
| NSC93299 |

|
6.176 | 2.235 | NSC273940 |
|
7.038 | 0.195 |
| NSC745454 |
|
7.310 | 1.547 | NSC296950 |
|
6.849 | 2.360 |
| NSC162677 |
|
7.643 | 1.548 | NSC402300 |
|
9.352 | 0.398 |
| NSC273939 |
|
7.499 | 0.192 | NSC618804 |

|
7.642 | 0.656 |
| NSC273936 |
|
7.024 | 0.346 | NSC669611 |
|
8.698 | 0.923 |
The functional activities of the compounds were investigated using a cell-based LANCE cAMP assay, which provides a useful method to distinguish among inverse agonists, agonists, and neutral antagonists. On the basis of the raw counting data of the binding at CB2, two compounds from the inactive CB2 model (NSC296950 and NSC402300), one compound from the active CB2 model (NSC669611), and two control compounds (CP-55,940 and SR144528) were selected to perform the cAMP assay.
As shown in Figure 6, reduction of the LANCE signal occurred with increasing concentrations of NSC296950 (green) and NSC402300 (cyan). The increasing forskolin-induced cAMP production suggested that NSC296950 acts as an inverse agonist. However, the results for NSC402300 (cyan) suggested that it behaves as a neutral antagonist at concentrations below 10 μM and as an inverse agonist at concentrations above 10 μM. It is noteworthy that these two compounds were obtained from the inactive CB2 model. However, our results showed that NSC669611 obtained from the active CB2 model (highlighted in orange) behaves similarly to NSC402300. These results are congruent with recent reports indicating that inverse agonists can bind to and stabilize inactive GPCRs while neutral antagonists can bind to both inactive and active GPCRs.63,64
Figure 6.
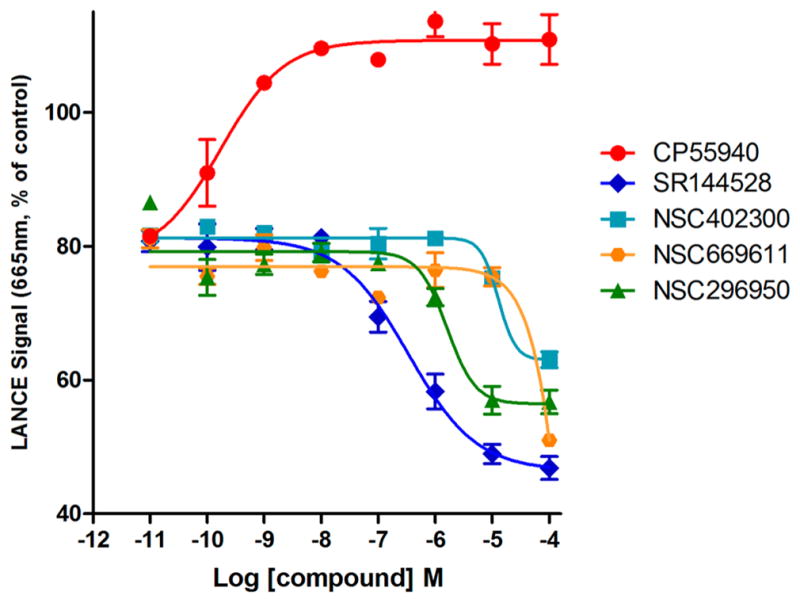
Comparison of LANCE signals of different CB2 receptor ligands in stably transfected CHO cells expressing human CB2 receptors in a concentration-dependent fashion. Data are shown as mean ± SEM of all experiments of two or more performed in duplicate or triplicate. NSC296950 (green) acts as inverse agonist, and NSC402300 (cyan) behaves as neutral antagonist below a concentration of 10 μM. NSC669611 (orange) also behaves as a neutral antagonist below a concentration of 10 μM.
In summary, for the inactive CB2 model, we screened inverse agonist or neutral antagonist. However, for the active CB2 model, we screened only a neutral antagonist but not an agonist. Here we performed the molecular docking of active/ inactive CB2 models after MD simulations against the same compound library of 879 compounds (833 agonists and 46 inverse agonists), as shown in Figure S8. Our results showed that even after the refinement by the MD simulations, the correlation between the docking scores and pEC50/pIC50 values had some improvements but not significant ones. It can therefore be speculated that the docking scores may be not good enough to serve as criteria for selecting potential hits. The binding free energy (generated by Glide or AutoDock) should be introduced for future work. Moreover, known compounds should be included in the compound library so that the binding energies (or docking scores) of these known compounds can be treated as controls to help us select hits. Finally, we think that it my not be accurate enough to generate a five-point pharmacophore model using only WIN55,212-2. We are in the process of generating pharmacophore models by incorporating additional cannabinoid agonists, and the results of that work will be reported elsewhere. In addition, we continue to optimize our constructed homology models and pharmacophore models and consider the above criteria for designing agonists for CB2.
CONCLUSION
In the present work, we constructed models of both inactive and active CB2 by homology modeling. MD simulations and binding energy decomposition were used to analyze the conformational changes of CB2/G protein and the contributions of the energies of residues. Most of the results were congruent with our experimental data and recent reports. For further comparisons, we used both the inactive and active CB2 models to perform virtual screening in parallel. Among all of the hits, some compounds exhibited novel scaffolds and could be used as novel chemical probes for future studies of CB2. Importantly, our studies showed that the hits obtained from the inactive CB2 model mainly act as inverse agonist(s) or neutral antagonist(s). Moreover, the hit predicted from the active CB2 model behaves as a neutral antagonist below a concentration of 10 μM. Our studies provide new insight leading to better understanding of the structural and conformational differences between inactive and active CB2 and illuminate the structural effects for future virtual screening and drug design.
Supplementary Material
Acknowledgments
The project was supported by funding provided to the Xie laboratory by NIH NIDA (P30 DA035778A1) and NIH (R01 DA025612) and in part by the National Natural Science Foundation of China (11147175 and 11247018), the Key Project of Sichuan Provincial Education Bureau (12ZA066), and the Project of Leshan Science and Technology Administration (14GZD022).
Footnotes
The authors declare no competing financial interest.
The Supporting Information is available free of charge on the ACS Publications website at DOI: 10.1021/acs.jcim.5b00739.
Figure S1 shows prescreen validation of the other two inactive and active CB2 models. Figure S2 shows the overall MD parameters for the inactive and active CB2 systems. Figure S3 shows the RMSF distribution for both the inactive and active CB2 receptors. Figure S4 shows the binding hole of the activated CB2 receptor with G proteins. Figure S5 shows the binding modes of SR144528 in the active CB2 model and WIN55,212-2 in the inactive one. Figure S6 shows the binding energy contribution of GDP to the association of Gα subunit.
References
- 1.Salon JA, Lodowski DT, Palczewski K. The Significance of G Protein-Coupled Receptor Crystallography for Drug Discovery. Pharmacol Rev. 2011;63:901–937. doi: 10.1124/pr.110.003350. [DOI] [PMC free article] [PubMed] [Google Scholar]
- 2.Wenthur CJ, Gentry PR, Mathews TP, Lindsley CW. Drugs for Allosteric Sites on Receptors. Annu Rev Pharmacol Toxicol. 2014;54:165. doi: 10.1146/annurev-pharmtox-010611-134525. [DOI] [PMC free article] [PubMed] [Google Scholar]
- 3.Feng Z, Kochanek S, Close D, Wang L, Srinivasan A, Almehizia AA, Iyer P, Xie XQ, Johnston PA, Gold B. Design and activity of AP endonuclease-1 inhibitors. J Chem Biol. 2015;8:79–93. doi: 10.1007/s12154-015-0131-7. [DOI] [PMC free article] [PubMed] [Google Scholar]
- 4.Vemuri VK, Janero DR, Makriyannis A. Pharmacotherapeutic Targeting of the Endocannabinoid Signaling System: Drugs for Obesity and the Metabolic Syndrome. Physiol Behav. 2008;93:671–686. doi: 10.1016/j.physbeh.2007.11.012. [DOI] [PMC free article] [PubMed] [Google Scholar]
- 5.Bouaboula M, Poinot-Chazel C, Marchand J, Canat X, Bourrie B, Rinaldi-Carmona M, Calandra B, Le Fur G, Casellas P. Signaling Pathway Associated with Stimulation of CB2 Peripheral Cannabinoid Receptor. Involvement of both Mitogen-Activated Protein Kinase and Induction of Krox-24 Expression. Eur J Biochem. 1996;237:704–711. doi: 10.1111/j.1432-1033.1996.0704p.x. [DOI] [PubMed] [Google Scholar]
- 6.Zhang HY, Gao M, Liu QR, Bi GH, Li X, Yang HJ, Gardner EL, Wu J, Xi ZX. Cannabinoid CB2 Receptors Modulate Midbrain Dopamine Neuronal Activity and Dopamine-Related Behavior in Mice. Proc Natl Acad Sci U S A. 2014;111:E5007–E5015. doi: 10.1073/pnas.1413210111. [DOI] [PMC free article] [PubMed] [Google Scholar]
- 7.Huffman JW, Marriott KSC. Recent Advances in the Development of Selective Ligands for the Cannabinoid CB(2) Receptor. Curr Top Med Chem. 2008;8:187–204. doi: 10.2174/156802608783498014. [DOI] [PubMed] [Google Scholar]
- 8.Poso A, Huffman JW. Targeting the Cannabinoid CB2 Receptor: Modelling and Structural Determinants of CB2 Selective Ligands. Br J Pharmacol. 2008;153:335–346. doi: 10.1038/sj.bjp.0707567. [DOI] [PMC free article] [PubMed] [Google Scholar]
- 9.Reggio PH. Computational Methods in Drug Design: Modeling G Protein-Coupled Receptor Monomers, Dimers, and Oligomers. AAPS J. 2006;8:E322–336. doi: 10.1007/BF02854903. [DOI] [PMC free article] [PubMed] [Google Scholar]
- 10.Song ZH, Slowey CA, Hurst DP, Reggio PH. The Difference between the CB1 and CB2 Cannabinoid Receptors at Position 5.46 Is Crucial for the Selectivity of WIN55212–2 for CB2. Mol Pharmacol. 1999;56:834–840. [PubMed] [Google Scholar]
- 11.Gouldson P, Calandra B, Legoux P, Kernéis A, Rinaldi-Carmona M, Barth F, Le Fur G, Ferrara P, Shire D. Mutational Analysis and Molecular Modelling of the Antagonist SR 144528 Binding Site on the Human Cannabinoid CB2 Receptor. Eur J Pharmacol. 2000;401:17–25. doi: 10.1016/s0014-2999(00)00439-8. [DOI] [PubMed] [Google Scholar]
- 12.Chen JZ, Wang J, Xie XQ. GPCR Structure-Based Virtual Screening Approach for CB2 Antagonist Search. J Chem Inf Model. 2007;47:1626–1637. doi: 10.1021/ci7000814. [DOI] [PubMed] [Google Scholar]
- 13.Feng Z, Alqarni MH, Yang P, Tong Q, Chowdhury A, Wang L, Xie XQ. Modeling, Molecular Dynamics Simulation, and Mutation Validation for Structure of Cannabinoid Receptor 2 Based on Known Crystal Structures of GPCRs. J Chem Inf Model. 2014;54:2483–2499. doi: 10.1021/ci5002718. [DOI] [PMC free article] [PubMed] [Google Scholar]
- 14.Xie XQ, Chen JZ, Billings EM. 3D Structural Model of the G-Protein-Coupled Cannabinoid CB2 Receptor. Proteins: Struct, Funct Genet. 2003;53:307–319. doi: 10.1002/prot.10511. [DOI] [PubMed] [Google Scholar]
- 15.Palczewski K, Kumasaka T, Hori T, Behnke CA, Motoshima H, Fox BA, Le Trong I, Teller DC, Okada T, Stenkamp RE, Yamamoto M, Miyano M. Crystal Structure of Rhodopsin: AG Protein-Coupled Receptor. Science. 2000;289:739–745. doi: 10.1126/science.289.5480.739. [DOI] [PubMed] [Google Scholar]
- 16.Tuccinardi T, Ferrarini PL, Manera C, Ortore G, Saccomanni G, Martinelli A. Cannabinoid CB2/CB1 Selectivity. Receptor Modeling and Automated Docking Analysis. J Med Chem. 2006;49:984–994. doi: 10.1021/jm050875u. [DOI] [PubMed] [Google Scholar]
- 17.Stern E, Muccioli GG, Millet R, Goossens JF, Farce A, Chavatte P, Poupaert JH, Lambert DM, Depreux P, Hénichart JP. Novel 4-oxo-1, 4-dihydroquinoline-3-carboxamide Derivatives as new CB2 Cannabinoid Receptors Agonists: Synthesis, Pharmacological Properties and Molecular Modeling. J Med Chem. 2006;49:70–79. doi: 10.1021/jm050467q. [DOI] [PubMed] [Google Scholar]
- 18.Raduner S, Majewska A, Chen JZ, Xie XQ, Hamon J, Faller B, Altmann KH, Gertsch J. Alkylamides from Echinacea Are a new Class of Cannabinomimetics Cannabinoid Type 2 Receptor-Dependent and-Independent Immunomodulatory Effects. J Biol Chem. 2006;281:14192–14206. doi: 10.1074/jbc.M601074200. [DOI] [PubMed] [Google Scholar]
- 19.Venkatakrishnan A, Deupi X, Lebon G, Tate CG, Schertler GF, Babu MM. Molecular Signatures of G-Protein-Coupled Receptors. Nature. 2013;494:185–194. doi: 10.1038/nature11896. [DOI] [PubMed] [Google Scholar]
- 20.Manglik A, Kobilka B. The Role of Protein Dynamics in GPCR Function: Insights from the β 2 AR and Rhodopsin. Curr Opin Cell Biol. 2014;27:136–143. doi: 10.1016/j.ceb.2014.01.008. [DOI] [PMC free article] [PubMed] [Google Scholar]
- 21.Bhattacharya S, Hall SE, Vaidehi N. Agonist-Induced Conformational Changes in Bovine Rhodopsin: Insight into Activation of G-Protein-Coupled Receptors. J Mol Biol. 2008;382:539–555. doi: 10.1016/j.jmb.2008.06.084. [DOI] [PubMed] [Google Scholar]
- 22.Daga PR, Zaveri NT. Homology Modeling and Molecular Dynamics Simulations of the Active State of the Nociceptin Receptor Reveal new Insights into Agonist Binding and Activation. Proteins: Struct, Funct Genet. 2012;80:1948–1961. doi: 10.1002/prot.24077. [DOI] [PMC free article] [PubMed] [Google Scholar]
- 23.Mnpotra JS, Qiao Z, Cai J, Lynch DL, Grossfield A, Leioatts N, Hurst DP, Pitman MC, Song ZH, Reggio PH. Structural Basis of G Protein-Coupled Receptor-Gi Protein Interaction Formation of the Cannabinoid CB2 Receptor-Gi Protein Complex. J Biol Chem. 2014;289:20259–20272. doi: 10.1074/jbc.M113.539916. [DOI] [PMC free article] [PubMed] [Google Scholar]
- 24.Rasmussen SG, DeVree BT, Zou Y, Kruse AC, Chung KY, Kobilka TS, Thian FS, Chae PS, Pardon E, Calinski D, et al. Crystal Structure of the [bgr] 2 Adrenergic Receptor-Gs Protein Complex. Nature. 2011;477:549–555. doi: 10.1038/nature10361. [DOI] [PMC free article] [PubMed] [Google Scholar]
- 25.Cherezov V, Rosenbaum DM, Hanson MA, Rasmussen SG, Thian FS, Kobilka TS, Choi HJ, Kuhn P, Weis WI, Kobilka BK, Stevens RC. High-Resolution Crystal Structure of an Engineered Human β2-Adrenergic G Protein–Coupled Receptor. Science. 2007;318:1258–1265. doi: 10.1126/science.1150577. [DOI] [PMC free article] [PubMed] [Google Scholar]
- 26.Wall MA, Coleman DE, Lee E, Iñiguez-Lluhi JA, Posner BA, Gilman AG, Sprang SR. The Structure of the G Protein Heterotrimer G iα1 β 1 γ 2. Cell. 1995;83:1047–1058. doi: 10.1016/0092-8674(95)90220-1. [DOI] [PubMed] [Google Scholar]
- 27.SYBYL-X, version 1.3. Tripos International; St. Louis, MO: 2010. [Google Scholar]
- 28.Martí-Renom MA, Stuart AC, Fiser A, Sánchez R, Melo F, Šali A. Comparative Protein Structure Modeling of Genes and Genomes. Annu Rev Biophys Biomol Struct. 2000;29:291–325. doi: 10.1146/annurev.biophys.29.1.291. [DOI] [PubMed] [Google Scholar]
- 29.Feng Z, Pearce LV, Xu X, Yang X, Yang P, Blumberg PM, Xie XQ. Structural Insight into Tetrameric hTRPV1 from Homology Modeling, Molecular Docking, Molecular Dynamics Simulation, Virtual Screening and Bioassay Validations. J Chem Inf Model. 2015;55:572–588. doi: 10.1021/ci5007189. [DOI] [PMC free article] [PubMed] [Google Scholar]
- 30.Wiederstein M, Sippl MJ. ProSA-Web: Interactive Web Wervice for the Recognition of Errors in Three-Dimensional Structures of Proteins. Nucleic Acids Res. 2007;35:W407–W410. doi: 10.1093/nar/gkm290. [DOI] [PMC free article] [PubMed] [Google Scholar]
- 31.Laskowski RA, MacArthur MW, Moss DS, Thornton JM. PROCHECK: a Program to Check the Stereochemical Qality of Protein Structures. J Appl Crystallogr. 1993;26:283–291. [Google Scholar]
- 32.Jain AN. Scoring Noncovalent Protein-Ligand Interactions: a Continuous Differentiable Function Tuned to Compute Binding Affinities. J Comput-Aided Mol Des. 1996;10:427–440. doi: 10.1007/BF00124474. [DOI] [PubMed] [Google Scholar]
- 33.Pedretti A, Villa L, Vistoli G. VEGA: a Versatile Program to Convert, Handle and Visualize Molecular Structure on Windows-Based PCs. J Mol Graphics Modell. 2002;21:47–49. doi: 10.1016/s1093-3263(02)00123-7. [DOI] [PubMed] [Google Scholar]
- 34.Søndergaard CR, Olsson MH, Rostkowski M, Jensen JH. Improved Treatment of Ligands and Coupling Effects in Empirical Calculation and Rationalization of p K a Values. J Chem Theory Comput. 2011;7:2284–2295. doi: 10.1021/ct200133y. [DOI] [PubMed] [Google Scholar]
- 35.Hsin J, Arkhipov A, Yin Y, Stone JE, Schulten K. Using VMD: an Introductory Tutorial. Curr Protoc Bioinform. 2008;24:5.7.1–5.7.48. doi: 10.1002/0471250953.bi0507s24. [DOI] [PMC free article] [PubMed] [Google Scholar]
- 36.Jorgensen WL, Chandrasekhar J, Madura JD, Impey RW, Klein ML. Comparison of Simple Potential Functions for Simulating Liquid Water. J Chem Phys. 1983;79:926. [Google Scholar]
- 37.Kalé L, Skeel R, Bhandarkar M, Brunner R, Gursoy A, Krawetz N, Phillips J, Shinozaki A, Varadarajan K, Schulten K. NAMD2: Greater Scalability for Parallel Molecular Dynamics. J Comput Phys. 1999;151:283–312. [Google Scholar]
- 38.Hou T, Wang J, Li Y, Wang W. Assessing the Performance of the MM/PBSA and MM/GBSA Methods. 1. The Accuracy of Binding Free Energy Calculations Based on Molecular Dynamics Simulations. J Chem Inf Model. 2011;51:69–82. doi: 10.1021/ci100275a. [DOI] [PMC free article] [PubMed] [Google Scholar]
- 39.Hou T, Yu R. Molecular Dynamics and Free Energy Studies on the Wild-Type and Double Mutant HIV-1 Protease Complexed with Amprenavir and two Amprenavir-Related Inhibitors: Mechanism for Binding and Drug Resistance. J Med Chem. 2007;50:1177–1188. doi: 10.1021/jm0609162. [DOI] [PubMed] [Google Scholar]
- 40.Xu L, Li Y, Li D, Xu P, Tian S, Sun H, Liu H, Hou T. Exploring the Binding Mechanisms of MIF to CXCR2 using Theoretical Approaches. Phys Chem Chem Phys. 2015;17:3370–3382. doi: 10.1039/c4cp05095a. [DOI] [PubMed] [Google Scholar]
- 41.Essmann U, Perera L, Berkowitz ML, Darden T, Lee H, Pedersen LG. A Smooth Particle Mesh Ewald Method. J Chem Phys. 1995;103:8577–8593. [Google Scholar]
- 42.Kollman PA, Massova I, Reyes C, Kuhn B, Huo S, Chong L, Lee M, Lee T, Duan Y, Wang W, et al. Calculating Structures and Free Energies of Complex Molecules: Combining Molecular Mechanics and Continuum Models. Acc Chem Res. 2000;33:889–897. doi: 10.1021/ar000033j. [DOI] [PubMed] [Google Scholar]
- 43.Tsui V, Case DA. Theory and Applications of the Generalized Born Solvation Model in Macromolecular Simulations. Biopolymers. 2000;56:275–291. doi: 10.1002/1097-0282(2000)56:4<275::AID-BIP10024>3.0.CO;2-E. [DOI] [PubMed] [Google Scholar]
- 44.Bashford D, Case DA. Generalized Born Models of Macromolecular Solvation Effects. Annu Rev Phys Chem. 2000;51:129–152. doi: 10.1146/annurev.physchem.51.1.129. [DOI] [PubMed] [Google Scholar]
- 45.Sitkoff D, Sharp KA, Honig B. Accurate Calculation of Hydration Free Energies using Macroscopic Solvent Models. J Phys Chem. 1994;98:1978–1988. [Google Scholar]
- 46.Still WC, Tempczyk A, Hawley RC, Hendrickson T. Semianalytical Treatment of Solvation for Molecular Mechanics and Dynamics. J Am Chem Soc. 1990;112:6127–6129. [Google Scholar]
- 47.Weiser J, Shenkin PS, Still WC. Approximate Atomic Surfaces from Linear Combinations of Pairwise Overlaps (LCPO) J Comput Chem. 1999;20:217–230. [Google Scholar]
- 48.Gertsch J, Leonti M, Raduner S, Racz I, Chen JZ, Xie XQ, Altmann KH, Karsak M, Zimmer A. Beta-Caryophyllene is a Dietary Cannabinoid. Proc Natl Acad Sci U S A. 2008;105:9099–9104. doi: 10.1073/pnas.0803601105. [DOI] [PMC free article] [PubMed] [Google Scholar]
- 49.Yang P, Myint KZ, Tong Q, Feng R, Cao H, Almehizia AA, Alqarni MH, Wang L, Bartlow P, Gao Y, Gertsch J, Teramachi J, Kurihara N, Roodman GD, Cheng T, Xie XQ. Lead Discovery, Chemistry Optimization and Biological Evaluation Studies of Novel Bi-Amide Derivatives as CB2 Receptor Inverse Agonists and Osteoclast Inhibitors. J Med Chem. 2012;55:9973–9987. doi: 10.1021/jm301212u. [DOI] [PMC free article] [PubMed] [Google Scholar]
- 50.Zhang Y, Xie Z, Wang L, Schreiter B, Lazo JS, Gertsch J, Xie XQ. Mutagenesis and Computer Modeling Studies of a GPCR Conserved Residue W5. 43 (194) in Ligand Recognition and Signal Transduction for CB2 Receptor. Int Immunopharmacol. 2011;11:1303–1310. doi: 10.1016/j.intimp.2011.04.013. [DOI] [PMC free article] [PubMed] [Google Scholar]
- 51.Yang P, Wang L, Feng R, Almehizia AA, Tong Q, Myint KZ, Ouyang Q, Alqarni MH, Wang L, Xie XQ. Novel Triaryl Sulfonamide Derivatives as Selective Cannabinoid Receptor 2 Inverse Agonists and Osteoclast Inhibitors: Discovery, Optimization, and Biological Evaluation. J Med Chem. 2013;56:2045–2058. doi: 10.1021/jm3017464. [DOI] [PMC free article] [PubMed] [Google Scholar]
- 52.Singh R, Hurst DP, Barnett-Norris J, Lynch D, Reggio PH, Guarnieri F. Activation of the Cannabinoid CB1 Receptor may Involve a W6. 48/F3. 36 Rotamer Toggle Switch. J Pept Res. 2002;60:357–370. doi: 10.1034/j.1399-3011.2002.21065.x. [DOI] [PubMed] [Google Scholar]
- 53.Feng Z, Hou T, Li Y. Selectivity and Activation of Dopamine D3R from Molecular Dynamics. J Mol Model. 2012;18:5051–5063. doi: 10.1007/s00894-012-1509-x. [DOI] [PubMed] [Google Scholar]
- 54.Smart OS, Neduvelil JG, Wang X, Wallace B, Sansom MS. HOLE: a Program for the Analysis of the Pore Dimensions of Ion Channel Structural Models. J Mol Graphics. 1996;14:354–360. doi: 10.1016/s0263-7855(97)00009-x. [DOI] [PubMed] [Google Scholar]
- 55.Bai Q, Pérez-Sánchez H, Zhang Y, Shao Y, Shi D, Liu H, Yao X. Ligand Induced Change of β 2 Adrenergic Receptor from Active to Inactive Conformation and its Implication for the Closed/ Open State of the Water Channel: Insight from Molecular Dynamics Simulation, Free Energy Calculation and Markov State Model Analysis. Phys Chem Chem Phys. 2014;16:15874–15885. doi: 10.1039/c4cp01185f. [DOI] [PubMed] [Google Scholar]
- 56.Feng Z, Hou T, Li Y. Studies on the Interactions between β2 Adrenergic Receptor and Gs Protein by Molecular Dynamics Simulations. J Chem Inf Model. 2012;52:1005–1014. doi: 10.1021/ci200594d. [DOI] [PubMed] [Google Scholar]
- 57.Hurst DP, Grossfield A, Lynch DL, Feller S, Romo TD, Gawrisch K, Pitman MC, Reggio PH. A Lipid Pathway for Ligand Binding is Necessary for a Cannabinoid G Protein-Coupled Receptor. J Biol Chem. 2010;285:17954–17964. doi: 10.1074/jbc.M109.041590. [DOI] [PMC free article] [PubMed] [Google Scholar]
- 58.Kapur A, Hurst DP, Fleischer D, Whitnell R, Thakur GA, Makriyannis A, Reggio PH, Abood ME. Mutation Studies of Ser7. 39 and Ser2. 60 in the Human CB1 Cannabinoid Receptor: Evidence for a Serine-Induced Bend in CB1 Transmembrane Helix 7. Mol Pharmacol. 2007;71:1512–1524. doi: 10.1124/mol.107.034645. [DOI] [PubMed] [Google Scholar]
- 59.Xu L, Li D, Tao L, Yang Y, Li Y, Hou T. Binding Mechanisms of 1, 4-dihydropyridine Derivatives to L-type Calcium Channel Ca v 1.2: a Molecular Modeling Study. Mol BioSyst. 2016;12:379–390. doi: 10.1039/c5mb00781j. [DOI] [PubMed] [Google Scholar]
- 60.Xu L, Zhang Y, Zheng L, Qiao C, Li Y, Li D, Zhen X, Hou T. Discovery of Novel Inhibitors Sargeting the Macrophage Migration Inhibitory Factor via Structure-Based Virtual Screening and Bioassays. J Med Chem. 2014;57:3737–3745. doi: 10.1021/jm401908w. [DOI] [PubMed] [Google Scholar]
- 61.Nebane NM, Hurst DP, Carrasquer CA, Qiao Z, Reggio PH, Song ZH. Residues Accessible in the Binding-Site Crevice of Transmembrane Helix 6 of the CB2 Cannabinoid Receptor†. Biochemistry. 2008;47:13811–13821. doi: 10.1021/bi8007802. [DOI] [PMC free article] [PubMed] [Google Scholar]
- 62.Louet M, Martinez J, Floquet N. GDP Release Preferentially Occurs on the Phosphate Side in Heterotrimeric G-Proteins. PLoS Comput Biol. 2012;8:e1002595. doi: 10.1371/journal.pcbi.1002595. [DOI] [PMC free article] [PubMed] [Google Scholar]
- 63.Deupi X, Kobilka BK. Energy Landscapes as a Tool to Integrate GPCR Structure, Dynamics, and Function. Physiology. 2010;25:293–303. doi: 10.1152/physiol.00002.2010. [DOI] [PMC free article] [PubMed] [Google Scholar]
- 64.Kofuku Y, Ueda T, Okude J, Shiraishi Y, Kondo K, Maeda M, Tsujishita H, Shimada I. Efficacy of the β2-Adrenergic Receptor is Determined by Conformational Equilibrium in the Transmembrane Region. Nat Commun. 2012;3:1045. doi: 10.1038/ncomms2046. [DOI] [PMC free article] [PubMed] [Google Scholar]
Associated Data
This section collects any data citations, data availability statements, or supplementary materials included in this article.


