

Abstract
Aim
Patients with type 2 diabetes mellitus (T2DM) have an increased risk of bone fractures. A variable increase in fracture risk has been reported depending on skeletal site, diabetes duration, study design, insulin use, and so on. The present meta-analysis aimed to investigate the association between T2DM with fracture risk and possible risk factors.
Methods
Different databases including PubMed, Institute for Scientific Information, and Scopus were searched up to May 2016. All epidemiologic studies on the association between T2DM and fracture risk were included. The relevant data obtained from these papers were analyzed by a random effects model and publication bias was assessed by funnel plot. All analyses were done by R software (version 3.2.1) and STATA (version 11.1).
Results
Thirty eligible studies were selected for the meta-analysis. We found a statistically significant positive association between T2DM and hip, vertebral, or foot fractures and no association between T2DM and wrist, proximal humerus, or ankle fractures. Overall, T2DM was associated with an increased risk of any fracture (summary relative risk =1.05, 95% confidence interval: 1.04, 1.06) and increased with age, duration of diabetes, and insulin therapy.
Conclusion
Our findings strongly support an association between T2DM and increased risk of overall fracture. These findings emphasize the need for fracture prevention strategies in patients with diabetes.
Keywords: diabetes mellitus, fractures, bone, osteoporosis, risk factors, meta-analysis
Introduction
Diabetes is an increasingly prevalent disease, with significant associated morbidity and mortality.1 Type 2 diabetes mellitus (T2DM) is a group of metabolic diseases characterized by hyperglycemia resulting from defects in insulin secretion, insulin action, or both.1,2 Long-term hyperglycemia and inadequate glycemic control both contribute to the development of diabetic complications, including nephropathy, retinopathy, neuropathy, and macrovascular diseases such as acute coronary syndrome, claudicatio intermittens, and stroke.1–3
Besides micro- or macrovascular long-term complications, T2DM patients also have various skeletal disorders, including osteoporosis and fractures.4 Diabetes could impact the bone through several mechanisms, some of which may have contradictory effects.5 The bone turnover and, thus, the skeletal integrity may also be affected by diabetes, and diabetic bone disease can represent an overlooked complication of diabetes.6 Diabetic osteopathy is characterized by microarchitectural changes that decrease the bone quality and strength, leading to an increased risk of bone fracture in both types of diabetes.2 Patients with T2DM display a unique skeletal phenotype and impaired structural and geometric properties.7
The prevalence of osteoporosis increases dramatically with age.8 T2DM also increases with increasing age, and therefore, diabetes and osteoporosis often coexist in older adults.8–10 Authors present the overview of factors involved in the risk of osteoporosis and fractures in both types of diabetes.1
In T2DM patients, bone mineral density (BMD) seems to be normal to elevated.11 For many years, diabetic patients were not considered to be at risk of osteoporosis, based on reports of their higher BMD compared with healthy individuals. However, later studies revealed that persons with T2DM might be at increased risk for bone fractures, despite having higher BMD.12,13 The risk of bone fractures in patients with diabetes may be unrelated to BMD, and T2DM reduces bone quality rather than BMD.11 These findings suggest that factors other than BMD may be underlying the higher fracture risk observed in diabetes patients. For example, the association of diabetes with fracture risk has differed depending on the location of fracture, sex, age, duration of diabetes, and the effect of diabetes medications.11,14–16 Longer disease duration, the presence of diabetic complications, inadequate glycemic control, insulin use, and increased risk for falls are all reported to increase fracture risk.7 A variable increase in fracture risk has been reported, ranging from onefold to threefold, depending on the risk factors.7,11,14–16
The relationship between T2DM and fracture risk has been the subject of considerable interest over the past years, and several studies have examined the risk of fracture in persons with T2DM.4–17 These studies have demonstrated inconsistent conclusions: reported associations have been positive,18–21 null,15,16,22 or even inverse.23,24 Since a meta-analysis is warranted to clarify the association between T2DM and fracture risk, this study provides a systematic review and meta-analysis of association between T2DM and risk of fracture. We also evaluated possible sources of heterogeneity between studies and the risk factors for fracture among diabetic patients, including age, body mass index (BMI), sex, fracture site, duration of diabetes, the effect of diabetes medications, and so on.
Methods
Search strategy
We performed a literature search in reputable databases including PubMed/Medline, Scopus, and Institute for Scientific Information Web of Knowledge from 1980 to May 2016 using special keywords such as “diabetes mellitus”, “type 2 diabetes mellitus”, “glucose”, “insulin”, “fracture”, “bone”, “osteoporosis”, “bone mineral density”, and “risk factors”. In the initial search, all articles that had these keywords in their titles or abstracts were chosen, and other unrelated articles were eliminated. The obtained articles were rechecked by the other expert authors. We also searched bibliographies of retrieved articles for additional references. The human researches only were highlighted. To decrease bias, two authors performed the search, selection of papers, and extracting data of articles independently.
Inclusion and exclusion criteria
All epidemiologic studies presenting cohort and case–control studies on the association between T2DM and fracture risk (low-trauma hip, distal forearm, proximal humerus, ankle, foot, nonvertebral, or vertebral fracture) were considered. Studies were excluded: if they were performed on individuals with type 1 diabetes mellitus or impaired glucose tolerance, if they did not provide data that allowed calculation of standard errors for effect estimates, if they were meta-analyses and systematic reviews. We also excluded studies with duplicate citation. When there were multiple publications from the same population or cohort, only data from the most recent report were included. When necessary, authors were contacted for additional information.
Data extraction
For all studies, the following data were extracted: first author’s name, year of publication, country, study design, sample size, age, sex, BMI, follow-up period (for cohort studies), duration of diabetes, diabetes medications, fracture site and number of cases, risk estimates and corresponding confidence intervals (CIs), factors controlled for by matching or multivariable analysis and adjustment for potential confounders. Two of the authors independently reviewed the abstracts and full articles and collected data according to a standard protocol. Discrepancies were resolved in a joint meeting through discussion. The data were entered into data collection forms and then entered in Microsoft Excel.
Data synthesis and analysis
We used the logarithm of the relative risk (RR) with its standard error for the meta-analysis. The method of DerSimonian and Laird was used for extracting summary RR estimates and the corresponding 95% CIs. The Cochran’s Q, meta-regression, and I2 were used as measures of heterogeneity of the studies. Considering the significant heterogeneity of the studies, the random effects model was applied. We conducted a meta-regression analysis with age, BMI, region, sex, fracture site, duration of follow-up (in cohort studies), and duration of diabetes as independent variables and log RR as the dependent variable to assess sources of heterogeneity. Funnel plots and Egger’s test were used to examine the publication bias. Sensitivity analyses were prespecified. Statistical analyses were carried out with using R software (version 3.2.1) and STATA (version 11.1). P-values <0.05 were considered as significant in heterogeneity tests. All statistical tests were two sided.
Results
In the primary search, about 1,200 titles were retrieved and about 203 were considered relevant and screened. In a secondary screening, 91 papers were excluded based on abstract evaluation. Therefore, 112 articles were retained for detailed full-text evaluation. After full-text evaluation, we excluded another 81 articles of these: six were excluded because of overlapping publication, 17 were duplicated articles, 15 were retrospective and review studies, five were meta-analyses, 12 studies were performed on persons with type 1 diabetes mellitus or impaired glucose tolerance, 21 did not provide data that allowed calculation of standard errors for effect estimates, and five reported only crude data that were not adjusted for age. Finally, 30 epidemiologic studies including two case–control and 28 cohort studies on the association between T2DM and fracture risk and possible risk factors, which were published between 1980 and 2016, were selected for the meta-analysis (Figure 1).15,16,24–51 The characteristics and extracted data from these studies are shown in Table 1.
Figure 1.

Flowchart of the literature search.
Abbreviations: IGT, impaired glucose tolerance; ISI, Institute for Scientific Information; T1DM, type 1 diabetes mellitus.
Table 1.
The characteristics of the studies entered into the meta-analysis
| References | Country | Follow-up period (years)a | Age at enrollment (years)a | BMI (kg/m2)a | T2DM subjects (n) | NDM subjects (n) | T2DM vs NDM (95% CI) results |
|---|---|---|---|---|---|---|---|
| Cohort design | |||||||
| Heath et al24 (1980) | USA | Unknown | <103 | NR | T: 986 | T: 986 | Adjusted RRb Vertebral T: 0.6 (0.3–0.7) Proximal humerus T: 0.6 (0.3–0.9) Distal forearm T: 0.7 (0.5–0.9) Proximal forearm T: 0.8 (0.5–0.9) |
| Meyer et al25 (1993) | Norway | 10.9 | 35–49 | NR | M: 180 F: 118 |
M: 24,333 F: 23,850 |
Adjusted RRc Hip M: 9.4 (2.9–30.5), F: 9.2 (3.4–24.9) |
| Forsen et al26 (1999) | Norway | 9 | ≥50 | 28.5 | M: 220 F: 274 |
M: 13,210 F: 13,685 |
Adjusted RRd Hip M: 1.2 (0.4–3.2), F: 1.8 (1.1–2.9) |
| Ivers et al16 (2001) | Australia | 5 | ≥49 | NR | T: 216 | T: 3,438 | Adjusted RRe All fractures T: 0.9 (0.7–1.2) Hip T: 0.6 (0.2–2.2) Distal forearm T: 0.7 (0.2–2.3) Proximal humerus T: 0.7 (0.2–2.3) Ankle T: 1.1 (0.6–1.9) |
| Nicodemus and Folsom15 (2001) | USA | 11 | 55–69 | 30.5 | F: 1,682 | F: 30,377 | Adjusted RRf Hip F: 1.7 (1.2–2.4) |
| Ottenbacher et al27 (2002) | USA | 7 | ≥65 | NR | T: 690 | T: 2,194 | Adjusted HRg Hip T: 1.5 (1.0–2.3) |
| de Liefde et al28 (2005) | the Netherlands | 6.3±2.3 | ≥55 | 26.8±4.1 | T: 792 M: 309 F: 438 |
T: 5,863 M: 2,382 F: 3,481 |
Adjusted HRh Any nonvertebral T: 1.3 (1.0–1.8), M: 1.6 (0.9–2.9), F: 1.3 (0.9–1.8) Hip T: 1.3 (0.8–2.3), M: 1.3 (0.4–4.2), F: 1.4 (0.8–2.5) Wrist T: 1.4 (0.8–2.4), M: 1.3 (0.4–10.4), F: 1.5 (0.8–2.6) |
| Gerdhem et al29 (2005) | Sweden | 4.6 | 75 | NR | F: 74 | F: 1,058 | RR Any fracture F: 0.8 (0.5–1.3) |
| Strotmeyer et al30 (2005) | USA | 4.5 | 70–79 | T: 566 | T: 2,236 | Adjusted RRi Any fracture T: 1.64 (1.1–2.5) |
|
| Bonds et al31 (2006) | USA | 7 | 64.9±7 | NR | F: 5,285 | F: 88,120 | Adjusted RRj All fracture F: 1.2 (1.1–1.3) Hip F: 1.5 (1.2–1.8) Wrist F: 1.02 (0.85–1.2) Ankle F: 1.1 (0.95–1.9) Foot F: 1.3 (1.07–1.6) Vertebral F: 1.3 (1.0–1.6) |
| Holmberg et al32 (2006) | Sweden | 17 | 27–68 | NR | M: 276 F: 166 |
M: 22,444 F: 10,902 |
Adjusted RRk Any fracture M: 2.4 (1.7–3.4), F: 1.9 (1.3–2.8) Forearm M: 2.2 (0.95–4.8), F: 1.5 (0.7–3.0) Proximal humerus M: 1.1 (0.2–7.9), F: 2.1 (0.8–6.0) Hip M: 6.4 (3.4–11.8), F: 4.0 (1.7–9.4) Ankle M: 1.4 (0.5–4.5), F: 2.4 (1.1–5.4) Vertebral M: 1.1 (0.4–3.5), F: 2.9 (1.3–6.3) |
| Dobnig et al33 (2006) | Australia | 2 | ≥70 | 26.4±4.8 | F: 583 | F: 1,081 | Adjusted HRl Hip F: 1.5 (1.3–1.8) |
| Ahmed et al34 (2006) | Norway | 6 | 25–98 | 28.7 | M: 175 F: 198 |
M: 12,639 F: 14,065 |
Adjusted RRm Any nonvertebral M: 1.2 (0.6–2.5), F: 1.1 (0.7–1.7) Hip M: 1.6 (0.6–4.5), F: 1.9 (1.0–3.5) |
| Janghorbani et al35 (2006) | USA | 20.4±3.4 | 34–59 | 31±6.4 | F: 8,345 | F: 101,343 | Adjusted RRn Hip F: 2.2 (1.8–2.7) |
| Leslie et al36 (2007) | Canada | 10 | ≥20 | NR | T: 82,094; newly diagnosed: 42,874; short duration: 16,081; long duration: 23,139 | T: 236,682 | Adjusted RRo All fractures Newly diagnosed: 0.91 (0.86–0.95) Short term: 1.00 (0.93–1.07) Long term: 1.15 (1.09–1.22) Hip Newly diagnosed: 0.83 (0.75–0.92) Short term: 1.13 (1.00–1.28) Long term: 1.40 (1.28–1.53) |
| Lipscombe et al37 (2007) | Canada | 6.1 | ≥66 | M: 100,322 F: 97,090 |
M: 202,875 F: 198,525 |
Adjusted HRp Hip M: 1.2 (1.1–1.3), F: 1.1 (1.1–1.2) |
|
| Melton et al38 (2008) | USA | 11.8 | 30–97 | T: 1,964 M: 992 F: 972 |
NR | SIR All fractures T: 1.3 (1.2–1.4), M: 1.4 (1.3–1.6), F: 1.3 (1.2–1.6) Hip T: 1.1 (0.9–1.4) Wrist T: 1.2 (0.9–1.5) Vertebral T: 2.8 (2.4–3.2) |
|
| Chen et al39 (2008) | Taiwan | 6 | ≥35 | M: 227,289 F: 257,498 |
M: 227,303 F: 257,303 |
Adjusted HRq Hip M: 1.3 (1.2–1.3), F: 1.7 (1.66–1.8) |
|
| Mancini et al40 (2009) | Italy | 13 | 44–82 | 31 | M: 43 | M: 22 | Adjusted ORr Vertebral M: 6.5 (1.3–38.1) |
| Yamamoto et al41 (2009) | Japan | NR | ≥50 | 23.7±3.5 | M: 161 F: 137 |
M: 76 F: 622 |
OR Vertebral M: 4.73 (2.19–10.2), F: 1.9 (1.1–3.1) |
| Schneider et al42 (2013) | USA | 20 | 45–64 | 31±6.1 | T: 1,195 M: 501 F: 694 |
T: 13,340 M: 5,936 F: 7,404 |
Adjusted HRs All fractures T: 1.74 (1.4–2.2), M: 1.9 (1.5–2.5), F: 1.5 (1.1–2.2) |
| Chung et al43 (2013) | Korea | NR | ≥50 | 25.1±3.5 | F: 2,239 | NR | Adjusted ORt Hip F: 1.03 (1.02–1.04) Vertebral F: 1.03 (1.02–1.04) |
| Oei et al44 (2013) | the Netherlands | 12.2 | ≥55 | 26.9±4 | T: 217 | T: 3,715 | Adjusted HRu All fractures T: 1.5 (1.1–1.9) Hip T: 1.2 (0.6–2.1) Wrist T: 1.7 (1.03–2.9) |
| Reyes et al45 (2014) | Spain | 2.55 | ≥65 | M: 36,865 | M: 149,306 | Adjusted RRv Hip M: 1.9 (1.2–3.1) |
|
| Napoli et al46 (2014) | USA | 9.1 | ≥65 | 29.5±4.4 | M: 801 | M: 3,086 | Adjusted HRw Any nonvertebral M: 1.3 (1.1–1.5) |
| Leslie et al47 (2014) | Canada | 6 | ≥40 | 30.2±6.2 | T: 6,455 | T: 55,958 | Adjusted HRx All fractures T: 1.3 (1.2–1.5) |
| Hothersall et al48 (2014) | Scotland | 2 | 20–84 | T: 180,841 | T: 3,066,000 | Adjusted IRRy Hip M: 0.97 (0.92–1.02), F: 1.05 (1.01–1.10) |
|
| Looker et al49 (2016) | USA | 6.7 | ≥65 | 29.5±0.41 | NHW: 398 NHB: 178 MA: 226 |
NHW: 2,554 NHB: 631 MA: 601 |
Adjusted HRz Non-skull fracture NHW: 1.2 (0.93–1.6) NHB: 1.9 (1.02–3.40) MA: 2.4 (1.5–3.8) |
| Case–control | |||||||
| Kegan et al50 (2002) | USA | NR | ≥45 | NR | T: 1,913 | T: 1,913 | Adjusted ORaa Forearm T: 0.9 (0.7–1.2) Foot T: 1.4 (1.1–1.8) Proximal humerus T: 1.7 (1.2–2.3) |
| Vestergaard et al51 (2005) | Denmark | NR | 43±27 | NR | T: 3,241 | T: 6,375 | Adjusted ORbb Any fracture T: 1.2 (1.1–1.3) Hip T: 1.4 (1.2–1.6) Forearm T: 1.2 (1.01–1.5) Spine T: 1.3 (0.97–1.86) |
Notes:
Data shown as mean, range, or mean ± SD.
Adjusted for age, sex, race, residence, year, and institution.
Adjusted for age, height, BMI, physical activity, stroke, receipt of a disability pension, marriage, and smoking.
Adjusted for age, BMI, and daily smoking.
Adjusted for age, sex, and BMI.
Adjusted for age, BMI, smoking, estrogen use, and waist:hip ratio.
Adjusted for age, BMI, smoking, and previous stroke.
Adjusted for age, sex, BMI, smoking, serum creatinine, visual acuity, falling frequency, lower limb disability.
Adjusted for age, sex, race, site, hip BMD, lean mass, fat mass, and abdominal visceral fat.
Adjusted for age; ethnicity; weight; height; time-dependent history of falls; previous fracture; history of osteoporosis; trouble seeing at baseline; alcohol or tobacco use; calcium and vitamin D intake; exercise; bisphosphonate, estrogen, steroid, insulin, SERM, or thyroid hormone use.
Adjusted for age, BMI, and smoking
Adjusted for age, weight, and calcaneal bone mass.
Adjusted for age, BMI, smoking, and metabolic features (mean blood pressure, HDL, and triglycerides).
Adjusted for age, BMI, physical activity, menopausal status, estrogen use, smoking, daily intake of calcium, vitamin D, and protein.
Adjusted for age, sex, income quintile, area of residence, and ethnicity.
Adjusted for age-group; chronic unstable disease; prior stroke; visual impairment; neuropathy; amputation; treatment with nitrates, statins, anticonvulsants, inhaled corticosteroids, and medications that increase the risk of fall; history of BMD test; and income quintile.
Adjusted for age as a continuous variable, geographic area, and urbanization status.
Adjusted for age and BMI, rosiglitazone plus metformin treatment.
Adjusted for age, sex, race/study center, BMI, sports activity tertile, alcohol consumption, cigarette smoking, glucocorticoid or antidepressant use, and thiazide diuretic use.
Adjusted for age, BMI, duration of diabetes, DM complications, HbA1c, serum creatinine, DM medications, risk factors for osteoporosis (alcohol and smoking), and history of fragility fracture.
Adjusted for age, sex, height, weight, and femoral neck BMD.
Adjusted for age, BMI, smoking, alcohol consumption, use of oral corticosteroids, and comorbid conditions.
Adjusted for age, race, clinic site, total hip BMD.
Adjusted for WHO Fracture Risk Assessment (FRAX™) tool including femoral neck BMD.
Adjusted for age, sex, survey, BMI, self-rated physical activity compared to others, hospital visits in past year, and smoking.
Adjusted for age, sex, and race/ethnicity.
Adjusted for the variables in the table plus prior fracture, corticosteroid use, use of antiepileptic drugs, use of diuretics (loop, thiazide, potassium-sparing, other types), use of anxiolytics and sedatives, use of neuroleptics, use of antidepressants, alcoholism, use of statins and non-statin cholesterol-lowering drugs, use of antihypertensives, myocardial infarction, stroke, number of bed days in 1999, number of contacts to GP or specialists in 1999, working or not, income, living with another person vs living alone.
Abbreviations: BMD, bone mineral density; BMI, body mass index; CI, confidence interval; DM, diabetes mellitus; F, female; GP, general practitioner; HbA1c, glycated hemoglobin; HR, hazard ratio; IRR, incidence risk ratio; M, male; MA, Mexican American; NDM, nondiabetic subjects; NHB, non-Hispanic Black; NHW, non-Hispanic white; NR, not reported; OR, odds ratio; RR, relative risk; SERM, selective estrogen-receptor modulator; SIR, standardized incidence ratio; T2DM, type 2 diabetes mellitus; T, total; WHO, World Health Organization.
We included both the case–control studies and the 28 cohort studies in the primary meta-analysis. Due to severe heterogeneity of the reported prevalence (P<0.001), meta-analysis was performed by using a random effects method.
Considering all the included studies, the total number of participants and incident cases of fracture were 5,815,277 and 113,203, respectively.
Table 2 shows a summary of the RR estimates from the included studies of the association between T2DM and fracture incidence. Fifteen of 30 studies had reported the association between T2DM and hip fracture incidence. We found a statistically significant positive association between T2DM and hip fracture incidence (summary RR =1.20, 95% CI: 1.17–1.23; Figure 2). Also, the association between T2DM and fracture of the vertebral (summary RR =1.16, 95% CI: 1.05–1.28) or foot (summary RR =1.37, 95% CI: 1.21–1.54) was statistically significant (Table 2).
Table 2.
Summary relative risk estimates from case–control and cohort studies of the association between type 2 diabetes mellitus and fractures incidence using meta-analysis methods
| Type of fractures | Number of studies | Summary relative risk | 95% confidence interval | Between studies
|
|
|---|---|---|---|---|---|
| I2 (%) | P for heterogeneity | ||||
| Hip fractures | 15 | 1.20 | 1.17–1.23 | 85.5 | 0.000 |
| Wrist fractures | 10 | 0.98 | 0.88–1.07 | 61.3 | 0.006 |
| Vertebral fractures | 9 | 1.16 | 1.05–1.28 | 95.9 | 0.000 |
| Proximal humerus | 5 | 1.09 | 0.86–1.31 | 84.0 | 0.000 |
| Ankle fractures | 3 | 1.13 | 0.95–1.32 | 0.0 | 0.762 |
| Foot fractures | 3 | 1.37 | 1.21–1.54 | 0.0 | 0.90 |
| All fractures, total | 27 | 1.17 | 1.15–1.20 | 85.5 | 0.000 |
Figure 2.

The results of meta-analysis of the association between type 2 diabetes mellitus and risk of hip fracture.
Notes: Each square shows the study specific relative risk estimate. Square sizes are proportional to the weight assigned to the study in the meta-analysis and the horizontal line shows the related 95% CI. The diamond shows the summary relative risk estimate and its width represents the corresponding 95% CI. All statistical tests were two sided. Statistical heterogeneity between studies was assessed with Cochran’s Q test. Meta-analysis was performed by using a random effects method.
Abbreviations: CI, confidence interval; ES, effect size.
As seen in Figure 3, there was no significant association between T2DM and wrist fracture incidence. Ten of 30 studies had reported the association between T2DM and wrist fracture incidence, and the summary RR for all 10 studies combined was 0.98 (95% CI: 0.88–1.07; Figure 3). Also, we found no association between T2DM and fracture of the proximal humerus (summary RR =1.09, 95% CI: 0.86–1.31) or ankle (summary RR =1.13, 95% CI: 0.95–1.32; Table 2).
Figure 3.

The results of meta-analysis of the association between type 2 diabetes mellitus and risk of wrist fracture.
Notes: Each square shows the study specific relative risk estimate. Square sizes are proportional to the weight assigned to the study in the meta-analysis and the horizontal line shows the related 95% CI. The diamond shows the summary relative risk estimate and its width represents the corresponding 95% CI. All statistical tests were two sided. Statistical heterogeneity between studies was assessed with Cochran’s Q test. Meta-analysis was performed by using a random effects method.
Abbreviations: CI, confidence interval; ES, effect size.
Figure 4 shows the individual study results and the overall summary results for the included studies of T2DM and overall fracture incidence. As observed in the figure, there was a statistically significant positive association between T2DM and overall fracture (summary RR =1.05, 95% CI: 1.04–1.06).
Figure 4.

The results of meta-analysis of association between type 2 diabetes mellitus and risk of overall fractures.
Notes: Each square shows the study specific relative risk estimate. Square sizes are proportional to the weight assigned to the study in the meta-analysis and the horizontal line shows the related 95% CI. The diamond shows the summary relative risk estimate and its width represents the corresponding 95% CI. All statistical tests were two sided. Statistical heterogeneity between studies was assessed with Cochran’s Q test. Meta-analysis was performed by using a random effects method.
Abbreviations: CI, confidence interval; ES, effect size.
We also conducted subgroup meta-analyses for the most important known confounders and for risk factors that have an influence on the association between T2DM and fracture risk. Table 3 gives the summary RR and P-value estimates from the included studies for incident fracture according to the risk factors.
Table 3.
Risk factors for the association between type 2 diabetes and fracture risk
| Subgroup | Studies (n) | Summary relative risk | 95% confidence interval | Between studies
|
Between subgroups
|
||
|---|---|---|---|---|---|---|---|
| I2 (%) | P for heterogeneity | I2 (%) | P for heterogeneity | ||||
| Age (years) | |||||||
| 50–59 | 5 | 1.17 | 1.15–1.21 | 94.7 | 0.000 | 85.5 | <0.001 |
| 60–69 | 12 | 1.20 | 1.10–1.30 | 81.2 | 0.000 | ||
| ≥70 | 12 | 1.30 | 1.21–1.40 | 45.7 | 0.005 | ||
| Sex | |||||||
| Female | 7 | 1.44 | 1.18–1.70 | 91.3 | 0.000 | 91.3 | 0.043 |
| Male | 3 | 1.90 | 1.3–2.58 | 0.00 | 0.000 | ||
| BMI (kg/m2) | |||||||
| <30 | 11 | 1.44 | 1.24–1.65 | 29.5 | 0.193 | 92.6 | <0.001 |
| ≥30 | 11 | 1.30 | 1.22–1.37 | 72.5 | 0.000 | ||
| Geographic area | |||||||
| Europe | 11 | 1.10 | 1.03–1.13 | 69.8 | 0.000 | 90.6 | 0.29 |
| North America | 17 | 1.18 | 1.15–1.20 | 85.5 | 0.000 | ||
| Asia | 3 | 1.24 | 1.14–1.40 | 90.6 | 0.000 | ||
| Australia | 2 | 1.18 | 1.0–1.36 | 91.7 | 0.000 | ||
| Follow-up period, years | |||||||
| <10 | 21 | 1.19 | 1.16–122 | 83.2 | 0.000 | 89.9 | 0.004 |
| ≥10 | 8 | 1.13 | 1.08–1.18 | 89.9 | 0.000 | ||
| Duration of diabetes, years | |||||||
| <10 | 6 | 1.00 | 0.93–1.06 | 78.2 | 0.003 | 93.2 | <0.001 |
| ≥10 | 6 | 1.19 | 1.13–1.25 | 93.2 | 0.000 | ||
| Physical activity | 3 | 0.75 | 0.65–0.85 | 92.4 | 0.000 | NR | NR |
| Smoking status | 3 | 1.29 | 0.92–1.88 | 92.0 | 0.000 | NR | NR |
| Users of systemic corticosteroids | 3 | 1.51 | 1.29–1.72 | 38.6 | 0.196 | NR | NR |
| Insulin therapy | 11 | 1.52 | 1.42–1.61 | 4.8 | 0.393 | NR | NR |
| Treated with thiazolidinediones | 3 | 0.75 | 0.60–0.91 | 0.0 | 0.513 | NR | NR |
Abbreviations: BMI, body mass index; NR, not reported.
The association of T2DM with fracture risk differed by age, although diabetes was associated with a significantly higher risk of fractures for all age subgroups; the risk of fracture was increased with age (continuous; summary RR =1.10, 95% CI: 1.07–1.13). Also, effect modification was much greater in the oldest subgroup, with progressively less effect modification in younger age subgroups (summary RR age 50–59 years 1.17 [95% CI: 1.15–1.21], age 60–69 years 1.20 [95% CI: 1.10–1.30], age ≥70 years 1.30 [95% CI: 1.21–1.40]); there was heterogeneity among studies by age (P for heterogeneity [Phet] <0.001; Table 3).
The result of our meta-analysis showed increased risk of overall fractures in diabetic men compared with diabetic women (Phet =0.043; Table 3).
For BMI, the estimation of summary was stronger for BMI <30 kg/m2 (summary RR =1.44, 95% CI: 1.24–1.64) than for BMI ≥30 kg/m2 (summary RR =1.30, 95% CI: 1.22–1.37; Phet<0.001; Table 3).
We conducted subgroup meta-analyses by region. Twelve studies were conducted in the USA,15,24,27,28,31,32,36,39,43,47,50,51 three in Canada,37,38,48 11 in Europe,25,26,29,30,33,35,41,45,46,49,52 three in Asia,40,42,44 and two in Australia.16,34 Results were consistent by geographic area (Phet =0.29; Table 3).
The estimation of summary for incident fracture according to duration of diabetes was stronger with 10 or more years of diabetes (summary RR =1.0, 95% CI: 0.93–1.6) than diabetes duration of <10 years (RR =1.19, 95% CI: 1.13–1.26); there was heterogeneity by duration of diabetes (<10 years vs ≥10 years; Phet <0.001; Table 3).
Finally, the estimation of summary was stronger with follow-up durations of <10 years (RR =1.19, 95% CI: 1.16–1.22) than 10 or more years of follow-up (summary RR =1.13, 95% CI: 1.08–1.18; Phet =0.004; Table 3).
The results of meta-analysis of association of T2DM with fracture risk by physical activity showed a significant inverse association between T2DM and fracture (summary RR =0.75, 95% CI: 0.65–0.86) and that physical activity was associated with a decrease risk for fracture incidence in diabetic patients and might be more protective in this regard. We found no significant association between T2DM and fracture incidence by smoking status (summary RR =1.29, 95% CI: 0.92–1.88). Insulin therapy and use of systemic corticosteroids were associated with an increased fracture risk; the summary of estimation was 1.52 (95% CI: 1.42–1.61) for insulin therapy and 1.51 (95% CI: 1.29–1.72) for use of systemic corticosteroids. Also, treatment with thiazolidinediones (TZDs) was not associated with an increase fracture risk (summary RR =0.75, 95% CI: 0.60–0.91; Table 3).
According to the publication bias tests, the effect of bias in these studies was not significant. P-values for Egger’s regression asymmetry test were 0.32. Figure 5 presents the Begg’s funnel plot of the included trials related to the risk of factors in diabetic patients. Regression analysis of this plot indicated no significant asymmetry (P≥0.05) and thus no evidence of bias (Figure 5).
Figure 5.
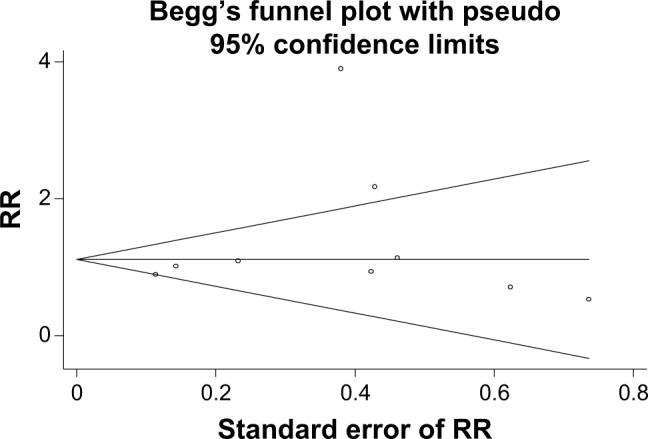
Begg’s funnel plot for publication bias in the risk difference analysis.
Abbreviation: RR, relative risk.
Interpretation of meta-regression showed that there was no significant relationship between the risk factors in diabetic patients and the year of study (P≥0.05; Figure 6).
Figure 6.

The meta-regression analysis of the relationship between the risk of factors in diabetic patients and the year of study.
Abbreviations: CI, confidence interval; Coef, coefficient of variation; REML, restricted (or residual) maximum likelihood estimation; RR, relative risk.
Discussion
Osteoporotic fractures and diabetes mellitus (DM) continue to be important medical, social, and economic concerns to the society. Our study gives an overall picture of the risk of any fracture in people with T2DM. The risks reported from previous studies of people with T2DM vary substantially. In some studies, diabetes was significantly associated with an increased risk for hip fractures,25,27,32,36,37,39,51 wrist fractures,44,51 proximal humerus fractures,38,50 vertebral fractures,31,38,40,41,43 and overall fractures.30–32,38,42,44,47,51 In contrast, other studies have found no association between diabetes with hip fractures,16,24,26,28,34,38,44,48 wrist fractures,16,24,28,29,31,32,38,50 proximal humerus fractures,16,24,32 vertebral fractures,24,29,32,51 or overall fractures.16,29 We found an association between T2DM and overall fracture (summary RR =1.05, 95% CI: 1.04–1.06). These results strongly agreed with previous meta-analysis studies that showed an increase risk of fractures in T2DM patients.11,14 Janghorbani et al, in a meta-analysis of case–control and cohort studies, confirmed a 1.2 (95% CI: 1.01–1.5) RR for any fracture and 1.7 (95% CI: 1.3–2.2) RR for hip fracture in both men and women suffering from T2DM.14 Vestergaard11 combined studies up to 2007 in a meta-analysis and concluded that the risk ratio for hip fracture in T2DM was 1.38 (95% CI: 1.25–1.53). The observed differences in RR between the oldest and most recent meta-analyses discussed were small. Thus, the estimation from meta-analyses of fracture RR in T2DM showed a statistically significant positive association between T2DM and fracture incidence.
T2DM and fracture share similar and opposing risk factors. In our effort to identify the variables contributing to the higher risk of fracture among diabetic patients, we found a range of risk factors for fracture that are also associated with diabetes. In accordance with previous studies, some of the risk factors identified were increasing age, sex, BMI, physical activity, smoking status, duration of diabetes, and glycemic control.
The results of our meta-analysis showed that the incidence of fractures increased with age and duration of diabetes. Studies showed that patients’ age and duration of diabetes were negatively correlated with insulin-like growth factor-1 (IGF-1), and serum IGF-1 levels were negatively associated with increased risk of fractures in diabetic patients.52 Thus, the incidence of fractures may increase with age and duration of diabetes in diabetic patients.
We found that diabetic men had an increased risk of overall fractures compared with diabetic women (Phet =0.043). Meta-analysis conducted by Janghorbani et al14 indicated that fracture risk was relatively higher in T2DM men than in T2DM women. The results of these meta-analysis studies could have easily been due to chance, because in these studies, the number of cases in men was relatively small.
Some studies have found that 21%–64% of T2DM men have hypogonadism, with higher prevalence rates in the elderly.53,54 Thus, we can say that the presence of DM may cause hypogonadism and may be one of the risk factors of secondary osteoporosis, especially in elderly men. Furthermore, several studies have shown that the RR of fractures in men is significantly increased with smoking, alcohol consumption, anticonvulsant treatment, physical inactivity, and low free androgen index.55,56
Evidence regarding a direct relation of better glycemic control with reduced risk of fracture is very weak.16 We were not able to evaluate the possible impact of all blood glucose-lowering drugs because of the limitations of the available data. Our findings showed an increased risk of fracture in those using insulin or systemic corticosteroids. There was also no increased risk with TZD use. The use of TZDs has been associated with an increased fracture risk in both T2DM men and women. TZDs could have a negative effect on bone quality, since they suppress the differentiation of mesenchymal stem cells into osteoblasts in favor of differentiation to adipocytes.57–59 Some previous studies have reported an increased risk of fracture in those using insulin.34,38,60,61 This increased fracture risk was most probably due to an increased risk of falls because of hypoglycemic events which may impair the bone quality in the diabetic skeleton and also because insulin is often used in patients with diabetes of longer duration, thus diabetic patients are likely to have long-term negative hyperglycemic effects on bone quality that lead to increased fracture risk.62–64
The mechanisms whereby diabetes increases the fracture risk are not entirely clear. A possible cause of the increased risk of fracture in T2DM is diabetes-related comorbidity, such as diabetic retinopathy, peripheral neuropathy, and cerebral stroke or hypoglycemia, which may increase the risk of falling.14,43,65,66 It has been hypothesized that physiologic changes resulting from chronic hyperglycemia could degrade the bone quality through inhibition of osteocalcin, increased reactive oxygen species, accumulation of advanced glycation end products in bone, or inhibition of IGF-1.67 In addition, other factors related to T2DM, such as the micro-vascular and macrovascular complications, oxidative stress, renal dysfunction, elevated renal calcium loss, and persistent inflammation present in T2DM, may further impair bone health and increase fracture risk.46 It is documented that poor nerve function is a cause of falls68 and that an increased risk of fractures is associated with DM retinopathy, longer DM duration, and insulin treatment.16 Thus, these DM-related complications increase fracture risk.
The combination of poor bone quality and frequent falls would be expected to increase the risk of fracture independently of BMD.16 In some studies with T2DM women, lower total hip BMD was significantly associated with higher risk of fractures, even after adjustment for multiple covariates.43 In contrast, some studies reported lack of statistical association between BMD and fractures in subjects with T2DM.41 From these observations, the authors concluded that BMD was not sensitive enough to assess the risk of fracture in subjects with T2DM.43 A meta-analysis also showed that T2DM patients had higher hip BMD than non-DM controls, despite an increased risk of hip fracture, suggesting that BMD values may not reflect bone fragility in T2DM.11
It has been hypothesized that the complications of diabetes (peripheral neuropathy, peripheral vascular disease), diabetes treatment (insulin), or both could increase the risk of falls and fractures.69,70
Limitations
Our results have important clinical and public health implications; it will further contribute to the public health burden of any fractures. Also, our meta-analysis had several limitations. In this meta-analysis, we were unable to conduct separate analyses by ethnicity; insufficient available data about association between T2DM and fracture by ethnicity prevented us from the evaluation of such cases. Other limitation is the lack of information on BMD, which could explain part of the observed associations. Thus, it was not possible for us to evaluate the impact of controlling for BMD on the relation between diabetes and fracture risk. Furthermore, some included studies did not enjoy acceptable quality or presented defective quantitative data that could not be included in the meta-analysis. Finally, some studies associated with diabetes and fracture risk were not accessible.
Conclusion
This study gives an overall picture of the risk of all fractures in people with T2DM. Our findings showed a positive association between T2DM and hip fractures, vertebral fractures, and foot fractures. We also found no association between T2DM and wrist fractures, proximal humerus fractures, or ankle fractures. Overall, the results of this meta-analysis strongly support an association between T2DM and increased risk of any fracture. With a worldwide increasing prevalence of diabetes, the contribution of diabetes to the incidence of low-trauma fracture may increase.
In our effort to identify the variables contributing to the higher risk of fracture among diabetic patients, we found a range of risk factors for fracture that are also associated with diabetes. The incidence of fractures increased with age and was higher in T2DM men than in T2DM women. According to the results, the expected rate of BMD loss in bones in diabetics seems to be higher than in nondiabetics. But in some studies, this trend was reversed. Due to limited data on BMI studies, our analysis showed that patients with T2DM have higher BMI and have lesser risk of fracture. Also, elevated RRs are seen in those with longer diabetes duration and in those using insulin and systemic corticosteroids. These findings emphasize the need for developing risk prediction models in order to avoid systematically underestimating the risk of osteoporosis-related fracture in patients with diabetes. Also, our findings emphasize the need for fracture prevention strategies in patients with T2DM.
Acknowledgments
The authors are grateful to the Deputy of Research and Technology, Ilam University of Medical Sciences for their support.
Footnotes
Disclosure
The authors report no conflicts of interest in this work.
References
- 1.Jackuliak P, Payer J. Osteoporosis, fractures, and diabetes. Int J Endocrinol. 2014;2014:820615. doi: 10.1155/2014/820615. [DOI] [PMC free article] [PubMed] [Google Scholar]
- 2.de Waard EA, van Geel TA, Savelberg HH, Koster A, Geusens PP, van den Bergh JP. Increased fracture risk in patients with type 2 diabetes mellitus: an overview of the underlying mechanisms and the usefulness of imaging modalities and fracture risk assessment tools. Maturitas. 2014;79(3):265–274. doi: 10.1016/j.maturitas.2014.08.003. [DOI] [PubMed] [Google Scholar]
- 3.American Diabetes Association Diagnosis and classification of diabetes mellitus. Diabetes Care. 2012;35(Suppl 1):64–71. doi: 10.2337/dc12-s064. [DOI] [PMC free article] [PubMed] [Google Scholar]
- 4.Schwartz AV. Diabetes mellitus: does it affect bone? Calcif Tissue Int. 2003;73(6):515–519. doi: 10.1007/s00223-003-0023-7. [DOI] [PubMed] [Google Scholar]
- 5.Milczarczyk A, Franek E. Osteoporosis and bone fractures in patients with diabetes mellitus. Diabet Dosw i Klin. 2008;8(2):63–67. [Google Scholar]
- 6.Hamann C, Kirschner S, Gunther KP, Hofbauer LC. Bone, sweet bone-osteoporotic fractures in diabetes mellitus. Nat Rev Endocrinol. 2012;8(5):297–305. doi: 10.1038/nrendo.2011.233. [DOI] [PubMed] [Google Scholar]
- 7.Dede AD, Tournis S, Dontas I, Trovas G. Type 2 diabetes mellitus and fracture risk. Metabolism. 2014;63(12):1480–1490. doi: 10.1016/j.metabol.2014.09.002. [DOI] [PubMed] [Google Scholar]
- 8.van Staa TP, Dennison EM, Leufkens HG, Cooper C. Epidemiology of fractures in England and Wales. Bone. 2001;29(6):517–522. doi: 10.1016/s8756-3282(01)00614-7. [DOI] [PubMed] [Google Scholar]
- 9.Blanchard JF, Ludwig S, Wajda A, et al. Incidence and prevalence of diabetes in Manitoba, 1986–1991. Diabetes Care. 1996;19(8):807–811. doi: 10.2337/diacare.19.8.807. [DOI] [PubMed] [Google Scholar]
- 10.Wild S, Roglic G, Green A, Sicree R, King H. Global prevalence of diabetes: estimates for the year 2000 and projections for 2030. Diabetes Care. 2004;27(5):1047–1053. doi: 10.2337/diacare.27.5.1047. [DOI] [PubMed] [Google Scholar]
- 11.Vestergaard P. Discrepancies in bone mineral density and fracture risk inpatients with type 1 and type 2 diabetes–a meta-analysis. Osteoporos Int. 2007;18(4):427–444. doi: 10.1007/s00198-006-0253-4. [DOI] [PubMed] [Google Scholar]
- 12.Schwartz AV, Vittinghoff E, Bauer DC, et al. Association of BMD and FRAX score with risk of fracture in older adults with type 2 diabetes. JAMA. 2011;305(21):2184–2192. doi: 10.1001/jama.2011.715. [DOI] [PMC free article] [PubMed] [Google Scholar]
- 13.Ma L, Oei L, Jiang L, et al. Association between bone mineral density and type 2 diabetes mellitus: a meta-analysis of observational studies. Eur J Epidemiol. 2012;27(5):319–332. doi: 10.1007/s10654-012-9674-x. [DOI] [PMC free article] [PubMed] [Google Scholar]
- 14.Janghorbani M, Van Dam RM, Willett WC, Hu FB. Systematic review of type 1 and type 2 diabetes mellitus and risk of fracture. Am J Epidemiol. 2007;166(5):495–505. doi: 10.1093/aje/kwm106. [DOI] [PubMed] [Google Scholar]
- 15.Nicodemus KK, Folsom AR, Iowa Women’s Health Study Type 1 and type 2 diabetes and incident hip fractures in postmenopausal women. Diabetes Care. 2001;24(7):1192–1197. doi: 10.2337/diacare.24.7.1192. [DOI] [PubMed] [Google Scholar]
- 16.Ivers RQ, Cumming RG, Mitchell P, Peduto AJ, Blue Mountains Eye Study Diabetes and risk of fracture: the Blue Mountains Eye Study. Diabetes Care. 2001;24(7):1198–1203. doi: 10.2337/diacare.24.7.1198. [DOI] [PubMed] [Google Scholar]
- 17.Hofbauer LC, Brueck CC, Singh SK, Dobnig H. Osteoporosis in patients with diabetes mellitus. J Bone Miner Res. 2007;22(9):1317–1328. doi: 10.1359/jbmr.070510. [DOI] [PubMed] [Google Scholar]
- 18.Korpelainen R, Korpelainen J, Heikkinen J, Vaananen K, Keinanen- Kiukaanniemi S. Lifestyle factors are associated with osteoporosis in lean women but not in normal and overweight women: a population-based cohort study of 1,222 women. Osteoporos Int. 2003;14(1):34–43. doi: 10.1007/s00198-002-1319-6. [DOI] [PubMed] [Google Scholar]
- 19.Kelsey JL, Browner WS, Seeley DG, Nevitt MC, Cummings SR. Risk factors for fractures of the distal forearm and proximal humerus. The Study of Osteoporotic Fractures Research Group. Am J Epidemiol. 1992;135(5):477–489. doi: 10.1093/oxfordjournals.aje.a116314. [DOI] [PubMed] [Google Scholar]
- 20.Melton LJ, 3rd, Achenbach SJ, O’Fallon WM, Khosla S. Secondary osteoporosis and the risk of distal forearm fractures in men and women. Bone. 2002;31(1):119–125. doi: 10.1016/s8756-3282(02)00788-3. [DOI] [PubMed] [Google Scholar]
- 21.Vogt MT, Cauley JA, Tomaino MM, Stone K, Williams JR, Herndon JH. Distal radius fractures in older women: a 10-year follow-up study of descriptive characteristics and risk factors. The Study of Osteoporotic Fractures. J Am Geriatr Soc. 2002;50(1):97–103. doi: 10.1046/j.1532-5415.2002.50014.x. [DOI] [PubMed] [Google Scholar]
- 22.Tuominen JT, Impivaara O, Puukka P, Ronnemaa T. Bone mineral density in patients with type 1 and type 2 diabetes. Diabetes Care. 1999;22(7):1196–1200. doi: 10.2337/diacare.22.7.1196. [DOI] [PubMed] [Google Scholar]
- 23.Van Daele PLA, Stolk RP, Burger H, et al. Bone density in non-insulin-dependent diabetes mellitus. Ann Intern Med. 1995;122(6):409–414. doi: 10.7326/0003-4819-122-6-199503150-00002. [DOI] [PubMed] [Google Scholar]
- 24.Heath H, 3rd, Melton LJ, 3rd, Chu CP. Diabetes mellitus and risk of skeletal fracture. N Engl J Med. 1980;303(10):567–570. doi: 10.1056/NEJM198009043031008. [DOI] [PubMed] [Google Scholar]
- 25.Meyer HE, Tverdal A, Falch JA. Risk factors for hip fracture in middle-aged Norwegian women and men. Am J Epidemiol. 1993;137(11):1203–1211. doi: 10.1093/oxfordjournals.aje.a116622. [DOI] [PubMed] [Google Scholar]
- 26.Forsen L, Meyer HE, Midthjell K, Edna TH. Diabetes mellitus and the incidence of hip fracture: results from the Nord-Trøndelag Health Survey. Diabetologia. 1999;42(8):920–925. doi: 10.1007/s001250051248. [DOI] [PubMed] [Google Scholar]
- 27.Ottenbacher KJ, Ostir GV, Peek MK, Goodwin JS, Markides KS. Diabetes mellitus as a risk factor for hip fracture in Mexican-American older adults. J Gerontol A Biol Sci Med Sci. 2002;57(10):M648–M653. doi: 10.1093/gerona/57.10.m648. [DOI] [PubMed] [Google Scholar]
- 28.de Liefde II, van der Klift M, de Laet CE, van Daele PL, Hofman A, Pols HA. Bone mineral density and fracture risk in type-2 diabetes mellitus: the Rotterdam Study. Osteoporos Int. 2005;16(12):1713–1720. doi: 10.1007/s00198-005-1909-1. [DOI] [PubMed] [Google Scholar]
- 29.Gerdhem P, Isaksson A, Akesson K, Obrant KJ. Increased bone density and decreased bone turnover, but no evident alteration of fracture susceptibility in elderly women with diabetes mellitus. Osteoporos Int. 2005;16(12):1506–1512. doi: 10.1007/s00198-005-1877-5. [DOI] [PubMed] [Google Scholar]
- 30.Strotmeyer ES, Cauley JA, Schwartz AV, Nevitt MC, Resnick HE, Bauer DC. Nontraumatic fracture risk with diabetes mellitus and impaired fasting glucose in older white and black adults: the health, aging, and body composition study. Arch Intern Med. 2005;165(14):1612–1617. doi: 10.1001/archinte.165.14.1612. [DOI] [PubMed] [Google Scholar]
- 31.Bonds DE, Larson JC, Schwartz AV, et al. Risk of fracture in women with type 2 diabetes: the Women’s Health Initiative Observational Study. J Clin Endocrinol Metab. 2006;91(9):3404–3410. doi: 10.1210/jc.2006-0614. [DOI] [PubMed] [Google Scholar]
- 32.Holmberg AH, Johnell O, Nilsson PM, Nilsson J, Berglund G, Akesson K. Risk factors for fragility fracture in middle age. A prospective population-based study of 33,000 men and women. Osteoporos Int. 2006;17(7):1065–1077. doi: 10.1007/s00198-006-0137-7. [DOI] [PubMed] [Google Scholar]
- 33.Dobnig H, Piswanger-Solkner JC, Roth M, et al. Type 2 diabetes mellitus in nursing home patients: effects on bone turnover, bone mass, and fracture risk. J Clin Endocrinol Metab. 2006;91(9):3355–3363. doi: 10.1210/jc.2006-0460. [DOI] [PubMed] [Google Scholar]
- 34.Ahmed LA, Joakimsen RM, Berntsen GK, Fonnebo V, Schirmer H, et al. Diabetes mellitus and the risk of non-vertebral fractures: the Tromsø Study. Osteoporos Int. 2006;17(4):495–500. doi: 10.1007/s00198-005-0013-x. [DOI] [PubMed] [Google Scholar]
- 35.Janghorbani M, Feskanich D, Willett WC, Hu F. Prospective study of diabetes mellitus and risk of hip fracture: the Nurses’ Health Study. Diabetes Care. 2006;29(7):1573–1578. doi: 10.2337/dc06-0440. [DOI] [PubMed] [Google Scholar]
- 36.Leslie W, Lix L, Prior H, Derksen Sh, Metge C, O’Neil J. Biphasic fracture risk in diabetes: a population-based study. Bone. 2007;40(6):1595–1601. doi: 10.1016/j.bone.2007.02.021. [DOI] [PubMed] [Google Scholar]
- 37.Lipscombe L, Jamal S, Booth G, Kawker G. The risk of hip fractures in older individuals with diabetes. Diabetes Care. 2007;30(4):835–841. doi: 10.2337/dc06-1851. [DOI] [PubMed] [Google Scholar]
- 38.Melton LJ, Leibson CL, Achenbach SJ, Therneau TM, Khosla S. Fracture risk in type 2 diabetes: update of a population-based study. J Bone Miner Res. 2008;23(8):1334–1342. doi: 10.1359/JBMR.080323. [DOI] [PMC free article] [PubMed] [Google Scholar]
- 39.Chen HF, Ho CA, Li CY. Increased risks of hip fracture in diabetic patients of Taiwan. Diabetes Care. 2008;31(1):75–80. doi: 10.2337/dc07-1072. [DOI] [PubMed] [Google Scholar]
- 40.Mancini T, Mazziotti G, Doga M, et al. Vertebral fractures in males with type 2 diabetes treated with rosiglitazone. Bone. 2009;45(4):784–788. doi: 10.1016/j.bone.2009.06.006. [DOI] [PubMed] [Google Scholar]
- 41.Yamamoto M, Yamaguchi T, Yamauchi M, Kaji H, Sugimoto T. Diabetic patients have an increased risk of vertebral fractures independent of BMD or diabetic complications. J Bone Miner Res. 2009;24(4):702–709. doi: 10.1359/jbmr.081207. [DOI] [PubMed] [Google Scholar]
- 42.Schneider A, Williams E, Brancati F, Blecker S, Coresh J, Selvin E. Diabetes and risk of fracture-related hospitalization: the atherosclerosis risk in communities study. Diabetes Care. 2013;36(5):1153–1158. doi: 10.2337/dc12-1168. [DOI] [PMC free article] [PubMed] [Google Scholar]
- 43.Chung DJ, Choi HJ, Chung YS, Lim SK, Yang SO, Shin CS. The prevalence and risk factors of vertebral fractures in Korean patients with type 2 diabetes. J Bone Miner Metab. 2013;31(2):161–168. doi: 10.1007/s00774-012-0398-5. [DOI] [PubMed] [Google Scholar]
- 44.Oei L, Zillikens M, Dehghan A, et al. High bone mineral density and fracture risk in type 2 diabetes as skeletal complications of inadequate glucose control: the Rotterdam Study. Diabetes Care. 2013;36(6):1619–1628. doi: 10.2337/dc12-1188. [DOI] [PMC free article] [PubMed] [Google Scholar]
- 45.Reyes C, Estrada P, Nogués X, et al. The impact of common co-morbidities (as measured using the Charlson index) on hip fracture risk in elderly men: a population-based cohort study. Osteoporos Int. 2014;25(6):1751–1758. doi: 10.1007/s00198-014-2682-9. [DOI] [PubMed] [Google Scholar]
- 46.Napoli N, Strotmeyer ES, Ensrud KE, et al. Fracture risk in diabetic elderly men: the MrOS study. Diabetologia. 2014;57(10):2057–2065. doi: 10.1007/s00125-014-3289-6. [DOI] [PMC free article] [PubMed] [Google Scholar]
- 47.Leslie WD, Morin SN, Lix LM, Majumdar SR. Does diabetes modify the effect of FRAX risk factors for predicting major osteoporotic and hip fracture? Osteoporos Int. 2014;25(12):2817–2824. doi: 10.1007/s00198-014-2822-2. [DOI] [PubMed] [Google Scholar]
- 48.Hothersall EJ, Livingstone SJ, Looker HC, et al. Contemporary risk of hip fracture in type 1 and type 2 diabetes: a national registry study from Scotland. J Bone Miner Res. 2014;29(5):1054–1060. doi: 10.1002/jbmr.2118. [DOI] [PMC free article] [PubMed] [Google Scholar]
- 49.Looker AC, Eberhardt MS, Saydah SH. Diabetes and fracture risk in older U.S. adults. Bone. 2016;82:9–15. doi: 10.1016/j.bone.2014.12.008. [DOI] [PMC free article] [PubMed] [Google Scholar]
- 50.Kegan TH, Kelsey JL, Sidney S, Quesenberry CP. Foot problems as risk factors of fractures. Am J Epidemiol. 2002;155(10):926–931. doi: 10.1093/aje/155.10.926. [DOI] [PubMed] [Google Scholar]
- 51.Vestergaard P, Rejnmark L, Mosekilde L. Relative fracture risk in patients with diabetes mellitus, and the impact of insulin and oral antidiabetic medication on relative fracture risk. Diabetologia. 2005;48(7):1292–1299. doi: 10.1007/s00125-005-1786-3. [DOI] [PubMed] [Google Scholar]
- 52.Kanazawa I, Yamaguchi T, Sugimoto T. Serum insulin-like growth factor-I is negatively associated with serum adiponectin in type 2 diabetes mellitus. Growth Horm IGF Res. 2011;21(5):268–271. doi: 10.1016/j.ghir.2011.07.004. [DOI] [PubMed] [Google Scholar]
- 53.Tan RS, Pu SJ. Impact of obesity on hypogonadism in the andropause. Int J Androl. 2002;25(4):195–201. doi: 10.1046/j.1365-2605.2002.00356.x. [DOI] [PubMed] [Google Scholar]
- 54.Barrett-Connor E, Khaw KT, Yen SS. Endogenous sex hormone levels in older adult men with diabetes mellitus. Am J Epidemiol. 1990;132(5):895–901. doi: 10.1093/oxfordjournals.aje.a115732. [DOI] [PubMed] [Google Scholar]
- 55.Seeman E, Melton LJ, 3rd, O’Fallon WM, Riggs BL. Risk factors for spinal osteoporosis in men. Am J Med. 1983;75(6):977–983. doi: 10.1016/0002-9343(83)90878-1. [DOI] [PubMed] [Google Scholar]
- 56.Scane AC, Francis RM, Sutcliffe AM, Francis MJ, Rawlings DJ, Chapple CL. Case-control study of the pathogenesis and sequelae of symptomatic vertebral fractures in men. Osteoporos Int. 1999;9(1):91–97. doi: 10.1007/s001980050120. [DOI] [PubMed] [Google Scholar]
- 57.Yaturu S, Bryant B, Jain SK. Thiazolidinedione treatment decreases bone mineral density in type 2 diabetic men. Diabetes Care. 2007;30(6):1574–1576. doi: 10.2337/dc06-2606. [DOI] [PubMed] [Google Scholar]
- 58.Aung K, Htay T. Thiazide diuretics and the risk of hip fracture. Cochrane Database Syst Rev. 2011;10:CD005185. doi: 10.1002/14651858.CD005185.pub2. [DOI] [PubMed] [Google Scholar]
- 59.Bazelier MT, Gallagher AM, van Staa TP, et al. Use of thiazolidinediones and risk of osteoporotic fracture: disease or drugs? Pharmacoepidemiol Drug Saf. 2012;21(5):507–514. doi: 10.1002/pds.3234. [DOI] [PubMed] [Google Scholar]
- 60.Monami M, Cresci B, Colombini A, et al. Bone fractures and hypoglycemic treatment in type 2 diabetic patients: a case-control study. Diabetes Care. 2008;31(2):199–203. doi: 10.2337/dc07-1736. [DOI] [PubMed] [Google Scholar]
- 61.Kim JH, Jung MH, Lee JM, Son HS, Cha BY, Chang SA. Diabetic peripheral neuropathy is highly associated with nontraumatic fractures in Korean patients with type 2 diabetes mellitus. Clin Endocrinol (Oxf) 2012;77(1):51–55. doi: 10.1111/j.1365-2265.2011.04222.x. [DOI] [PubMed] [Google Scholar]
- 62.Roman de Mettelinge T, Cambier D, Calders P, Van Den Noortgate N, Delbaere K. Understanding the relationship between type 2 diabetes mellitus andfalls in older adults: a prospective cohort study. PLoS One. 2013;8(6):e67055. doi: 10.1371/journal.pone.0067055. [DOI] [PMC free article] [PubMed] [Google Scholar]
- 63.Huang ES, Karter AJ, Danielson KK, Warton EM, Ahmed AT. The association between the number of prescription medications and incident falls in a multi-ethnic population of adult type-2 diabetes patients: the diabetes and aging study. J Gen Intern Med. 2010;25(2):141–146. doi: 10.1007/s11606-009-1179-2. [DOI] [PMC free article] [PubMed] [Google Scholar]
- 64.Pijpers E, Ferreira I, de Jongh RT, et al. Older individuals with diabetes have an increased risk of recurrent falls: analysis of potential mediating factors: the Longitudinal Ageing Study Amsterdam. Age Ageing. 2012;41(3):358–365. doi: 10.1093/ageing/afr145. [DOI] [PubMed] [Google Scholar]
- 65.Leidig-Bruckner G, Ziegler R. Diabetes mellitus a risk for osteoporosis? Exp Clin Endocrinol Diabetes. 2001;109(Suppl 2):493–514. doi: 10.1055/s-2001-18605. [DOI] [PubMed] [Google Scholar]
- 66.Inzerillo AM, Epstein S. Osteoporosis and diabetes mellitus. Rev Endocr Metab Disord. 2004;5(3):261–268. doi: 10.1023/B:REMD.0000032415.83124.20. [DOI] [PubMed] [Google Scholar]
- 67.Moseley KF. Type 2 diabetes and bone fractures. Curr Opin Endocrinol Diabetes Obes. 2012;19(2):128–135. doi: 10.1097/MED.0b013e328350a6e1. [DOI] [PMC free article] [PubMed] [Google Scholar]
- 68.Patel S, Hyer S, Tweed K, et al. Risk factors for fractures and falls in older women with type 2 diabetes mellitus. Calcif Tissue Int. 2008;82(2):87–91. doi: 10.1007/s00223-007-9082-5. [DOI] [PubMed] [Google Scholar]
- 69.Montagnani A, Gonnelli S, Alessandri M, Nuti R. Osteoporosis and risk of fracture in patients with diabetes: an update. Aging Clin Exp Res. 2011;23(2):84–90. doi: 10.1007/BF03351073. [DOI] [PubMed] [Google Scholar]
- 70.Gillespie LD, Robertson MC, Gillespie WJ, et al. Interventions for preventing falls in older people living in the community. Cochrane Database Syst Rev. 2009;2:CD007146. doi: 10.1002/14651858.CD007146.pub2. [DOI] [PubMed] [Google Scholar]