Abstract
Metabolic co-regulation between biosynthetic pathways for secondary metabolites is common in microbes and can play an important role in microbial interactions. Here, we describe a novel mechanism of metabolic co-regulation in which an intermediate in one pathway is converted into signals that activate a second pathway. Our study focused on the co-regulation of 2,4-diacetylphloroglucinol (DAPG) and pyoluteorin, two antimicrobial metabolites produced by the soil bacterium Pseudomonas protegens. We show that an intermediate in DAPG biosynthesis, phloroglucinol, is transformed by a halogenase encoded in the pyoluteorin gene cluster into mono- and di-chlorinated phloroglucinols. The chlorinated phloroglucinols function as intra- and inter-cellular signals that induce the expression of pyoluteorin biosynthetic genes, pyoluteorin production, and pyoluteorin-mediated inhibition of the plant-pathogenic bacterium Erwinia amylovora. This metabolic co-regulation provides a strategy for P. protegens to optimize the deployment of secondary metabolites with distinct roles in cooperative and competitive microbial interactions.
DOI: http://dx.doi.org/10.7554/eLife.22835.001
Research Organism: Other
eLife digest
Bacteria live almost everywhere on Earth and often compete with one another for limited resources, like space or nutrients. Certain bacteria produce molecules that are toxic to other microorganisms to give themselves a competitive advantage. These toxic molecules are more commonly referred as antibiotics, and are perhaps best known for their importance in medicine. Yet, antibiotics benefit the bacteria that produce them in other ways too. Some bacteria, for example, use antibiotics as chemical signals to communicate with one another and coordinate their activities.
Some bacteria produce many antibiotics with different toxic and signaling activities. These bacteria often coordinate the production of different antibiotics such that the production of one antibiotic shuts down the production of another. This kind of coordination would allow the bacterium to focus its energy on producing only the antibiotic that gives it a competitive advantage at that time. Yet, in most cases, it was not known how the bacterial cell coordinates the production of two different antibiotics.
Pseudomonas protegens is a species of bacteria that lives in soil, and produces many antibiotics that are toxic to other bacteria or fungi. The antibiotics are made via distinct pathways of chemical reactions that are catalyzed by different enzymes. However, the production of two antibiotics, called 2,4-diacetylphloroglucinol and pyoluteorin, is tightly coordinated in some strains of P. protegens. Now, Yan et al. have discovered how P. protegens coordinates the production of these two antibiotics. It turns out that the bacterium produces an enzyme that adds chlorine atoms onto one of the intermediate building blocks used to make 2,4-diacetylphloroglucinol. These “chlorinated derivatives” then activate the genes required to make the second antibiotic, pyoluteorin. The derivatives also signal to other P. protegens cells and trigger them to produce pyoluteorin too. Lastly, Yan et al. confirmed that pyoluteorin could inhibit the growth of another species of bacteria called Erwinia amylovora.
These new findings highlight an important role played by chemicals that might have previously been considered as merely stepping stones in other biochemical reactions. An important challenge for the future will be to evaluate if other microbes use chemical intermediates in similar ways. Understanding the natural role of more antibiotics and their intermediates should help us to more wisely use existing antibiotics, and might eventually lead to new treatments for infections in humans and other animals.
Introduction
Many microorganisms produce multiple secondary metabolites with diverse chemical properties and ecological functions that contribute to the fitness of the producing organism in natural environments (Haas and Keel, 2003; O’Brien and Wright 2011, Traxler and Kolter, 2015). The biosynthesis of different secondary metabolites by a microorganism is often coordinated (Bosello et al., 2011; Tsunematsu et al., 2013; Hidalgo et al., 2014; Vingadassalon et al., 2015; Cano-Prieto et al., 2015; Cui et al., 2016). Co-regulation of different secondary metabolites is thought to be selected during microbial evolution because it confers competitive advantages to the producing organism in microbial interactions (Challis and Hopwood, 2003).
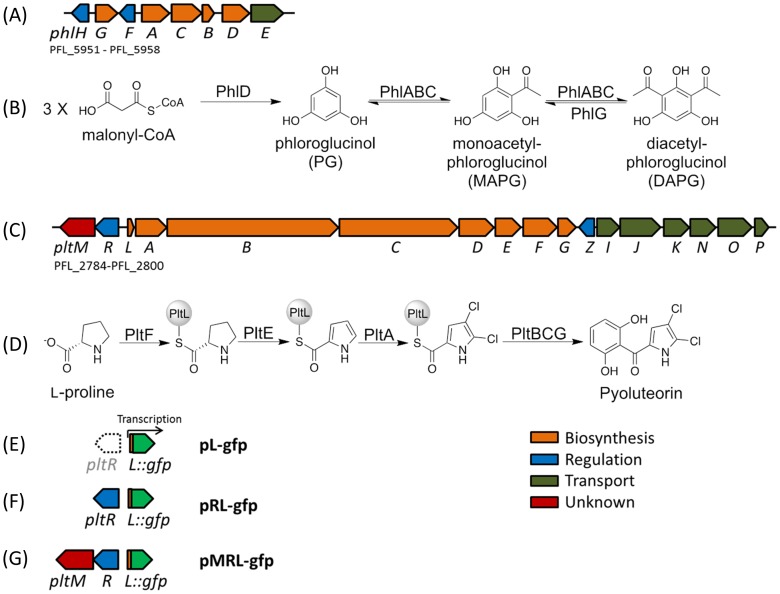
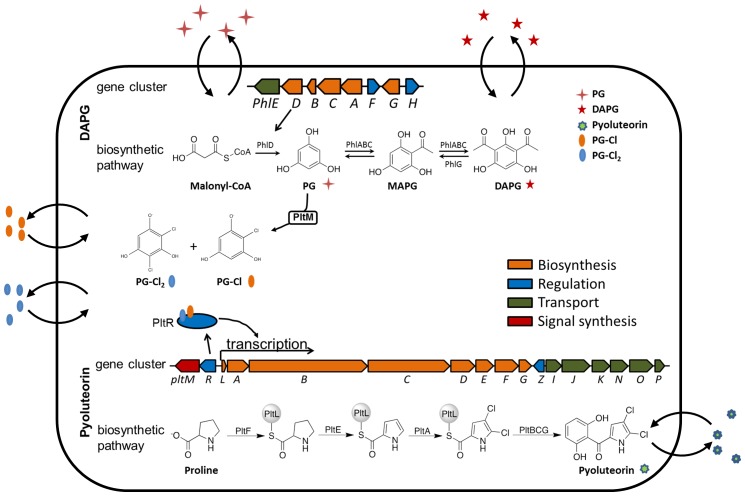
Among the secondary metabolites, antibiotics are particularly intriguing because of their roles in both cooperative and competitive interactions among microorganisms in natural habitats (Yim et al., 2007; Raaijmakers and Mazzola, 2012). This study focuses on 2,4-diacetylphloroglucinol (DAPG) and pyoluteorin, two broad-spectrum antibiotics with toxicity against fungi, bacteria, oomycetes and plants (Ohmori et al., 1978; Keel et al., 1992). Certain strains of Pseudomonas spp. produce DAPG but not pyoluteorin (Loper et al., 2012) and some strains of Pseudomonas aeruginosa produce pyoluteorin but not DAPG (Ohmori et al., 1978). To date, only a subset of strains of the species Pseudomonas protegens are known to produce both compounds (Loper et al., 2012). Among these DAPG- and pyoluteorin-producing strains is the soil bacterium P. protegens Pf-5. In the genome of Pf-5, genes for DAPG and pyoluteorin biosynthesis are present in two different gene clusters (Figure 1A and C) separated by 3.7-megabases (Paulsen et al., 2005). The biosynthetic substrates and intermediates of the two pathways are distinct (Figure 1B and D). DAPG biosynthesis begins with synthesis of phloroglucinol (PG) from three molecules of malonyl-CoA by the type III polyketide synthase PhlD (Achkar et al., 2005). PG is then acetylated through the action of PhlABC to form DAPG (Bangera and Thomashow, 1999). Pyoluteorin biosynthesis begins with activation of L-proline by the L-prolyl-AMP ligase PltF, and attachment to the peptidyl-carrier protein PltL (Thomas et al., 2002). The Pro-S-PltL intermediate is oxidized by PltE and chlorinated by PltA to yield 4,5-dichloropyrrolyl-S-PltL (Thomas et al., 2002; Dorrestein et al., 2005). The dichloropyrrole is extended by the type I polyketide synthase PltBC followed by release and formation of the resorcinol, presumably catalyzed by PltG to yield pyoluteorin (Nowak-Thompson et al., 1997, 1999).
Figure 1. Biosynthetic gene clusters for 2,4-diacetylphloroglucinol (DAPG) (A), and pyoluteorin (C), the proposed biosynthetic pathways of DAPG (B) and pyoluteorin (D) of P. protegens Pf-5, and the GFP reporter constructs (E, F, G) used in this work.
Arrows represent gene location and orientation in the biosynthetic gene clusters, and are colored according to their functions. The open arrow in (E) indicates that pltR is not included in the pL-gfp construct.
Despite the independent biochemical and genetic determinants for their biosynthesis, production of DAPG and pyoluteorin by P. protegens is tightly coordinated. Mutations in pyoluteorin biosynthetic genes result in loss of pyoluteorin production along with overproduction of DAPG (Brodhagen et al., 2004; Quecine et al., 2016), and addition of pyoluteorin to bacterial cultures represses the expression of certain DAPG biosynthetic genes and the production of DAPG (Schnider-Keel et al., 2000; Baehler et al., 2005). Conversely, PG, an intermediate in DAPG biosynthesis, has a concentration-dependent influence on expression of pyoluteorin biosynthetic genes and production of pyoluteorin: nanomolar concentrations of PG are required for pyoluteorin production but micromolar concentrations of PG repress pyoluteorin production (Kidarsa et al., 2011; Clifford et al., 2016).
The essential role of PG in pyoluteorin production became evident when we discovered that a phlD mutant, which lacks the type III polyketide synthase PhlD responsible for PG biosynthesis, produces neither pyoluteorin nor DAPG. The phlD mutant can be complemented for pyoluteorin production by addition of nanomolar concentrations of PG to the culture medium (Kidarsa et al., 2011). Furthermore, addition of nanomolar concentrations of PG induces expression of pyoluteorin biosynthetic genes (Clifford et al., 2016), indicating that the influence of PG on pyoluteorin production is mediated through gene regulation. Pyoluteorin itself also induces expression of pyoluteorin biosynthetic genes (Brodhagen et al., 2004; Li et al., 2012). The pyoluteorin biosynthetic genes are expressed under the positive control of PltR (Brodhagen et al., 2004) (Figure 1), a transcriptional regulator belonging to the LysR family. Both PG and pyoluteorin are known to induce PltR-mediated transcription of pyoluteorin biosynthetic genes, but the relative importance of the two small molecules in inducing gene expression has not been evaluated.
The metabolic co-regulation between DAPG and PLT biosynthetic pathways differs from known examples of metabolic co-regulation between secondary metabolic pathways, which can be classified into four types based on the underlying mechanisms. The first type of co-regulation involves one or more intermediates that are shared by different biosynthetic pathways (Vingadassalon et al., 2015; Cano-Prieto et al., 2015). The second type results when a single enzyme is shared by different pathways (Lazos et al., 2010; Tsunematsu et al., 2013). The third type of co-regulation is mediated through functionally redundant enzymes present in different pathways (Lautru et al., 2007). The fourth type occurs when the biosynthetic genes for two pathways are controlled by the same ‘pathway-specific’ regulator (Pérez-Llarena et al., 1997; Bergmann et al., 2010). Overall these mechanisms of metabolic co-regulation involve a shared biosynthetic intermediate, enzymatic activity, or regulator, but none of these features is shared by the DAPG and pyoluteorin pathways (Figure 1).
Here, we describe a mechanism of metabolic co-regulation that is distinct from all described previously. Our results show that PG, an intermediate in DAPG biosynthesis, is transformed by a halogenase encoded in the pyoluteorin gene cluster into chlorinated derivatives that function as cell-cell communication signals inducing expression of pyoluteorin biosynthetic genes. Our work reveals a new mechanism of co-regulation between two secondary metabolic pathways, which is mediated by an intermediate in one pathway that is converted into signals that activate the second pathway.
Results
PG is required for PltR-mediated activation of pltL expression
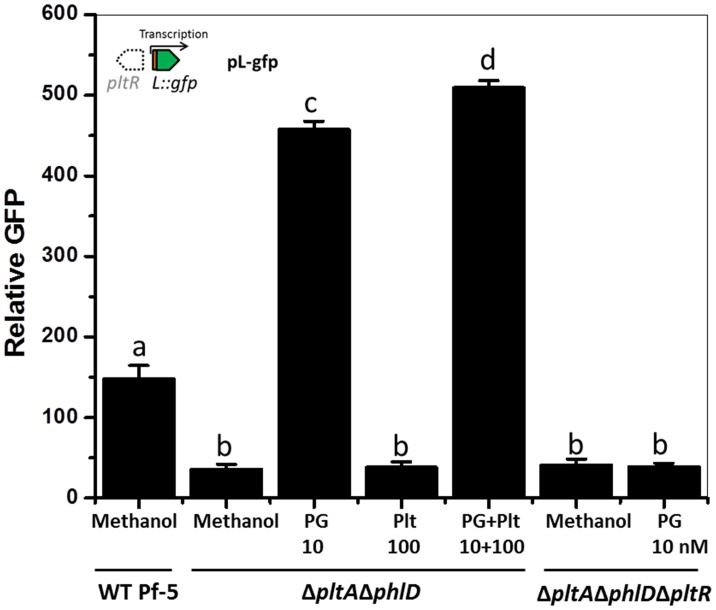
To determine the differences between the regulatory roles of PG and pyoluteorin in the production of pyoluteorin, we evaluated the effects of both metabolites on expression of the pyoluteorin biosynthetic gene pltL using pL-gfp (Figure 1E), a reporter construct containing a transcriptional fusion of the promoter of pltL to a promoterless gfp (Yan et al., 2016). GFP expressed from pL-gfp was monitored in a ΔpltAΔphlD double mutant grown in a medium amended with each of the two metabolites alone or in combination (Figure 2). In the non-amended medium, and relative to wild-type Pf-5, GFP expression was significantly lower in the ΔpltAΔphlD mutant (p=2.76E-4), indicating only background expression of pltL. This result was expected because of the deletion of pltA and phlD, which encode enzymes for biosynthesis of pyoluteorin and PG, respectively (Figure 1); both pyoluteorin and PG are known to induce expression of pyoluteorin biosynthetic genes (Brodhagen et al., 2004; Clifford et al., 2016). In the medium amended with 10 nM PG, GFP expression of the ΔpltAΔphlD mutant increased nearly tenfold relative to expression levels in non-amended medium, indicating induction of pltL. In contrast, addition of 100 nM pyoluteorin failed to alter GFP expression by the ΔpltAΔphlD mutant. However, when both pyoluteorin and PG were added, the GFP expression was significantly higher than under treatment with PG alone (p=1.44E-4). Therefore, pyoluteorin was not required for pltL expression but further induced pltL expression in the presence of PG. As expected based on the necessity of PltR for expression of the pyoluteorin biosynthetic genes (Brodhagen et al., 2004; Li et al., 2012), pltR was required for expression of pltL and the presence of PG could not restore pltL expression in a ΔpltAΔphlDΔpltR mutant (Figure 2). These results indicated that PG, not pyoluteorin, is required for PltR-mediated activation of pltL.
Figure 2. Effect of phloroglucinol (PG) and pyoluteorin on expression of pltL::gfp in P. protegens Pf-5.
Pf-5 wild-type and derivatives containing pL-gfp were treated with PG (10 nM) and/or pyoluteorin (100 nM), as indicated. Expression levels of pltL::gfp were measured and recorded as relative GFP (fluorescence of GFP divided by OD600). Letters above columns indicate treatments significantly different from one another, as determined by ANOVA analysis (p<0.05). Data are means of at least three biological replicates from a representative experiment repeated three times with similar results, and error bars represent the standard deviation of the mean.
DOI: http://dx.doi.org/10.7554/eLife.22835.004
PG activates expression of pltL indirectly
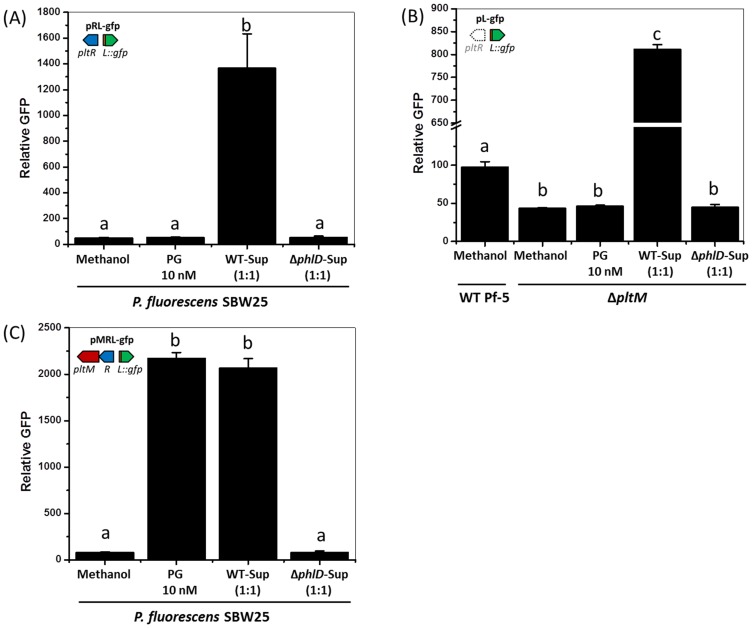
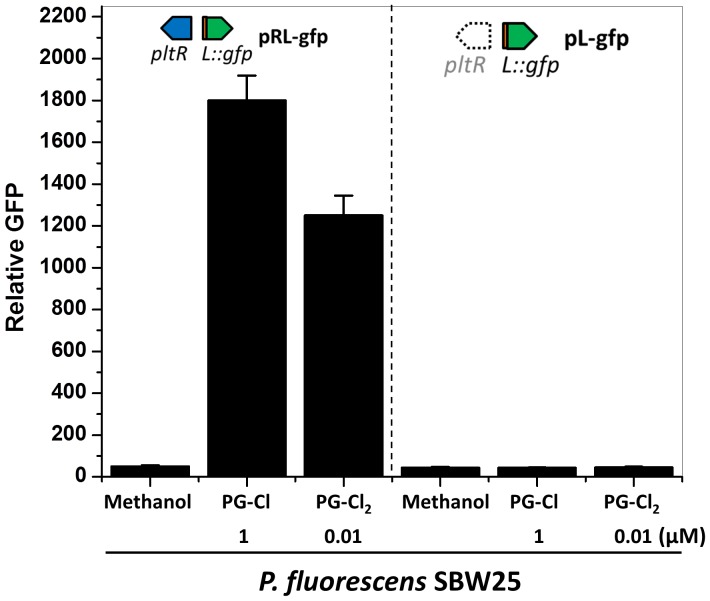
To test whether PG directly or indirectly regulates expression of the pyoluteorin biosynthetic genes, we assessed the effect of PG on expression of pltL in P. fluorescens SBW25. Like P. protegens Pf-5, strain SBW25 is a member of the P. fluorescens group but, unlike Pf-5, SBW25 has neither the phl gene cluster nor the plt gene cluster (Silby et al., 2009). Because SBW25 does not have pltR, which is required for pltL expression, we made the transcriptional reporter construct pRL-gfp, which contains pltR and the intergenic region between pltR and pltL that includes the promoter of pltL fused to a promoterless gfp (Figure 1F). Although PG was sufficient to induce pltL expression in Pf-5 (Figure 2), PG failed to induce GFP expression from pRL-gfp in P. fluorescens SBW25 (Figure 3A) and is therefore not likely to function as a signal directly. One possible explanation for these results is that Pf-5 processes PG to another compound, which then directly induces pyoluteorin gene expression. To test this possibility, we amended SBW25 carrying pRL-gfp with culture supernatants from Pf-5 or the ΔphlD mutant and measured pltL expression. Consistent with our hypothesis, culture supernatants from Pf-5, but not the ΔphlD mutant, could induce GFP expression of SBW25 (Figure 3A). Therefore, we concluded that PG does not directly influence pyoluteorin gene expression. Rather, PG could be converted to a compound(s) that regulates pyoluteorin gene expression.
Figure 3. Effect of phloroglucinol (PG) and Pf-5 culture supernatants on expression of pltL::gfp in P. fluorescens SBW25 (A, C), and P. protegens Pf-5 (B).
(A) Expression of pltL::gfp in SBW25 containing pRL-gfp. (B) Expression of pltL::gfp in wild-type (WT) Pf-5 and the ΔphlM mutant containing pL-gfp. (C) Expression of pltL::gfp in SBW25 containing pMRL-gfp. In each experiment, the concentration of PG is 10 nM, and the same volume of methanol was added to the bacterial cultures as a control. The supernatants of bacterial cultures were mixed with the fresh bacterial cultures at a 1:1 vol ratio to test their effects on pltL::gfp expression; WT-Sup, the culture supernatants of wild-type Pf-5; ΔphlD-Sup, the culture supernatants of a ΔphlD mutant. The expression levels of pltL::gfp were measured and recorded as relative GFP (fluorescence of GFP divided by OD600). Letters above columns indicate treatments significantly different from one another, as determined by ANOVA analysis (p<0.05). Data are means of at least three biological replicates from a representative experiment repeated three times with similar results, and error bars represent the standard deviation of the mean.
DOI: http://dx.doi.org/10.7554/eLife.22835.006
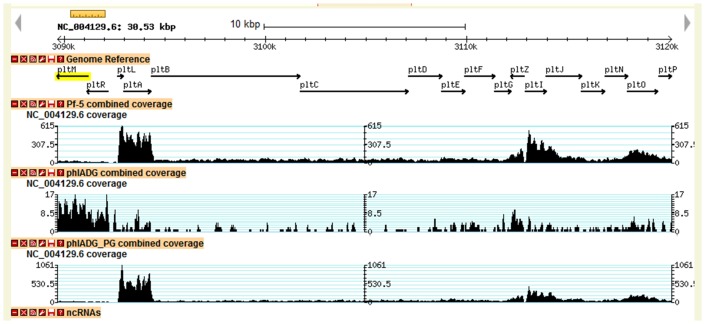
Figure 3—figure supplement 1. Transcriptional profiles of pltM, pltR and the other genes in the pyoluteorin gene cluster of Pf-5.
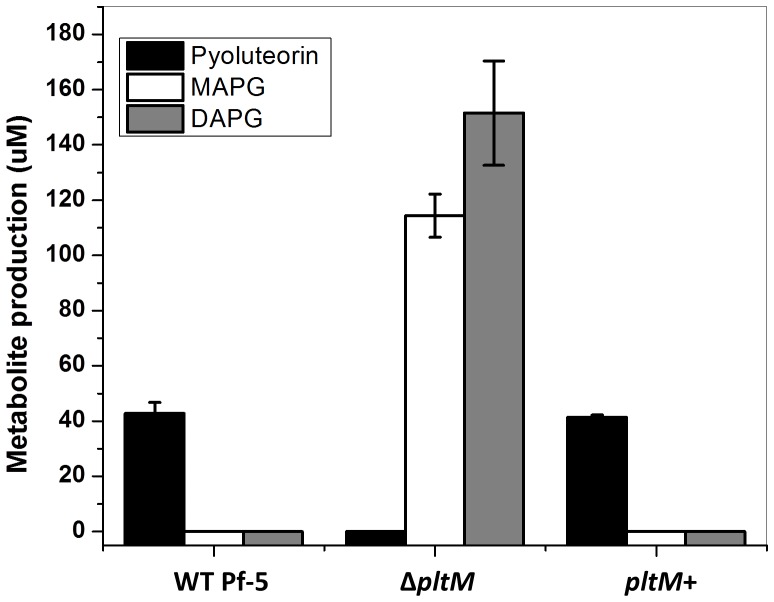
Figure 3—figure supplement 2. Production of pyoluteorin, DAPG and MAPG by P. protegens Pf-5 wild-type (WT), a ΔpltM mutant, and a pltM+ complemented strain.
pltM is necessary and sufficient for the PltR-mediated activation of pltL expression by PG
We then attempted to identify a mechanism by which Pf-5 could convert PG to the compound(s) that directly induces pyoluteorin gene expression. Within the plt gene cluster of Pf-5, pltM attracted our attention because of its proximity to pltR (Figure 1C). pltM and pltR are predicted to form a bicistronic operon because of a four-base overlap between the 5’ end of pltM and the 3’ terminus of pltR (Paulsen et al., 2005). Moreover, pltM and pltR share similar transcriptional profiles, which differ from those of other genes in the plt gene cluster (Figure 3—figure supplement 1; Clifford et al., 2016). PltM is a putative FADH2-dependent halogenase and is required for pyoluteorin production: a pltM insertion mutant is deficient in the production of pyoluteorin (Nowak-Thompson et al., 1999). The reason why PltM is required is unclear because the plt gene cluster encodes another FADH2-dependent halogenase PltA that catalyzes the addition of both chlorines to the pyrrole moiety to form pyoluteorin (Dorrestein et al., 2005). Therefore, we hypothesized that PltM is responsible for conversion of PG into the compound(s) that induces the expression of pyoluteorin biosynthetic genes.
To avoid any concerns regarding potential polar effects of the insertion in the previously derived pltM mutant (Nowak-Thompson et al., 1999), we generated a mutant with an in-frame deletion of pltM and confirmed that the ΔpltM mutant does not produce pyoluteorin (Figure 3—figure supplement 2). Pyoluteorin production by the ΔpltM mutant could be complemented by a plasmid-borne copy of pltM, confirming that pltM has an essential role in pyoluteorin production.
We introduced pL-gfp into the ΔpltM mutant and found that the mutant expressed only background levels of GFP, indicating that expression of pltL was not induced in this mutant (Figure 3B). The GFP expression remained at background levels even when cells were grown in the presence of 10 nM PG. However, GFP expression of the ΔpltM mutant was induced by culture supernatants of Pf-5 (Figure 3B). As expected, culture supernatants of the ΔphlD mutant failed to induce GFP expression of the ΔpltM mutant containing pL-gfp. These results supported our hypothesis and indicated that wild-type Pf-5, but not the ΔpltM mutant, produces the compound(s) that induces the pltL expression.
To test whether pltM is sufficient for signaling in SBW25, we made a transcriptional fusion construct pMRL-gfp, which contains pltM, pltR, and the intergenic region between pltR and pltL that includes the promoter of pltL fused with the promoterless gfp (Figure 1G). Like SBW25 containing pRL-gfp, SBW25 containing pMRL-gfp had only low, background GFP expression in the non-amended medium, and higher GFP expression level in the presence of culture-supernatants from wild-type Pf-5 (Figure 3A and C). While PG failed to induce GFP expression of SBW25 containing pRL-gfp (Figure 3A), it induced GFP expression of SBW25 containing pMRL-gfp (Figure 3C). These results indicated that pltM is sufficient for signaling in SBW25 in the presence of PG and the regulatory gene pltR.
Identification of chlorinated phloroglucinols from Pf-5 cultures
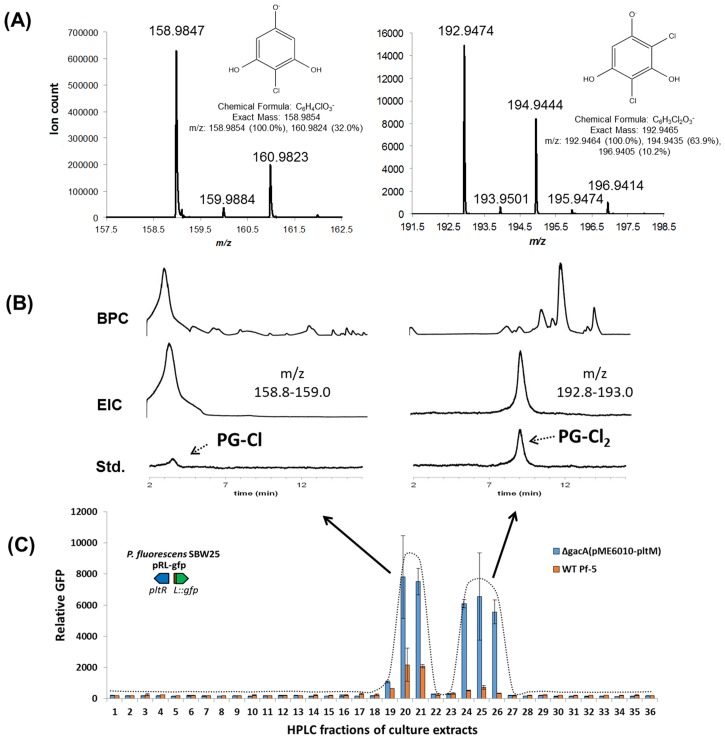
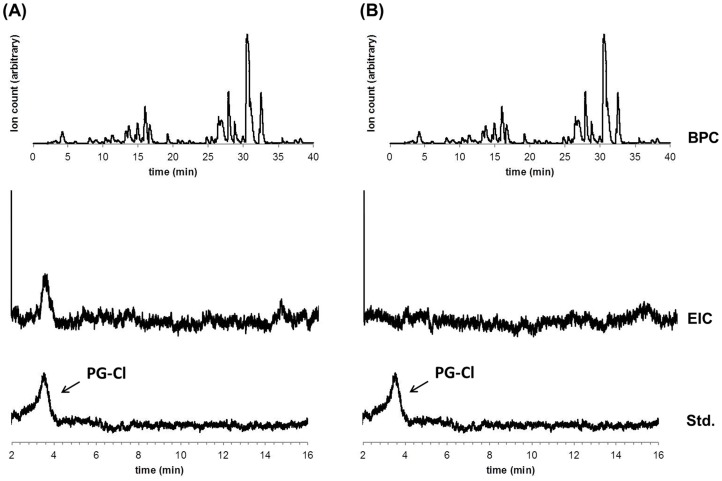
To identify the compound(s) that induce(s) expression of pltL, we extracted bacterial metabolites from cultures of the wild-type Pf-5 and the ΔpltM mutant, and analyzed the extracts by liquid chromatography–mass spectrometry (LCMS). This analysis revealed the presence of 2-chlorobenzene-1,3,5-triol (PG-Cl) in culture extracts of the wild-type Pf-5 but not the ΔpltM mutant (Figure 4—figure supplement 1). We also separated the extracts of the wild-type into fractions using semi-preparatory HPLC, and assayed the fractions for signaling activity. This analysis revealed two peaks that induced pltL expression in SBW25 (pPL-gfp) (Figure 4C), suggesting that Pf-5 produces at least two signaling compounds.
Figure 4. Identification of the signaling metabolites from Pf-5 that induce expression of pltL::gfp in P. fluorescens SBW25 (pRL-gfp).
Metabolites were extracted from wild-type (WT) Pf-5, and a phloroglucinol (PG)-fed ΔgacA mutant of Pf-5 carrying a plasmid that constitutively expresses pltM (pME6010-pltM). The extracts were fractioned into 48 fractions using semi-preparatory HPLC (no observable signal activity was detected from the last 12 fractions, data not shown). The signal activity of the fractions from both strains was tested using strain P. fluorescens SBW25 containing pRL-gfp (C). Data are means of three biological replicates, and error bars represent the standard deviation of the mean. (A) Mass spectra of compound eluting at 3.3 min in Fraction 21 (left) and 9 min in Fraction 26 (right) from the ΔgacA (pME6010-pltM) culture extracts. (B) Comparisons between the signal compounds identified in Pf-5 cultures to synthesized PG-Cl and PG-Cl2, which elute at 3.3 and 9 min, respectively, as indicated by the dashed arrows. BPC, base peak chromatogram; EIC, extracted ion chromatogram; Std, synthesized standards. The m/z used for EIC analysis of PG-Cl and PG-Cl2 are also shown.
Figure 4—figure supplement 1. LCMS analysis of crude extracts of bacterial metabolites from cultures of wild-type Pf-5 (A) and ΔpltM mutant (B).
To obtain sufficient levels of signaling molecules for chemical analysis, we constructed a derivative strain of Pf-5 that overproduced the signaling compounds. This overproducing strain is a ΔgacA mutant of Pf-5 carrying plasmid pME6010-pltM, which expresses pltM from a constitutive kanamycin-resistance promoter (Pk) (Heeb et al., 2000). The ΔgacA mutant does not produce many of the secondary metabolites produced by wild-type Pf-5 (Hassan et al., 2010) and thus its use helps to reduce the noise in LCMS analysis. The strain ΔgacA (pME6010-pltM) was cultured in a medium amended with PG, and bacterial metabolites from the cultures were extracted and assayed for signal activity using SBW25 (pPL-gfp), as described for the wild-type Pf-5 above. As in the extract of wild-type Pf-5, two peaks in the extract of the ΔgacA (pME6010-pltM) strain, spread across six fractions (fractions 19–21, 24–26), showed signal activity (Figure 4C). LCMS analysis revealed compounds with protonated ions consistent with PG-Cl in fraction 21 (obs. 158.9847, calc. 158.9854, 4.4 ppm error) and 2,4-dichlorobenzene-1,3,5-triol (PG-Cl2) in fraction 26 (obs. 192.9474, calc. 192.9465, 4.7 ppm error) (Figure 4A). The identities of PG-Cl and PG-Cl2 partially purified from the culture extracts were confirmed by comparing them with the synthesized authentic compounds (Figure 4B).
PG-Cl, a molecule with previously undescribed biological activity, has been isolated from the red alga Rhabdoina verticillata (Blackman and Matthews, 1982). To our knowledge, PG-Cl2 has not been previously reported. The structures of these two chlorinated phloroglucinol derivatives are consistent with the expected products of a reaction catalyzed by PltM, an FADH2-dependent halogenase.
PltM converts PG in vitro into chlorinated phloroglucinols that activate the expression of pltL
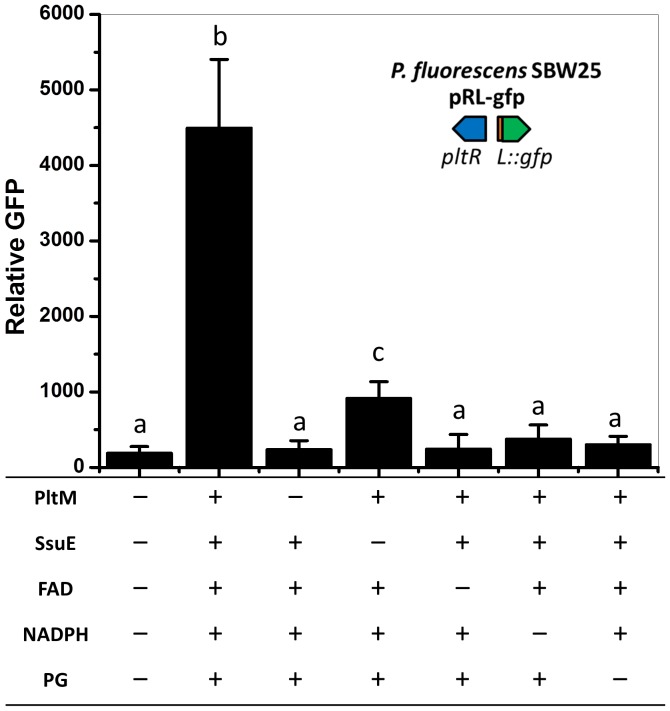
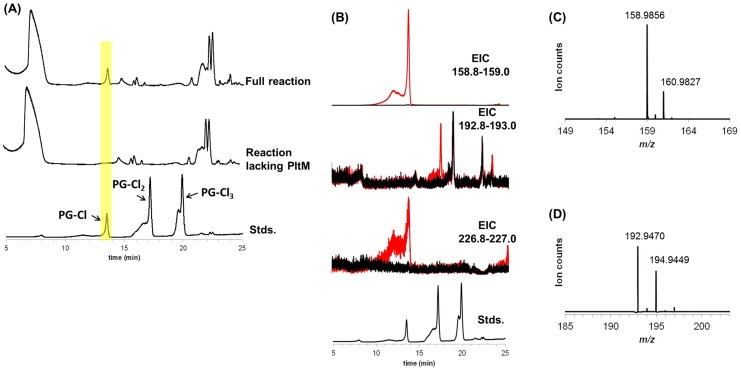
To determine the catalytic activity of PltM, we characterized the products generated in vitro from PG by PltM. As a putative FADH2-dependent halogenase, PltM is predicted to require a flavin reductase for catalysis (Nowak-Thompson et al., 1999), but no putative flavin reductase is encoded in the plt gene cluster (Figure 1C). Therefore, the previously characterized NAD(P)H-dependent flavin reductase SsuE from E. coli (Keller et al., 2000) was purified and used here. The results showed that, in the presence of co-factors and flavin reductase, PltM converted PG into a compound(s) that activated pltL expression, as determined from GFP expression of SBW25 containing pRL-gfp (Figure 5). Furthermore, LCMS analysis showed that both PG-Cl and PG-Cl2 were present in the in vitro reaction containing PltM, but not in the reaction without PltM, based on comparisons with the authentic standards (Figure 5—figure supplement 1).
Figure 5. Effect of extracts from in vitro catalyzed reactions on expression of pltL::gfp in P. fluorescens SBW25.
PltM was purified from E. coli and incubated with a mixture of flavin reductase SsuE, substrate PG, and co-factors FAD and NADPH. The effect of extracted compounds from the reactions was tested using P. fluorescens SBW25 containing pRL-gfp. "+” and "–” indicate the presence or absence of the component in the reactions, respectively. The expression level of pltL::gfp was measured and recorded as relative GFP (fluorescence of GFP divided by OD600). Letters above columns indicate treatments significantly different from one another, as determined by ANOVA analysis (p<0.05). Data are means of at least three biological replicates from a representative experiment repeated twice with similar results, and error bars represent the standard deviation of the mean.
DOI: http://dx.doi.org/10.7554/eLife.22835.013
Figure 5—figure supplement 1. LCMS analysis of PltM reaction mixtures.
Figure 5—figure supplement 2. Effect of different compounds that have structures similar to phloroglucinol (PG) on the expression of pltL::gfp in P. fluorescens SBW25.
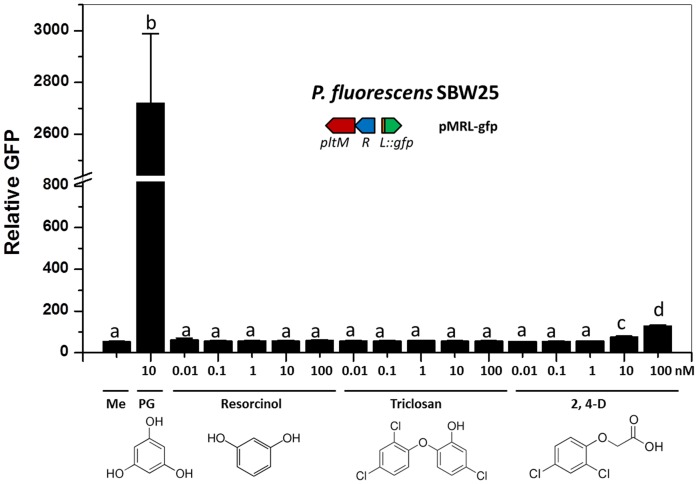
By evaluating a range of compounds related to PG as possible precursors, we also demonstrated that PltM exhibits a high degree of substrate specificity (Figure 5—figure supplement 2). These in vitro data, combined with the genetic data above, demonstrate that pltM is necessary and sufficient for converting PG into PG-Cl and PG-Cl2, which induce pltL expression.
Chlorinated phloroglucinols induce the PltR-mediated activation of pltL::gfp and production of pyoluteorin
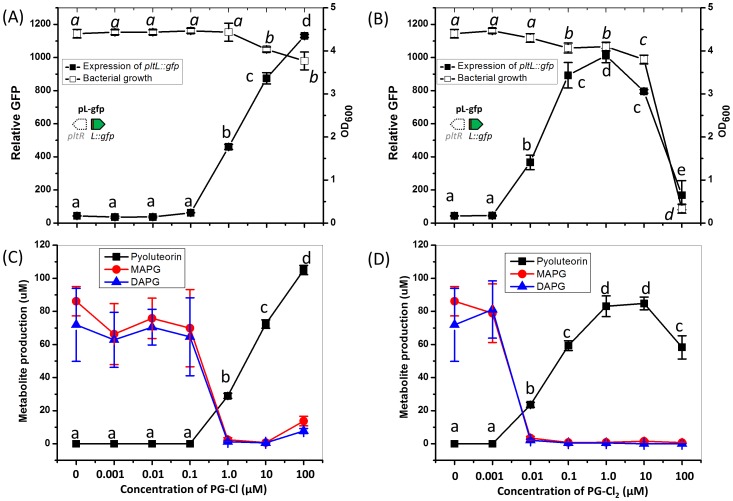
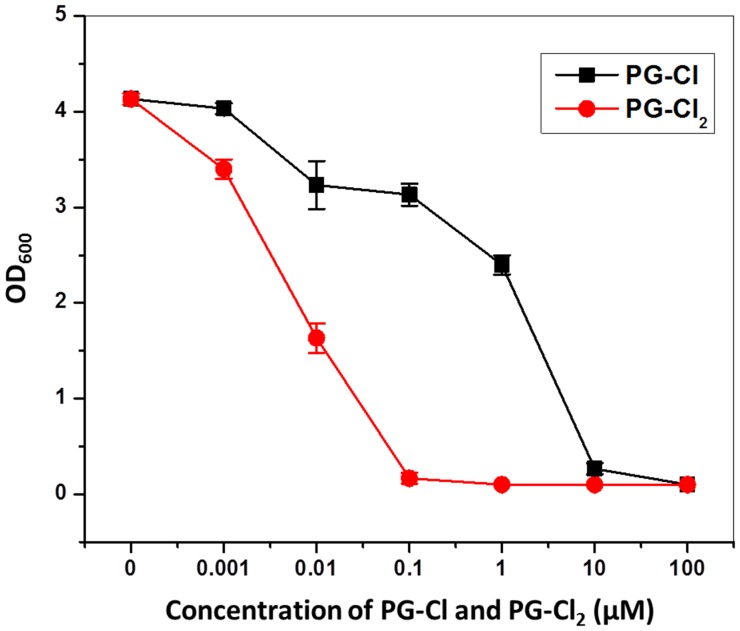
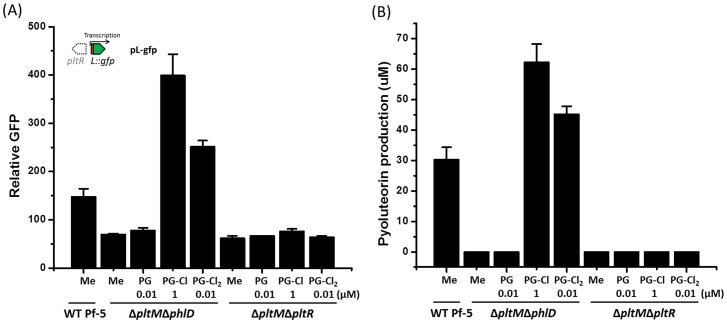
We then set out to test the function of PG-Cl or PG-Cl2 in pyoluteorin biosynthesis of Pf-5. Addition of synthesized PG-Cl or PG-Cl2 to cultures induced, in a concentration-dependent manner, expression of pltL (Figure 6A and B) and pyoluteorin production (Figure 6C and D) by the ΔpltM mutant of Pf-5. The minimum concentration of PG-Cl2 that induced the expression of pltL or production of pyoluteorin was 0.01 μM, which is 100-fold less than that observed for PG-Cl. These results suggest that PG-Cl2 is a more potent signaling compound than PG-Cl. Additionally, there is evidence of toxicity: above 0.1 µM PG-Cl2, growth of P. protegens Pf-5 decreased (Figure 6B). PG-Cl was also toxic to Pf-5, but only at concentrations of 10 μM or higher. Similarly, PG-Cl and PG-Cl2 showed inhibitory effects on the growth of P. fluorescens strain SBW25 (Figure 6—figure supplement 1). Induction of pltL expression and pyoluteorin production by both PG-Cl and PG-Cl2 required pltR (Figure 6—figure supplements 2 and 3). This is as expected because PltR is known to be the transcriptional inducer of pyoluteorin biosynthetic genes (Brodhagen et al., 2004; Li et al., 2012).
Figure 6. Influence of PG-Cl (left) and PG-Cl2 (right) on expression of pltL::gfp (A, B) and production of pyoluteorin (C, D) in the ΔpltM mutant of P. protegens Pf-5.
The ΔpltM mutant was cultured in NBGly amended with increasing concentrations of PG-Cl and PG-Cl2. To test the regulatory effects of PG-Cl and PG-Cl2 on expression of pyoluteorin biosynthetic genes, GFP activity was determined from the ΔpltM mutant containing pL-gfp 20 hr after inoculation (A, B). The OD600 value of bacterial cultures (24 hr after inoculation) was measured to show the influence of PG-Cl and PG-Cl2 on the bacterial growth (A, B). The bacterial cultures were extracted 24 hr after inoculation and production of pyoluteorin, MAPG and DAPG were quantified (C, D). Letters above the symbols indicate treatments significantly different from one another, as determined by ANOVA analysis (p<0.05). Data are means of at least three biological replicates from a representative experiment repeated twice with similar results, and error bars represent the standard deviation of the mean.
DOI: http://dx.doi.org/10.7554/eLife.22835.018
Figure 6—figure supplement 1. Effect of PG-Cl and PG-Cl2 on growth of P. fluorescens SBW25.
Figure 6—figure supplement 2. Effect of PG-Cl and PG-Cl2 on expression of pltL::gfp (A) and production of pyoluteorin (B) in the ΔpltMΔphlD mutant and the ΔpltMΔpltR mutant of P. protegens Pf-5.
Figure 6—figure supplement 3. Effect of PG-Cl and PG-Cl2 on the expression of pltL::gfp in P. fluorescens SBW25.
PG-Cl and PG-Cl2 induced pyoluteorin production concurrently with decreased monoacetylphloroglucinol (MAPG) and DAPG production by the ΔpltM mutant (Figure 6C and D). This result is consistent with the known co-regulation between the pyoluteorin and DAPG biosynthetic pathways (Brodhagen et al., 2004).
PG-Cl and PG-Cl2 function in cell-cell communication and influence antibiosis of Pf-5
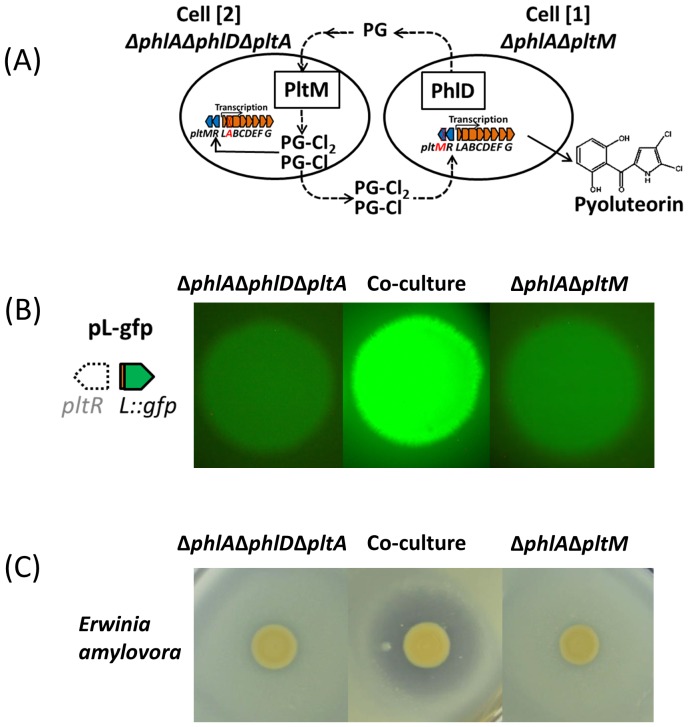
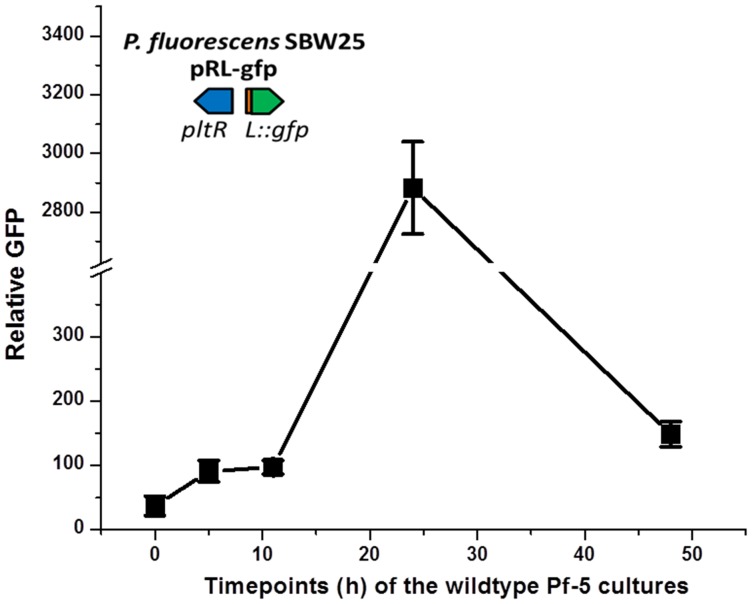
DAPG and pyoluteorin are known signals produced by distinct biosynthetic pathways with described roles in intercellular communication of P. protegens (Schnider-Keel et al., 2000; Brodhagen et al., 2004). Several observations suggested that PG-Cl and PG-Cl2 also function as cell-cell communication signals: (1) they are released by the bacterial cell (Figure 3 and Figure 4); (2) they can be taken up by the bacterial cell (Figure 6); (3) they regulate gene expression at the transcriptional level and affect the output (antibiotic production) of the cell (Figure 6); (4) their production varies with the growth stage of the bacterial cultures (Figure 7—figure supplement 1); and (5) their regulatory activities rely on a transcriptional regulator, PltR (Figure 6—figure supplements 2 and 3). These results, combined with our previous finding that PG can function as a chemical messenger between cells of P. protegens (Clifford et al., 2016), collectively support the model depicted in Figure 7A, in which PG-Cl and PG-Cl2 can be synthesized from PG by bacterial cells, released into the environment and taken up by neighboring cells to induce expression of pyoluteorin biosynthetic genes and produce pyoluteorin.
Figure 7. PG-Cl and PG-Cl2 function as cell-cell communication signals of P. protegens Pf-5.
(A) Proposed cell-cell communication model. Cell [1] (ΔphlAΔpltM) produces phloroglucinol (PG) and releases it into the environment. PG is taken up by cell [2] (ΔphlAΔphlDΔpltA) and converted into PG-Cl and PG-Cl2, which are secreted into the environment. PG-Cl and PG-Cl2 are taken up by cell [1] and induce expression of pyoluteorin biosynthetic genes and production of pyoluteorin by cell [1]. The plt gene cluster is shown. Red font indicates that the gene was deleted. (B) GFP expression from the pure- and co-culture of the ΔphlAΔpltM mutant containing pL-gfp and the ΔphlAΔphlDΔpltA mutant containing pL-gfp on NAGly plate. (C) Antibiosis of the pure- and co-culture of the ΔphlAΔpltM mutant and ΔphlAΔphlDΔpltA mutant against growth of Erwinia amylovora on a NAGly plate. The co-culture was prepared by mixing the two mutants 1:1 and spotting on the plate. The experiment was repeated at least twice, with similar results.
Figure 7—figure supplement 1. Levels of signaling compounds in cultures of P. protegens Pf-5 of different ages.
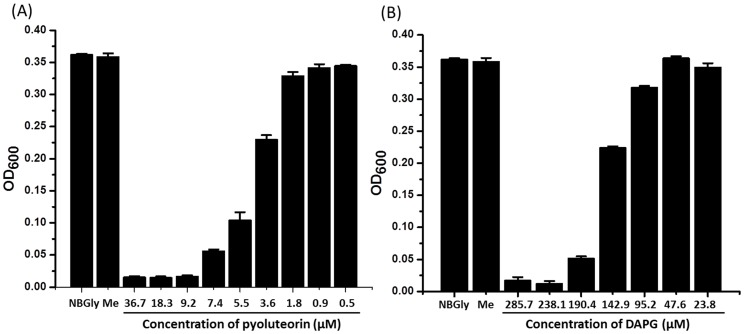
Figure 7—figure supplement 2. Toxicity of pyoluteorin (A) and DAPG (B) to the plant pathogen Erwinia amylovora.
We used ΔphlAΔpltM and ΔphlAΔphlDΔpltA mutants of Pf-5 to test the model. Both mutants expressed the pyoluteorin biosynthetic gene pltL at low levels as indicated by low GFP expression from pL-gfp (Table 1, Figure 7B). The ΔphlAΔpltM mutant can produce PG but cannot convert it into PG-Cl or PG-Cl2, because of the deletion of pltM. Adding PG-Cl or PG-Cl2 to the ΔphlAΔpltM mutant culture led to induced expression of pltL (Table 1), indicating that this mutant could respond to the signals. The ΔphlAΔphlDΔpltA mutant could not produce PG because of the deletion of phlD, but still has the capability to convert PG into PG-Cl and PG-Cl2: adding PG to the culture led to increased expression of pltL (Table 1). Neither mutant could produce pyoluteorin when grown in pure culture, because of the phlD and pltA mutations in the ΔphlAΔphlDΔpltA mutant and the pltM mutation in the ΔphlAΔpltM mutant. In contrast, pyoluteorin was produced when the two mutants were grown in co-culture (Table 1). Consistently, both mutants showed increased expression of pltL in the co-culture compared with the mutants grown in pure culture (Table 1, Figure 7B). These results support our model (Figure 7A) that PG produced by the ΔphlAΔpltM mutant could be converted into PG-Cl and PG-Cl2 by co-cultured cells of the ΔphlAΔphlDΔpltA mutant; PG-Cl and PG-Cl2 could then be used by the ΔphlAΔpltM mutant to induce production of pyoluteorin. As expected, the co-culture, but not the pure cultures, of the two mutants inhibited the growth of E. amylovora (Figure 7C), a plant pathogenic bacterium that is sensitive to pyoluteorin (Figure 7—figure supplement 2A). It is worthy to note that neither mutant produces DAPG (Table 1) because of the deletion of phlA, a structural gene required for DAPG biosynthesis (Figure 1A and B), so DAPG production did not obscure the influence of pyoluteorin production on antibiosis.
Table 1.
Concentrations of DAPG, pyoluteorin, and expression of pltL::gfp in pure cultures and co-culture of the ΔphlAΔpltM mutant and the ΔphlAΔphlDΔpltA mutant of P. protegens Pf-5.
| Product/expression* | Amendment† | Bacterial cultures‡ | ||
|---|---|---|---|---|
| ΔphlAΔpltM | ΔphlAΔpltM + ΔphlAΔphlDΔpltA | ΔphlAΔphlDΔpltA | ||
| Pyoluteorin | None | BD | 6.2 ± 1.8 nmol/g | BD |
| DAPG | None | BD | BD | BD |
| Relative GFP | None | 34.6 ± 2.3 | 137.4 ± 3.4§; 214.7 ± 11.2¶ | 27.6 ± 1.9 |
| PG (10 nM) | 37.6 ± 3.1 | NT | 133.3 ± 6.4 | |
| PG-Cl (1 µM) | 261.0 ± 13.3 | NT | 308.6 ± 21.8 | |
| PG-Cl2 (10 nM) | 128.2 ± 10.7 | NT | 268.4 ± 16.2 | |
*The mutants were cultured for 3 d on a NAGly plate to determine production of secondary metabolites, and for 20 hr in NBGly broth to determine expression of pltL::gfp from the reporter construct pL-gfp (Figure 1E). The co-culture was prepared by mixing the two mutants at a 1:1 ratio.
†PG, PG-Cl or PG-Cl2 was amended in the mutant cultures to test their influences on the expression of pltL::gfp. The concentrations of the tested compounds are shown in parenthesis.
‡Secondary metabolites were extracted from the agar plate and the concentrations of DAPG and pyoluteorin were determined by HPLC. Expression of pltL::gfp was monitored and recorded as relative GFP (fluorescence of GFP divided by OD600). §The ΔphlAΔpltM mutant, but not the ΔphlAΔphlDΔpltA mutant, contains pL-gfp in the co-culture. ¶The ΔphlAΔphlDΔpltA mutant, but not the ΔphlAΔpltM mutant, contains pL-gfp in the co-culture. Data are presented as mean ± standard derivation. Mean values are calculated from three biological replicates. BD = below detection. NT = not tested.
Collectively, our results support the hypothesis that PG-Cl and PG-Cl2 function in cell-cell communication of P. protegens and verify that cells of this bacterium can detect and respond to the chlorinated phloroglucinols produced by neighboring bacterial cells.
Discussion
The primary contribution of this work was the discovery of a novel mechanism of co-regulation between secondary metabolite biosynthetic pathways (Figure 8). This co-regulatory mechanism involves a metabolic intermediate that is transformed through enzymatic activity into a signal regulating gene expression. In contrast to previously described co-regulatory mechanisms involving a metabolic intermediate (Vingadassalon et al., 2015; Cano-Prieto et al., 2015), the metabolic intermediate responsible for coordination of DAPG and pyoluteorin production is not shared by the two biosynthetic pathways. Instead, PG is an intermediate in DAPG biosynthesis and a precursor for formation of signaling molecules that activate expression of pyoluteorin biosynthetic genes (Figure 8).
Figure 8. Proposed model of metabolic co-regulation between DAPG and pyoluteorin biosynthetic pathways in P. protegens.
Phloroglucinol (PG) is synthesized by the type III polyketide synthase PhlD in the DAPG biosynthetic pathway, and processed into PG-Cl and PG-Cl2 by the halogenase PltM encoded in the pyoluteorin gene cluster. The PG-Cl and PG-Cl2 putatively bind to regulator PltR and induce transcription of pyoluteorin biosynthetic genes and prompt production of pyoluteorin. In these two pathways, the final products (DAPG and pyoluteorin), the biosynthesis intermediate (PG) and its derivatives (PG-CL, PG-Cl2) can be released and used by bacteria and function as cell-cell communication signals.
The role of antibiotics in cell-cell signaling is now widely recognized (Yim et al., 2007), but the results of this study show that intermediates of antibiotic biosynthesis pathways can also function as, or be converted to, signaling molecules. DAPG and pyoluteorin are known to function as intra- and inter-cellular signals (Brodhagen et al., 2004; Maurhofer et al., 2004; Powers et al., 2015). Here we found that the chlorinated phloroglucinols PG-Cl and PG-Cl2 function as intra- and inter-cellular signaling compounds. When added to the culture medium, these compounds can induce expression of pyoluteorin biosynthetic genes in P. protegens Pf-5 (Figure 6, Figure 6—figure supplement 2). By co-culturing mutants of Pf-5 with deficiencies in phlD and pltM, we also showed that PG, PG-Cl and PG-Cl2 could be released from the producing cells and used by neighboring cells to induce the production of pyoluteorin (Table 1, Figure 7). These results support and extend those from a previous report showing that PG can serve as an intra- and inter-cellular chemical messenger, influencing the expression of pyoluteorin biosynthetic genes as well as hundreds of other genes with diverse functions in P. protegens Pf-5 (Clifford et al., 2016). Therefore, it appears that the final products DAPG and pyoluteorin, the biosynthetic intermediate PG, and its derivatives PG-Cl and PG-Cl2 all serve as signals influencing gene expression, the production of antibiotics, and the antimicrobial activity of P. protegens (Figure 8). The signaling roles of small molecules released as intermediates, derivatives, or end products of antibiotic biosynthesis pathways are likely to be more consequential than previously recognized.
Activation of pyoluteorin biosynthetic genes requires PltR (Brodhagen et al., 2004; Li et al., 2012) (Figure 1), the pyoluteorin pathway-specific positive regulator belonging to the LysR family. LysR regulators typically require a signal for activity, and the signal is commonly an intermediate or product of the regulated gene cluster (Maddocks and Oyston, 2008). Pyoluteorin has been proposed to be the signal of PltR (Li et al., 2012). However, our data indicate that the signaling effect of pyoluteorin relies on the presence of PG (Figure 2), which is converted to PG-Cl and PG-Cl2 (Figure 3 and Figure 5—figure supplement 1). Despite our exhaustive attempts, we were not able to purify the PltR protein to evaluate whether or not PG-Cl or PG-Cl2 binds to PltR in vitro (data not shown). Nevertheless, based on our data that PG-Cl and PG-Cl2 are required for induction of the pyoluteorin biosynthetic genes (Figure 6), and pltR is required for the signaling action of PG-Cl and PG-Cl2 in both P. protegens Pf-5 (Figure 6—figure supplement 2) and P. fluorescens SBW25 (Figure 6—figure supplement 2), we speculate that that PG-Cl and PG-Cl2, rather than pyoluteorin, are signals required for the activity of PltR.
An interesting question is why DAPG and pyoluteorin production are so intricately enmeshed? P. protegens can occupy different environments, including the soil, plant surfaces, and insects, and interact with different organisms including bacteria, fungi, protozoa, and insects (Brodhagen et al., 2004; Jousset et al., 2009; Kidarsa et al., 2013; Henkels et al., 2014; Loper et al., 2016). Both DAPG and pyoluteorin contribute to the antagonism of P. protegens against a range of bacteria, fungi, and oomycetes (Ohmori et al., 1978; Keel et al., 1992) and both facilitate the bacterium’s establishment in fungal tissues, such as basidiocarps of the button mushroom Agaricus spp. (Henkels et al., 2014). However, the sensitivity of a specific organism to these two antibiotics can be different. For example, pyoluteorin is twenty times more toxic than DAPG to the growth of E. amylovora (Figure 7—figure supplement 2). Furthermore, these two compounds also have distinct ecological roles. For example, DAPG but not pyoluteorin exhibits toxicity to the amoeba Acanthamoeba castellanii (Jousset and Bonkowski, 2010). Therefore, natural situations may exist in which it could be more advantageous to produce one compound versus the other. Additionally, antibiotic biosynthesis is associated with metabolic costs. The coordinated production of pyoluteorin and DAPG may be a mechanism for the bacterium to balance metabolic cost against the benefits conferred by production of the two antibiotics. In short, metabolic co-regulation may enable bacteria to activate the production of one antibiotic to combat certain competitors or predators or to occupy specific habitats, while reducing the metabolic burden on the cell by repressing the production of a second compound.
In summary, this study demonstrated that PG, an intermediate in the DAPG biosynthetic pathway, is converted into PG-Cl and PG-Cl2, which serve as signals activating expression of pyoluteorin biosynthetic genes. We also showed that PG-Cl and PG-Cl2 can be released from and sensed by bacteria to regulate antibiosis against a bacterial pathogen, indicating that these metabolites function as cell-cell communication signals. Many questions remain related to the co-regulation of the DAPG and pyoluteorin biosynthesis pathways. Membrane receptors recognizing the various signaling compounds (DAPG, pyoluteorin, PG, PG-Cl and PG-Cl2) have not been identified, but are likely needed to facilitate uptake of these molecules across the bacterial membrane. PG-Cl and PG-Cl2 are now known to be responsible for the previously described activation of the pyoluteorin biosynthesis by nanomolar concentrations of PG, but these compounds do not appear to mediate the repression of pyoluteorin production by higher (micromolar) concentrations of PG (Kidarsa et al., 2011). The mechanism(s) involved in inhibition of pyoluteorin production by PG remain unknown. Here, we report a novel mechanism of co-regulation that is responsible for only one aspect of the complex and intricate co-regulation of two secondary metabolites in P. protegens. Our results highlight the diversity of mechanisms involved in metabolic co-regulation in bacteria and provide an unprecedented example of co-regulation between separate biosynthetic pathways in which the intermediate of one pathway functions as a precursor of the signal(s) activating the biosynthesis of a second pathway.
Materials and methods
Strains, plasmids, primers, culture conditions and chemical compounds
The bacterial strains and plasmids used in this study are listed in Table 2. The sequences of oligonucleotides used in this study are listed in Table 3.
Table 2.
Bacterial strains and plasmids used in this study.
| Strains and plasmids | Genotype and relevant characteristics* | Reference or source |
|---|---|---|
| Strains | ||
| P. protegens | ||
| LK099 | Wild-type Pf-5 | (Howell and Stipanovic, 1979) |
| JL4928 | ΔpltAΔphlD | This study |
| LK269 | ΔpltAΔphlDΔpltR | This study |
| LK270 | ΔpltM | This study |
| LK024 | ΔphlD | (Kidarsa et al., 2011) |
| LK293 | ΔpltMΔpltR | This study |
| LK397 | ΔphlDΔpltM | This study |
| LK096 | ΔpltAΔphlA | (Henkels et al., 2014) |
| LK403 | ΔphlAΔpltM | This study |
| LK413 | ΔphlAΔphlDΔpltA | This study |
| P. fluorescens SBW25 | SBW25 is a member of the P. fluorescens group but does not contain the phl or plt gene clusters | (Silby et al., 2009) |
| E. coli | ||
| BL21(DE3) | ompT hsdSB (rB−mB−) gal dcm | NEB |
| S17-1 | recA pro hsdR-M+ RP4 2-Tc::Mu-Km::Tn7 Smr Tpr | (Simon et al., 1983) |
| Plasmids | ||
| pEX18Tc | Gene replacement vector with MCS from pUC18, sacB+ Tcr | (Hoang et al., 1998) |
| p18Tc-ΔpltM | pEX18Tc containing pltM with an internal deletion of 1345 bp | This study |
| pPROBE-NT | pBBR1 containing promoterless gfp, Kmr | (Miller et al., 2000) |
| pRL-gfp | pPROBE-NT containing pltR as well as the intergenic region between pltR and pltL including the promoter of pltL fused with a promoterless gfp | This study |
| pMRL-gfp | pPROBE-NT containing pltM and pltR as well as the intergenic region between pltR and pltL including the promoter of pltL fused with a promoterless gfp | This study |
| pL-gfp | Called ppltL-gfp previously. Contains the intergenic region between pltR and pltL including the promoter of pltL fused with a promoterless gfp | (Yan et al., 2016) |
| pME6010 | pACYC177-pVS1 shuttle vector, Tcr | (Heeb et al., 2000) |
| pME6010-pltM | pME6010 containing pltM, which is expressed from the constitutive promoter Pk | This study |
| pET28a(+) | Protein overexpression vector | Novagen |
| pET28a-PltM | pET28a containing pltM, used for overexpression of the PltM protein | This study |
| pET28a-SsuE | pET28a containing ssuE, used for overexpression of the SsuE protein | This study |
*Smr, streptomycin resistance; Tpr, trimethoprim resistance; Tcr, tetracycline resistance; Kmr, kanamycin resistance.
Table 3.
Sequences of oligonucleotides used in this study
| Oligonucleotides | DNA sequences* |
|---|---|
| pltR UpF-Xba | GAGAGGTCTAGAAGTGGAGTCTGGTCATCAAG |
| pltR UpR | GCTCTTGTCTTGTAGTCTTCCTGTTTCGGAGAA |
| pltR DnF | AACAGGAAGACTACAAGACAAGAGCCAGACATC |
| pltR DnR-Xba | GGTGTGTCTAGAGTGAAGAATGAGCAGGTGTC |
| pltM-F1 | ATGGTACCCTGCATTTCGATACCGC |
| pltM-R1 | ATAGAATTCGGCGGACGGGTGGATC |
| pltMRL-F1 | AGCGATTTCGATCTTCATCCCC |
| pltM-up-ovlp | GAAGCGGCGACACCGGATCCAATCGTTTCATCC |
| pltM-dn-ovlp | GGATGAAACGATTGGATCCGGTGTCGCCGCTTC |
| pltRf | ATGGTACCAAGGATTTAGGAATGAAGGC |
| pltM 5'primer | GTCATACATATGAATCAGTACGACGTCATTATC |
| pltM 3' primer | CAGTGCCTCGAGTCAGACTTTGAGGATGAAACG |
| ssuE 5' primer | GGAGAGCATATGCGTGTCATCACC |
| ssuE 3' primer | GTAAAGCTTTTACGCATGGGCATT |
| pltM 3' primer3 | ATAGGATCCGGCCCCGGGCATCACTCAG |
| pltRr | TATAAGCTTTTCAGCCCGGACTTCGCGAGG |
| gfp-plt-r1 | ATGGTACCATAGACGTACGCTCCTGC |
*Restriction sites used for cloning are underlined in oligonucleotides.
P. protegens Pf-5 and derivatives, P. fluorescens SBW25, and Erwinia amylovora were cultured at 27°C on King’s Medium B agar, Nutrient Agar (Becton, Dickinson and Company, Sparks, MD) supplemented with 1% glycerol (NAGly) or Nutrient Broth (Becton, Dickenson and Company) supplemented with 1% glycerol (NBGly). Liquid cultures were grown with shaking at 200 r.p.m.
PG was purchased from Sigma-Aldrich (St. Louis, MO, USA), MAPG was purchased from Sigma Aldrich Chemie GmbH (Schnelldorf, Germany), and DAPG was purchased from Toronto Research Chemicals (North York, Canada). Chlorinated phloroglucinols PG-Cl, PG-Cl2 and PG-Cl3 were purchased from Synthon-Lab (St. Petersburg, Russia). All compounds were >99% pure, as determined by HPLC, and were solubilized in methanol.
Construction of Pf-5 mutants and derivative strains
The ΔpltAΔphlD mutant was made by sequentially deleting phlD and pltA genes from the chromosome of wild-type P. protegens Pf-5. To delete phlD from the chromosome of Pf-5, a phlD deletion construct made previously (Kidarsa et al., 2011) was transferred into strain E. coli S17-1 and used to delete 888 bp from the phlD gene in the chromosome of Pf-5 using a previously described protocol (Kidarsa et al., 2011). To further delete pltA, a pltA deletion construct made previously (Henkels et al., 2014) was used to delete 275 bp from the pltA gene in the chromosome of Pf-5. The deletion of phlD and pltA was confirmed by PCR and subsequent DNA sequencing.
To delete pltR from the chromosome of Pf-5, two DNA fragments flanking the pltR gene were PCR amplified using the oligonucleotide pair pltR UpF-Xba/pltR UpR and pltR DnR-Xba/pltR DnF (Table 3). These two fragments were fused together by PCR and digested using XbaI to generate a 1325 bp DNA fragment containing pltR with a 925 bp internal deletion. This DNA fragment was ligated to pEX18Tc to create construct p18Tc-ΔpltR. This deletion construct was introduced into the ΔpltAΔphlD mutant to make the ΔpltAΔphlDΔpltR triple mutant. The deletion of pltR was confirmed by PCR and subsequent DNA sequencing.
To delete pltM from the chromosome of Pf-5, two DNA fragments flanking the pltM gene were PCR amplified using the oligonucleotide pair pltMRL-F1/pltM-up-ovlp and pltM-dn-ovlp/pltRf. These two fragments were fused together by PCR and digested using EcoRI and KpnI to generate a 1120 bp DNA fragment containing pltM with a 1345 bp internal deletion. This DNA fragment was ligated to pEX18Tc to create construct p18Tc-ΔpltM. The construct p18Tc-ΔpltM was transferred into strain E. coli S17-1 and used to delete 1345 bp from the pltM gene in the chromosome of Pf-5. The deletion of pltM from Pf-5 was confirmed by PCR and subsequent DNA sequencing.
To complement the ΔpltM mutant, a 1661 bp DNA fragment containing pltM was PCR amplified using oligonucleotides pltM-F1 and pltM-R1. This PCR product was digested by KpnI and EcoRI and ligated downstream of the constitutively expressing promoter (Pk) of the kanamycin resistance gene in pME6010 to make the complementation construct pME6010-pltM. The plasmid pME6010-pltM was transferred into Pf-5 derivatives by bi-parental mating (Kidarsa et al., 2011).
Construction of protein overexpression constructs
For heterologous expression in Escherichia coli, the pltM coding sequence was PCR amplified using oligonucleotides pltM 5’primer and pltM 3’primer. The PCR product was digested with NdeI and XhoI, and ligated to the expression vector pET28a(+) to create the expression construct pET28a-PltM, in which pltM was expressed with a N-terminal fused 6X His Tag. Similarly, for SsuE, the ssuE coding sequence was PCR amplified using E. coli K12 genomic DNA as a template, and oligonucleotides ssuE 5’primer and ssuE 3’primer. The PCR product was digested with NdeI and HindIII and ligated to the expression vector pET28a(+) to create the expression construct pET28a-SsuE, in which SsuE was expressed with a N-terminal fused 6X His Tag.
Construction of transcriptional reporter constructs
For reporter constructs, three variants of pltL::GFP were constructed. pL-gfp contains the promoter of pltL fused to a promoterless gfp (Yan et al., 2016). The construct pRL-gfp includes the entire pltR coding sequence and the predicted promoter sequence of pltL. To make this construct, a 1600 bp DNA fragment was PCR amplified using oligonucleotides pltRr and gfp-plt-r1. The resultant PCR fragment was digested with HindIII and KpnI and ligated to pPROBE-NT to create the construct pRL-gfp. The construct pMRL-gfp contains pltM and pltR and the promoter region of pltL fused to a promoterless gfp. To make this construct, a 3050 bp DNA fragment was PCR amplified using pltM 3'primer3 and gfp-plt-r1. The resultant PCR fragment was digested with BamHI and KpnI and ligated to pPROBE-NT to create the construct pMRL-gfp.
GFP quantification
Strains P. protegens Pf-5 and P. fluorescens SBW25 containing gfp-based reporter plasmids were cultured overnight in NBGly at 27°C with shaking. The cells were washed once with fresh NBGly and used to inoculate 5 ml NBGly to an optical density of 600 nm (OD600) of 0.01. Five microliters of purified compounds at various concentrations (pyoluteorin, PG, and chlorinated derivatives of PG) or extracts (described below) were added to the 5 ml cultures. The cultures were incubated for 20 hr at 27°C with shaking. The OD600 was measured to monitor growth of the bacteria. The green fluorescence of bacteria was monitored using a 96-well plate reader (Tecan Infinite 200Pro, Männedorf, Switzerland) by measuring emission at 535 nm with an excitation at 485 nm. For each measurement, the green fluorescence value was divided by the corresponding OD600 to determine the relative GFP level. The green fluorescence emitted by cells of wild-type strains without gfp reporter constructs was determined and used for background correction.
Protein purification and in vitro activity assay
The expression plasmids pET28a-PltM and pET28a-SsuE were transformed into E. coli BL21 (DE3). Cells were grown in LB broth, supplemented with 50 mg/ml kanamycin, at 37°C to an OD600 of 0.5, induced with 0.4 mM IPTG, and grown for an additional 12 hr at 20°C. The cells were harvested and suspended in Tris-NaCl buffer (20 mM Tris pH 7.4/200 mM NaCl), and lysed by sonication. The His-tagged proteins were purified using the Ni-NTA Purification System (Invitrogen) under native purification conditions. Purified PltM and SsuE were dialyzed in Tris-NaCl-Glycerol buffer [20 mM Tris pH 7.4/200 mM NaCl/10% (vol/vol) glycerol]. The protein concentrations were determined using a DC Protein Assay (Bio-Rad) and proteins were stored at −80°C.
To test the catalytic activity of PltM, 20 μl of 56 µM PltM, 50 μl of 21 µM SsuE, 4 μl of 10 mM FAD, 10 μl of 100 mM NADPH, and 10 μl of 10 mM PG were added to 106 μl of Tris-NaCl buffer (20 mM Tris pH 7.4/200 mM NaCl). Five additional reactions were also set up, with one of the five components replaced by an equivalent volume of the Tris-NaCl buffer in each reaction. The mixtures were incubated for 3 hr at 25°C and extracted three times with ethyl acetate. The ethyl acetate extracts were dried under vacuum at room temperature and dissolved in 200 μl methanol. A volume of 5 μl from each methanol solution was added to P. fluorescens SBW25 containing the reporter plasmid pRL-gfp to determine the signaling activity of each reaction product. For LCMS analysis, the reactions were concentrated to dryness and dissolved in 100 μl methanol and 10 μl were analyzed as described below.
Quantification of MAPG, DAPG, and pyoluteorin
Pf-5 and derivative strains were inoculated at a starting OD600 of 0.01 in 5 ml NBGly and cultured for 24 hr. Four milliliters of the culture supernatant were extracted twice with ethyl acetate, then subsequently dried under vacuum, and suspended in methanol. The culture extracts were analyzed by high-performance liquid chromatography (HPLC) to quantify production of MAPG, DAPG, and pyoluteorin as described below.
To quantify the production of MAPG, DAPG and pyoluteorin by Pf-5 and derivatives, HPLC analyses were accomplished using an Agilent 1100 HPLC instrument, which consisted of a quaternary pump, vacuum degasser, autosampler, column thermostat (set to 30°C), and diode array detector. Separation was achieved using a Luna C18 column (4.6 × 150 mm, 5 μm, Phenomenex, Torrance, CA) with a flow rate of 1 ml/min where line A was water + 0.1% (vol/vol) formic acid, and line B was acetonitrile + 0.1% (vol/vol) formic acid with the following program. The column was pre-equilibrated in 90% A/10% B, and upon injection this composition was held for 2 min. The composition of the mobile phase was then changed to 0% A/100% B over 28 min using a linear gradient. This composition was held for 6 min then changed to 90% A/10% B over 2 min. The column was equilibrated in 90% A/10% B for 6 min prior to the next injection. Under these chromatographic conditions, MAPG eluted at 12.1 min, pyoluteorin eluted at 15.1 min, and DAPG eluted at 18.1 min. The HPLC was operated with and data viewed withChemStation (version B.04.03, Agilent, Santa Clara, CA). Quantification was performed by integrating the area under the curve at 300 nm and comparing with a standard curve prepared by injection of purified pyoluteorin, MAPG, and DAPG. Data were processed with GraphPad Prism (GraphPad Software, San Diego, CA).
Identification of chlorinated phloroglucinols
For LCMS analysis of crude culture extracts of the wild-type Pf-5 and the ΔpltM mutant, these two strains were grown for 20 hr in 500 ml NBGly at 27°C with shaking. The supernatants of the cultures were extracted twice with ethyl acetate (250 ml). The extracts were concentrated in vacuo to dryness. The dried extracts were dissolved in 50 µl methanol and then diluted to 400 µl with water. The large amount of precipitate formed was removed by centrifugation (15,000 x g, 60 min, 10°C), and 10 µl of the clear supernatant were analyzed by LCMS as described below.
LCMS analysis was performed using a Agilent 1260 HPLC (consisting of degasser, quaternary pump, autosampler, and diode array detector) upstream of a 6230 ESI-TOF operated in negative ionization mode with the following parameters: Mass range, 100–3200 m/z in profile mode; Gas temperature, 350°C; Drying gas, 10 L/min; Nebulizer, 40 psig; Capillary voltage, 3500 V; Fragmentor, 100 V; Skimmer, 65 V; OCT 1 RF Vpp, 750 V; Acquisition rate, five spectra/sec; Time, 200 ms/spectrum; Transients/spectrum, 1902). The synthesized authentic compounds PG-Cl, PG-Cl2 and PG-Cl3 were used as standards for comparisons in the analysis. Separation was achieved with an Extend C18 column (2 × 100 mm, 3 µm, Agilent) at a flow rate of 0.2 ml/min. The column was pre-equilibrated in 98% A/2% B, where A was water + 0.1% (vol/vol) formic acid and B was acetonitrile + 0.1% (vol/vol) formic acid. This composition was held for 1 min and then changed to 100% B over 30 min using a linear gradient. After that, the composition was held for an additional 12 min and the composition was returned to 98% A/2% B over 2 min. The column was equilibrated at 98% A/2% B for 12 min prior to injection of the next sample. The LCMS was operated with and data were viewed using MassHunter (version B.04.03, Agilent, Santa Clara, CA).
Culture extracts from the wild-type Pf-5 were also fractioned by semi-preparatory HPLC and signal activity of the fractions was tested by the reporter strain P. fluorescens SBW25 containing pRL-gfp. The wild-type Pf-5 was cultured for 20 hr in 500 ml NBGly at 27°C with shaking before being extracted twice with ethyl acetate (250 ml). The dried extracts were dissolved in 1 ml methanol and mixed with 1 ml water. The concentrated extracts were separated by semi-preparatory HPLC using a PuriFlash Pf450 (Interchim Inc., Los Angeles, CA). Separation was achieved using a Purisphere C18 column (10 × 150 mm, 10 µm, Interchim Inc.) at a flow rate of 2 ml/min. The column was pre-equilibrated in 90% A/10% B, where A was water and B was methanol. This composition was held for 2 min and then increased to 100% B over 40 min using a linear gradient and pure methanol was flown over the column for an additional 9 min. The effluent from the pump was collected directly into a 96-deep well plate in 1 min time slices after discarding the first 3 min to waste. Five microliters from each well were tested using SBW25 (pRL-gfp) and fluorescence was observed as described above.
To obtain sufficient levels of signaling molecules for LCMS analysis, the ΔgacA mutant of Pf-5 containing pME6010-pltM was cultured in three flasks, each containing 1000 ml NBGly amended with 12.5 µg/ml PG. The cultures were incubated for 20 hr at 27°C with shaking before being extracted twice with ethyl acetate (300 ml). Extracts were concentrated in vacuo to dryness. The dried extracts from the three replicate cultures were combined and dissolved in 1.5 ml methanol. A portion (200 µl) was diluted with 1.8 ml of water. The concentrated extracts were fractioned by semi-preparatory HPLC and the signal activity of the fractions were tested using SBW25 (pRL-gfp) as described above. The fractions with the highest signal activity were concentrated to dryness separately and analyzed by LCMS along with synthesized standards including PG-Cl, PG-Cl2 and PG-Cl3 as described above.
Antibiosis assay
Antibiosis of Pf-5 and derivatives against the plant pathogen E. amylovora was determined on NAGly. E. amylovora was cultured overnight in 5 ml NBGly at 27°C with shaking, and 80 μl of the cultures were inoculated into 8 ml melted NAGly (45°C), and poured over solidified NAGly in a Petri plate. This two-layer plate was air-dried with the lid open for 1 hr to solidify the agar and remove extra moisture. The ΔphlAΔpltM mutant and the ΔphlAΔphlDΔpltA mutant were cultured overnight in 5 ml NBGly at 27°C with shaking. The cells were washed once with fresh NBGly and used to make a bacterial suspension with an OD600 of 0.05. For co-culture, cells of the two mutants were combined in a 1:1 ratio for a total OD600 of 0.05. Two microliters of the bacterial suspensions were used to inoculate three two-layer plates and incubated for 3 d at 27°C. The agar medium with the Pf-5 strains in the center was cut from the plate and concentrations of DAPG and pyoluteorin in the agar were quantified as follows. Bacterial cells were carefully removed from the agar using Kimwipe. The agar was weighed, sliced into small pieces and immersed for 30 min in sterilized water before extracting twice with ethyl acetate. The extracts were dried and the residue was dissolved in 20 μl methanol and analyzed by HPLC as described above.
Statistical analysis
Statistical analyses were performed by ANOVA and Tukey multiple comparison using SPSS statistics 20 (SPSS Inc., Chicago, IL). All replicates in this study were biological replicates. Sample sizes are indicated in the figure legends. All data are presented as mean ± standard derivation.
Acknowledgements
We are grateful to Marcella Henkels, Brenda Shaffer, and Max Kohen for their assistance; Jennifer Clifford, Teresa Kidarsa, Steven Lindow, and Virginia Stockwell for helpful discussions; and the Center for Genomics Research and Biocomputing at Oregon State University for sequencing services.
Funding Statement
The funders had no role in study design, data collection and interpretation, or the decision to submit the work for publication.
Funding Information
This paper was supported by the following grants:
National Institute of Food and Agriculture NRI 2011-67019-30192 to Jeff H Chang, Joyce E Loper.
Oregon State University Research startup funds to Benjamin Philmus.
Additional information
Competing interests
The authors declare that no competing interests exist.
Author contributions
QY, Conceptualization, Formal analysis, Investigation, Writing—original draft, Writing—review and editing.
BP, Funding acquisition, Investigation, Writing—review and editing.
JHC, Supervision, Funding acquisition, Writing—review and editing.
JEL, Conceptualization, Supervision, Funding acquisition, Project administration, Writing—review and editing.
References
- Achkar J, Xian M, Zhao H, Frost JW. Biosynthesis of phloroglucinol. Journal of the American Chemical Society. 2005;127:5332–5333. doi: 10.1021/ja042340g. [DOI] [PubMed] [Google Scholar]
- Baehler E, Bottiglieri M, Péchy-Tarr M, Maurhofer M, Keel C. Use of green fluorescent protein-based reporters to monitor balanced production of antifungal compounds in the biocontrol agent Pseudomonas fluorescens CHA0. Journal of Applied Microbiology. 2005;99:24–38. doi: 10.1111/j.1365-2672.2005.02597.x. [DOI] [PubMed] [Google Scholar]
- Bangera MG, Thomashow LS. Identification and characterization of a gene cluster for synthesis of the polyketide antibiotic 2,4-diacetylphloroglucinol from Pseudomonas fluorescens Q2-87. Journal of Bacteriology. 1999;181:3155–3163. doi: 10.1128/jb.181.10.3155-3163.1999. [DOI] [PMC free article] [PubMed] [Google Scholar]
- Bergmann S, Funk AN, Scherlach K, Schroeckh V, Shelest E, Horn U, Hertweck C, Brakhage AA. Activation of a silent fungal polyketide biosynthesis pathway through regulatory cross talk with a cryptic nonribosomal peptide synthetase gene cluster. Applied and Environmental Microbiology. 2010;76:8143–8149. doi: 10.1128/AEM.00683-10. [DOI] [PMC free article] [PubMed] [Google Scholar]
- Blackman AJ, Matthews DJ. Halogenated phloroglucinols from Rhabdonia verticillata. Phytochemistry. 1982;21:2141–2142. doi: 10.1016/0031-9422(82)83072-0. [DOI] [Google Scholar]
- Bosello M, Robbel L, Linne U, Xie X, Marahiel MA. Biosynthesis of the siderophore rhodochelin requires the coordinated expression of three independent gene clusters in Rhodococcus jostii RHA1. Journal of the American Chemical Society. 2011;133:4587–4595. doi: 10.1021/ja1109453. [DOI] [PubMed] [Google Scholar]
- Brodhagen M, Henkels MD, Loper JE. Positive autoregulation and signaling properties of pyoluteorin, an antibiotic produced by the biological control organism Pseudomonas fluorescens Pf-5. Applied and Environmental Microbiology. 2004;70:1758–1766. doi: 10.1128/AEM.70.3.1758-1766.2004. [DOI] [PMC free article] [PubMed] [Google Scholar]
- Cano-Prieto C, Losada AA, Braña AF, Méndez C, Salas JA, Olano C. Crosstalk of Nataxazole Pathway with Chorismate-Derived Ionophore Biosynthesis Pathways in Streptomyces sp. Tü 6176. ChemBioChem. 2015;16:1925–1932. doi: 10.1002/cbic.201500261. [DOI] [PubMed] [Google Scholar]
- Challis GL, Hopwood DA. Synergy and contingency as driving forces for the evolution of multiple secondary metabolite production by Streptomyces species. PNAS. 2003;100 Suppl 2:14555–14561. doi: 10.1073/pnas.1934677100. [DOI] [PMC free article] [PubMed] [Google Scholar]
- Clifford JC, Buchanan A, Vining O, Kidarsa TA, Chang JH, McPhail KL, Loper JE. Phloroglucinol functions as an intracellular and intercellular chemical messenger influencing gene expression in Pseudomonas protegens. Environmental Microbiology. 2016;18:3296–3308. doi: 10.1111/1462-2920.13043. [DOI] [PubMed] [Google Scholar]
- Cui Q, Lv H, Qi Z, Jiang B, Xiao B, Liu L, Ge Y, Hu X. Cross-Regulation between the phz1 and phz2 operons maintain a balanced level of phenazine biosynthesis in Pseudomonas aeruginosa PAO1. Plos One. 2016;11:e0144447. doi: 10.1371/journal.pone.0144447. [DOI] [PMC free article] [PubMed] [Google Scholar]
- Dorrestein PC, Yeh E, Garneau-Tsodikova S, Kelleher NL, Walsh CT. Dichlorination of a pyrrolyl-S-carrier protein by FADH2-dependent halogenase PltA during pyoluteorin biosynthesis. PNAS. 2005;102:13843–13848. doi: 10.1073/pnas.0506964102. [DOI] [PMC free article] [PubMed] [Google Scholar]
- Haas D, Keel C. Regulation of antibiotic production in root-colonizing Pseudomonas spp. and relevance for biological control of plant disease. Annual Review of Phytopathology. 2003;41:117–153. doi: 10.1146/annurev.phyto.41.052002.095656. [DOI] [PubMed] [Google Scholar]
- Hassan KA, Johnson A, Shaffer BT, Ren Q, Kidarsa TA, Elbourne LD, Hartney S, Duboy R, Goebel NC, Zabriskie TM, Paulsen IT, Loper JE. Inactivation of the GacA response regulator in Pseudomonas fluorescens Pf-5 has far-reaching transcriptomic consequences. Environmental Microbiology. 2010;12:899–915. doi: 10.1111/j.1462-2920.2009.02134.x. [DOI] [PubMed] [Google Scholar]
- Heeb S, Itoh Y, Nishijyo T, Schnider U, Keel C, Wade J, Walsh U, O'Gara F, Haas D. Small, stable shuttle vectors based on the minimal pVS1 replicon for use in gram-negative, plant-associated bacteria. Molecular Plant-Microbe Interactions. 2000;13:232–237. doi: 10.1094/MPMI.2000.13.2.232. [DOI] [PubMed] [Google Scholar]
- Henkels MD, Kidarsa TA, Shaffer BT, Goebel NC, Burlinson P, Mavrodi DV, Bentley MA, Rangel LI, Davis EW, Thomashow LS, Zabriskie TM, Preston GM, Loper JE. Pseudomonas protegens Pf-5 causes discoloration and pitting of mushroom caps due to the production of antifungal metabolites. Molecular Plant-Microbe Interactions. 2014;27:733–746. doi: 10.1094/MPMI-10-13-0311-R. [DOI] [PubMed] [Google Scholar]
- Hidalgo PI, Ullán RV, Albillos SM, Montero O, Fernández-Bodega MÁ, García-Estrada C, Fernández-Aguado M, Martín JF. Molecular characterization of the PR-toxin gene cluster in Penicillium roqueforti and Penicillium chrysogenum: cross talk of secondary metabolite pathways. Fungal Genetics and Biology. 2014;62:11–24. doi: 10.1016/j.fgb.2013.10.009. [DOI] [PubMed] [Google Scholar]
- Hoang TT, Karkhoff-Schweizer RR, Kutchma AJ, Schweizer HP. A broad-host-range Flp-FRT recombination system for site-specific excision of chromosomally-located DNA sequences: application for isolation of unmarked Pseudomonas aeruginosa mutants. Gene. 1998;212:77–86. doi: 10.1016/S0378-1119(98)00130-9. [DOI] [PubMed] [Google Scholar]
- Howell CR, Stipanovic R. Control of Rhizoctonia solani on cotton seedlings with Pseudomonas fluorescens and with an antibiotic produced by the bacterium. Phytopathology. 1979;69:480–482. doi: 10.1094/Phyto-69-480. [DOI] [Google Scholar]
- Jousset A, Bonkowski M. The model predator Acanthamoeba castellanii induces the production of 2,4-DAPG by the biocontrol strain Pseudomonas fluorescens Q2-87. Soil Biology and Biochemistry. 2010;42:1647–1649. doi: 10.1016/j.soilbio.2010.05.018. [DOI] [Google Scholar]
- Jousset A, Rochat L, Péchy-Tarr M, Keel C, Scheu S, Bonkowski M. Predators promote defence of rhizosphere bacterial populations by selective feeding on non-toxic cheaters. The ISME Journal. 2009;3:666–674. doi: 10.1038/ismej.2009.26. [DOI] [PubMed] [Google Scholar]
- Keel C, Schnider U, Maurhofer M, Voisard C, Laville J, Burger U, Wirthner P, Haas D, Defago G. Suppression of root diseases by Pseudomonas fluorescens CHA0: Importance of the bacterial secondary metabolite 2,4-diacetylphloroglucinol. Molecular Plant-Microbe Interactions. 1992;5:4–13. doi: 10.1094/MPMI-5-004. [DOI] [Google Scholar]
- Keller S, Wage T, Hohaus K, Hölzer M, Eichhorn E, van Pée K-H. Purification and partial characterization of tryptophan-7-halogenase (PrnA) from Pseudomonas fluorescens. Angewandte Chemie International Edition. 2000;39:2300–2302. doi: 10.1002/1521-3773(20000703)39:13<2300::AID-ANIE2300>3.0.CO;2-I. [DOI] [PubMed] [Google Scholar]
- Kidarsa TA, Goebel NC, Zabriskie TM, Loper JE. Phloroglucinol mediates cross-talk between the pyoluteorin and 2,4-diacetylphloroglucinol biosynthetic pathways in Pseudomonas fluorescens Pf-5. Molecular Microbiology. 2011;81:395–414. doi: 10.1111/j.1365-2958.2011.07697.x. [DOI] [PubMed] [Google Scholar]
- Kidarsa TA, Shaffer BT, Goebel NC, Roberts DP, Buyer JS, Johnson A, Kobayashi DY, Zabriskie TM, Paulsen I, Loper JE. Genes expressed by the biological control bacterium Pseudomonas protegens Pf-5 on seed surfaces under the control of the global regulators GacA and RpoS. Environmental Microbiology. 2013;15:716–735. doi: 10.1111/1462-2920.12066. [DOI] [PubMed] [Google Scholar]
- Lautru S, Oves-Costales D, Pernodet JL, Challis GL. MbtH-like protein-mediated cross-talk between non-ribosomal peptide antibiotic and siderophore biosynthetic pathways in Streptomyces coelicolor M145. Microbiology. 2007;153:1405–1412. doi: 10.1099/mic.0.2006/003145-0. [DOI] [PubMed] [Google Scholar]
- Lazos O, Tosin M, Slusarczyk AL, Boakes S, Cortés J, Sidebottom PJ, Leadlay PF. Biosynthesis of the putative siderophore erythrochelin requires unprecedented crosstalk between separate nonribosomal peptide gene clusters. Chemistry & Biology. 2010;17:160–173. doi: 10.1016/j.chembiol.2010.01.011. [DOI] [PubMed] [Google Scholar]
- Li S, Huang X, Wang G, Xu Y. Transcriptional activation of pyoluteorin operon mediated by the LysR-type regulator PltR bound at a 22 bp lys box in Pseudomonas aeruginosa M18. PLoS One. 2012;7:e39538. doi: 10.1371/journal.pone.0039538. [DOI] [PMC free article] [PubMed] [Google Scholar]
- Loper JE, Hassan KA, Mavrodi DV, Davis EW, Lim CK, Shaffer BT, Elbourne LD, Stockwell VO, Hartney SL, Breakwell K, Henkels MD, Tetu SG, Rangel LI, Kidarsa TA, Wilson NL, van de Mortel JE, Song C, Blumhagen R, Radune D, Hostetler JB, Brinkac LM, Durkin AS, Kluepfel DA, Wechter WP, Anderson AJ, Kim YC, Pierson LS, Pierson EA, Lindow SE, Kobayashi DY, Raaijmakers JM, Weller DM, Thomashow LS, Allen AE, Paulsen IT. Comparative genomics of plant-associated Pseudomonas spp.: insights into diversity and inheritance of traits involved in multitrophic interactions. PLoS Genetics. 2012;8:e1002784. doi: 10.1371/journal.pgen.1002784. [DOI] [PMC free article] [PubMed] [Google Scholar]
- Loper JE, Henkels MD, Rangel LI, Olcott MH, Walker FL, Bond KL, Kidarsa TA, Hesse CN, Sneh B, Stockwell VO, Taylor BJ. Rhizoxin analogs, orfamide A and chitinase production contribute to the toxicity of Pseudomonas protegens strain Pf-5 to Drosophila melanogaster. Environmental Microbiology. 2016;18:3509–3521. doi: 10.1111/1462-2920.13369. [DOI] [PubMed] [Google Scholar]
- Maddocks SE, Oyston PC. Structure and function of the LysR-type transcriptional regulator (LTTR) family proteins. Microbiology. 2008;154:3609–3623. doi: 10.1099/mic.0.2008/022772-0. [DOI] [PubMed] [Google Scholar]
- Maurhofer M, Baehler E, Notz R, Martinez V, Keel C. Cross talk between 2,4-diacetylphloroglucinol-producing biocontrol pseudomonads on wheat roots. Applied and Environmental Microbiology. 2004;70:1990–1998. doi: 10.1128/AEM.70.4.1990-1998.2004. [DOI] [PMC free article] [PubMed] [Google Scholar]
- Miller WG, Leveau JH, Lindow SE. Improved gfp and inaZ broad-host-range promoter-probe vectors. Molecular Plant-Microbe Interactions. 2000;13:1243–1250. doi: 10.1094/MPMI.2000.13.11.1243. [DOI] [PubMed] [Google Scholar]
- Nowak-Thompson B, Chaney N, Wing JS, Gould SJ, Loper JE. Characterization of the pyoluteorin biosynthetic gene cluster of Pseudomonas fluorescens Pf-5. Journal of Bacteriology. 1999;181:2166–2174. doi: 10.1128/jb.181.7.2166-2174.1999. [DOI] [PMC free article] [PubMed] [Google Scholar]
- Nowak-Thompson B, Gould SJ, Loper JE. Identification and sequence analysis of the genes encoding a polyketide synthase required for pyoluteorin biosynthesis in Pseudomonas fluorescens Pf-5. Gene. 1997;204:17–24. doi: 10.1016/S0378-1119(97)00501-5. [DOI] [PubMed] [Google Scholar]
- O'Brien J, Wright GD. An ecological perspective of microbial secondary metabolism. Current Opinion in Biotechnology. 2011;22:552–558. doi: 10.1016/j.copbio.2011.03.010. [DOI] [PubMed] [Google Scholar]
- Ohmori T, Hagiwara S, Ueda A, Minoda Y, Yamada K. Production of pyoluteorin and its derivatives from n-paraffin by Pseudomonas aeruginosa S10B2. Agricultural and Biological Chemistry. 1978;42:2031–2036. doi: 10.1271/bbb1961.42.2031. [DOI] [Google Scholar]
- Paulsen IT, Press CM, Ravel J, Kobayashi DY, Myers GS, Mavrodi DV, DeBoy RT, Seshadri R, Ren Q, Madupu R, Dodson RJ, Durkin AS, Brinkac LM, Daugherty SC, Sullivan SA, Rosovitz MJ, Gwinn ML, Zhou L, Schneider DJ, Cartinhour SW, Nelson WC, Weidman J, Watkins K, Tran K, Khouri H, Pierson EA, Pierson LS, Thomashow LS, Loper JE. Complete genome sequence of the plant commensal Pseudomonas fluorescens Pf-5. Nature Biotechnology. 2005;23:873–878. doi: 10.1038/nbt1110. [DOI] [PMC free article] [PubMed] [Google Scholar]
- Powers MJ, Sanabria-Valentín E, Bowers AA, Shank EA. Inhibition of cell differentiation in Bacillus subtilis by Pseudomonas protegens. Journal of Bacteriology. 2015;197:2129–2138. doi: 10.1128/JB.02535-14. [DOI] [PMC free article] [PubMed] [Google Scholar]
- Pérez-Llarena FJ, Liras P, Rodríguez-García A, Martín JF. A regulatory gene (ccaR) required for cephamycin and clavulanic acid production in Streptomyces clavuligerus: amplification results in overproduction of both beta-lactam compounds. Journal of Bacteriology. 1997;179:2053–2059. doi: 10.1128/jb.179.6.2053-2059.1997. [DOI] [PMC free article] [PubMed] [Google Scholar]
- Quecine MC, Kidarsa TA, Goebel NC, Shaffer BT, Henkels MD, Zabriskie TM, Loper JE. An interspecies signaling system mediated by fusaric acid has parallel effects on antifungal metabolite production by Pseudomonas protegens strain Pf-5 and antibiosis of Fusarium spp. Applied and Environmental Microbiology. 2016;82:1372–1382. doi: 10.1128/AEM.02574-15. [DOI] [PMC free article] [PubMed] [Google Scholar]
- Raaijmakers JM, Mazzola M. Diversity and natural functions of antibiotics produced by beneficial and plant pathogenic bacteria. Annual Review of Phytopathology. 2012;50:403–424. doi: 10.1146/annurev-phyto-081211-172908. [DOI] [PubMed] [Google Scholar]
- Schnider-Keel U, Seematter A, Maurhofer M, Blumer C, Duffy B, Gigot-Bonnefoy C, Reimmann C, Notz R, Défago G, Haas D, Keel C. Autoinduction of 2,4-diacetylphloroglucinol biosynthesis in the biocontrol agent Pseudomonas fluorescens CHA0 and repression by the bacterial metabolites salicylate and pyoluteorin. Journal of Bacteriology. 2000;182:1215–1225. doi: 10.1128/JB.182.5.1215-1225.2000. [DOI] [PMC free article] [PubMed] [Google Scholar]
- Silby MW, Cerdeño-Tárraga AM, Vernikos GS, Giddens SR, Jackson RW, Preston GM, Zhang XX, Moon CD, Gehrig SM, Godfrey SA, Knight CG, Malone JG, Robinson Z, Spiers AJ, Harris S, Challis GL, Yaxley AM, Harris D, Seeger K, Murphy L, Rutter S, Squares R, Quail MA, Saunders E, Mavromatis K, Brettin TS, Bentley SD, Hothersall J, Stephens E, Thomas CM, Parkhill J, Levy SB, Rainey PB, Thomson NR. Genomic and genetic analyses of diversity and plant interactions of Pseudomonas fluorescens. Genome Biology. 2009;10:R51–16. doi: 10.1186/gb-2009-10-5-r51. [DOI] [PMC free article] [PubMed] [Google Scholar]
- Simon R, Priefer U, Pühler A. A broad host range mobilization system for in vivo genetic engineering: transposon mutagenesis in gram negative bacteria. Bio/Technology. 1983;1:784–791. doi: 10.1038/nbt1183-784. [DOI] [Google Scholar]
- Thomas MG, Burkart MD, Walsh CT. Conversion of L-proline to pyrrolyl-2-carboxyl-S-PCP during undecylprodigiosin and pyoluteorin biosynthesis. Chemistry & Biology. 2002;9:171–184. doi: 10.1016/S1074-5521(02)00100-X. [DOI] [PubMed] [Google Scholar]
- Traxler MF, Kolter R. Natural products in soil microbe interactions and evolution. Nat. Prod. Rep. 2015;32:956–970. doi: 10.1039/C5NP00013K. [DOI] [PubMed] [Google Scholar]
- Tsunematsu Y, Ishikawa N, Wakana D, Goda Y, Noguchi H, Moriya H, Hotta K, Watanabe K. Distinct mechanisms for spiro-carbon formation reveal biosynthetic pathway crosstalk. Nature Chemical Biology. 2013;9:818–825. doi: 10.1038/nchembio.1366. [DOI] [PubMed] [Google Scholar]
- Vingadassalon A, Lorieux F, Juguet M, Le Goff G, Gerbaud C, Pernodet JL, Lautru S. Natural combinatorial biosynthesis involving two clusters for the synthesis of three pyrrolamides in Streptomyces netropsis. ACS Chemical Biology. 2015;10:601–610. doi: 10.1021/cb500652n. [DOI] [PubMed] [Google Scholar]
- Yan Q, Philmus B, Hesse C, Kohen M, Chang JH, Loper JE. The rare codon AGA Is involved in regulation of pyoluteorin biosynthesis in Pseudomonas protegens Pf-5. Frontiers in Microbiology. 2016;7:497. doi: 10.3389/fmicb.2016.00497. [DOI] [PMC free article] [PubMed] [Google Scholar]
- Yim G, Wang HH, Davies J. Antibiotics as signalling molecules. Philosophical Transactions of the Royal Society B: Biological Sciences. 2007;362:1195–1200. doi: 10.1098/rstb.2007.2044. [DOI] [PMC free article] [PubMed] [Google Scholar]


