. 2017 Mar 6;6:e22835. doi: 10.7554/eLife.22835

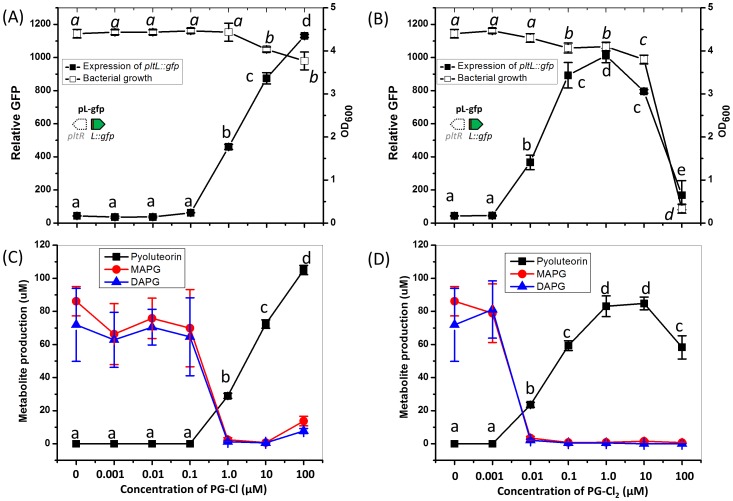
Figure 6. Influence of PG-Cl (left) and PG-Cl2 (right) on expression of pltL::gfp (A, B) and production of pyoluteorin (C, D) in the ΔpltM mutant of P. protegens Pf-5.

The ΔpltM mutant was cultured in NBGly amended with increasing concentrations of PG-Cl and PG-Cl2. To test the regulatory effects of PG-Cl and PG-Cl2 on expression of pyoluteorin biosynthetic genes, GFP activity was determined from the ΔpltM mutant containing pL-gfp 20 hr after inoculation (A, B). The OD600 value of bacterial cultures (24 hr after inoculation) was measured to show the influence of PG-Cl and PG-Cl2 on the bacterial growth (A, B). The bacterial cultures were extracted 24 hr after inoculation and production of pyoluteorin, MAPG and DAPG were quantified (C, D). Letters above the symbols indicate treatments significantly different from one another, as determined by ANOVA analysis (p<0.05). Data are means of at least three biological replicates from a representative experiment repeated twice with similar results, and error bars represent the standard deviation of the mean.

DOI: http://dx.doi.org/10.7554/eLife.22835.018

Figure 6—source data 1. Expression of pltL::gfp and production of pyoluteorin by the ΔpltM mutant of Pf-5 in response to chlorinated phloroglucinols.
The production of MAPG and DAPG is also shown.
DOI: 10.7554/eLife.22835.019

Figure 6.

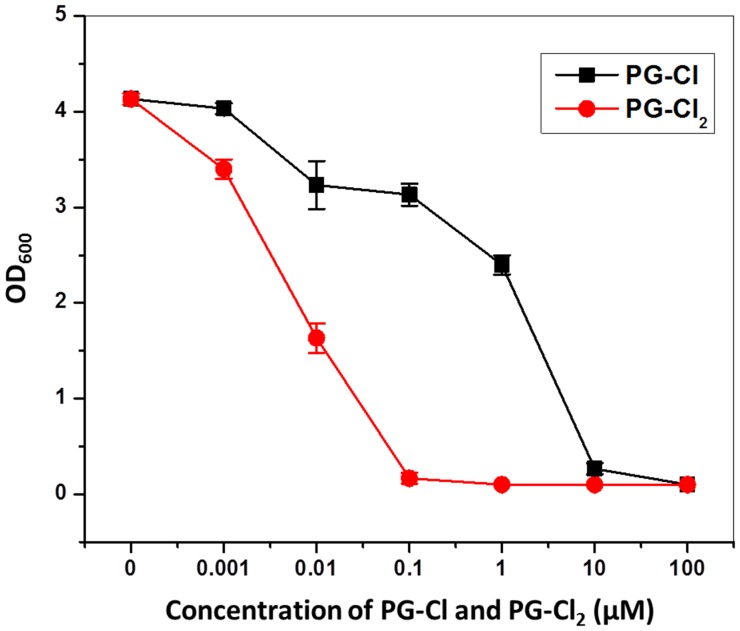
Figure 6—figure supplement 1. Effect of PG-Cl and PG-Cl2 on growth of P. fluorescens SBW25.

Figure 6—figure supplement 1.

Strain SBW25 was cultured in NBGly amended with PG-Cl and PG-Cl2. The final concentrations of the compounds used in the cultures are indicated. Bacterial growth was recorded by measuring OD600 value of the cultures at 20 hr. Data are means of three biological replicates, and error bars represent the standard deviation of the mean. The experiment was done at least twice with similar results and results from one experiment are shown.
Figure 6—figure supplement 1—source data 1. Toxicity of PG-Cl and PG-Cl2 to P. fluorescens SBW25.
PG-Cl and PG-Cl2 were tested at different concentrations as indicated. 0 means methanol was added to the cultures as a control.
DOI: 10.7554/eLife.22835.021
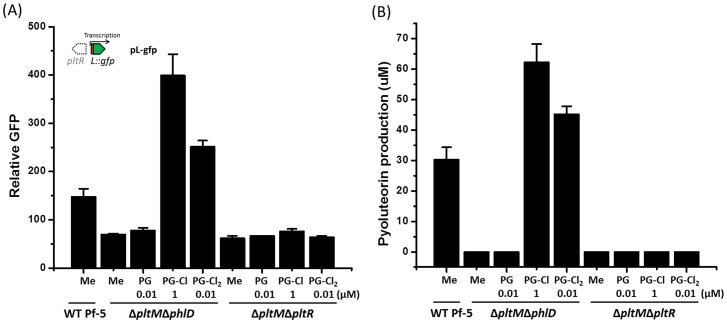
Figure 6—figure supplement 2. Effect of PG-Cl and PG-Cl2 on expression of pltL::gfp (A) and production of pyoluteorin (B) in the ΔpltMΔphlD mutant and the ΔpltMΔpltR mutant of P. protegens Pf-5.

Figure 6—figure supplement 2.

The ΔpltMΔphlD mutant and the ΔpltMΔpltR mutant were cultured in NBGly broth with addition of PG-Cl and PG-Cl2. The final concentrations of the compounds (µM) used in the cultures are shown. (A) To test the regulatory effects of PG-Cl and PG-Cl2 on expression of pyoluteorin biosynthetic genes, the mutants containing pL-gfp were used. The expression level of pltL::gfp was monitored and recorded as relative GFP, which was calculated as GFP divided by OD600. (B) To test the regulatory effect of PG-Cl and PG-Cl2 on the production of pyoluteorin, secondary metabolites were extracted from the cultures and analyzed by HPLC. Data are means of three biological replicates from a representative experiment repeated two times with similar results, and error bars represent the standard deviation of the mean.
Figure 6—figure supplement 2—source data 1. Expression of pltL::gfp and the production of pyoluteorin by Pf-5 wild-type (WT) and its derivatives in response to chlorinated phloroglucinols.
DOI: 10.7554/eLife.22835.023
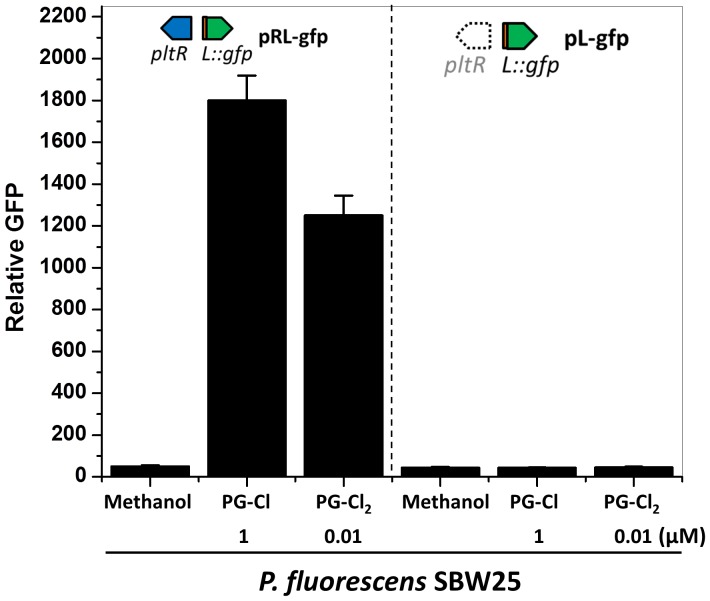
Figure 6—figure supplement 3. Effect of PG-Cl and PG-Cl2 on the expression of pltL::gfp in P. fluorescens SBW25.

Figure 6—figure supplement 3.

SBW25 strains containing reporter construct pRL-gfp (left of dotted line) and pL-gfp (right of dotted line) were cultured in NBGly amended with PG-Cl and PG-Cl2. The final concentrations of the compounds (µM) used in the cultures are indicated. The same volume of methanol was added to the cultures serving as negative controls (Methanol). The expression level of pltL::gfp was monitored and recorded as relative GFP, which was calculated as GFP divided by OD600. Data are means of three biological replicates from a representative experiment repeated three times with similar results, and error bars represent the standard deviation of the mean.
Figure 6—figure supplement 3—source data 1. Expression of pltL::gfp by SBW25 containing pL-gfp or pRL-gfp in response to chlorinated phloroglucinols.
DOI: 10.7554/eLife.22835.025