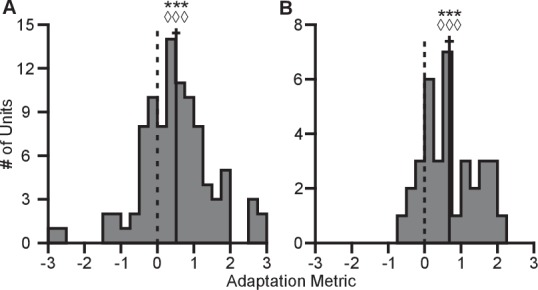
Figure 6. Completeness of adaptation.

The two panels show histograms of the completeness metric for Monkey A (A) and Monkey C (B). For both panels: solid vertical lines, means of distributions; solid horizontal lines, mean SE; dashed vertical lines, zero point representing no dynamic range adaptation. For both monkeys, histograms were distributed significantly away from the zero point (Monkey A: ***, Wilcoxon signed-rank test, , , sign test, , units; Monkey C: ***, , , , units). The means ( SE) of the metrics were 0.5157 ( 0.1121) for Monkey A and 0.6793 ( 0.1233) for Monkey C. Data to recreate these plots is available in Figure 6—source data 1.
DOI: http://dx.doi.org/10.7554/eLife.21409.024
