

Abstract
Achieving therapeutic anticoagulation efficiently with warfarin is important to reduce thrombotic and bleeding risks and is influenced by genotype. Utilizing data from a diverse population of 257 patients who received VKORC1 and CYP2C9 genotype-guided warfarin dosing, we aimed to examine genotype-associated differences in anticoagulation endpoints and derive a novel pharmacogenetic nomogram to more optimally dose warfarin. We observed significant differences across patients with 0, 1, or ≥2 reduced-function VKORC1 or CYP2C9 alleles, respectively, in time to achieve therapeutic international normalized ratio (INR) (7.8±5.8, 7.2±4.7, and 5.4±4.6 days, P=0.0004) and mean percentage of time in therapeutic range in the first 28 days (22.2, 27.8, and 32.2%, P=0.0127) with use of existing pharmacogenetic algorithms. These data suggest that more aggressive dosing is necessary for patients with 0 to 1 VKORC1/CYP2C9 variants to more efficiently achieve therapeutic anticoagulation. Herein, we provide a novel kinetic/pharmacodynamic-derived dosing nomogram optimized for a heterogeneous patient population.
Keywords: warfarin, pharmacogenetics, pharmacometrics, dosing nomogram, precision medicine
Introduction
Warfarin remains the most commonly prescribed oral anticoagulant in the U.S. despite the recent approval of direct oral anticoagulants (DOACs).(1, 2) While use of DOACs will likely increase over time for many indications based on recent practice guidelines (3), warfarin will likely remain an important option for anticoagulation, especially for older patients, those with greater morbidity, those who fail treatment with DOACs, and socioeconomically disadvantaged populations who may have limited access to newer agents due to high costs and copays.(2, 4) Additionally, assays to measure plasma levels of DOACs are not widely available to guide decisions about timing of urgent surgeries or assessing DOAC contribution to severe bleeding, further limiting DOAC use.(5) Warfarin use, on the other hand, is hindered by the drug’s narrow therapeutic window and significant inter-patient variability in the dose necessary for therapeutic anticoagulation.(6–8)
Prompt achievement of therapeutic anticoagulation is a major goal when initiating warfarin, especially in patients with acute thromboembolism, because the rates of thrombotic progression and reoccurrence are highest in the first few months after diagnosis.(9–13) At the same time, the risk for major bleeding events is 10-fold higher during the first month following warfarin initiation than for the remainder of therapy (14), likely influenced by inappropriate initial warfarin dosing. Traditionally, warfarin is started at a fixed dose of 5 mg/day, with dose adjustment based on the international normalized ratio (INR) response.(3) However, time to achieve therapeutic anticoagulation is often prolonged with this approach, placing patients at increased risk for thrombotic events and/or bleeding complications.(15, 16)
Genetic variation significantly influences warfarin dose requirements, time to achieve therapeutic anticoagulation, rate of INR increase, and risk for supra-therapeutic anticoagulation and major bleeding.(17–19). The two most relevant pharmacogenes are those encoding for vitamin K epoxide reductase complex 1 (VKORC1), warfarin’s pharmacological target, and cytochrome P450 (CYP)2C9, the primary metabolic enzyme for S-warfarin.(19–21) The reduced-function VKORC1 -1639A and CYP2C9*2,*3, *5, *6, and *11 alleles are associated with increased warfarin sensitivity, lower warfarin dose requirements, and an increased risk for supra-therapeutic anticoagulation and major bleeding during warfarin initiation.(7, 17, 18, 22) The VKORC1 AA genotype is associated with decreased time to achieve therapeutic anticoagulation.(17)
In an effort to improve warfarin dosing, decrease the time to reach therapeutic anticoagulation, and reduce the risk for supra-therapeutic anticoagulation, we clinically implemented genotype-guided warfarin dosing utilizing recommended pharmacogenetic algorithms (23–26) for hospitalized patients newly starting warfarin at the University of Illinois Hospital and Health Sciences System (UI Health) in 2012.(27) The purpose of this study was to compare anticoagulation-related endpoints by genotype group among patients receiving genotype-guided dosing with the use of recommended pharmacogenetic dosing algorithms in a real world setting. We also sought to derive a novel dosing nomogram to more optimally dose warfarin.
Results
Patient characteristics and outcomes
A total of 257 patients were included in the study. The mean age of the study population was 51 years, and 49% were female. The majority were African American (55%) and receiving warfarin for the treatment of acute venous thromboembolism (62%). Genotype results were available prior to administration of the second warfarin dose for 88% of patients. When stratified by number of variant VKORC1 or CYP2C9 alleles, 52% of patients had zero, 29% had one, and 19% had ≥2 reduced-function alleles. With the exception of race, there were no significant differences in demographic characteristics, baseline INR, or warfarin indication among these genetic subgroups (i.e. 0, 1, or ≥2 variant VKORC1 or CYP2C9 alleles, Table 1). As anticipated based on reported genotype frequencies,(28) most African Americans had no variant alleles, and most Caucasians had at least one variant. The most common VKORC1 genotype observed was −1639GG, consistent with the large percentage of African Americans.
Table 1.
Baseline characteristics by genetic subgroups
| Baseline Characteristics | All patients (n=257) |
Genetic subgroup
|
P-value† | ||
|---|---|---|---|---|---|
| No variants (n=133) |
1 variant (n=75) |
≥2 variants (n=49) |
|||
| Age (years), mean ± SD | 51 ± 16 | 51 ± 15 | 50 ± 17 | 53 ± 16 | 0.61 |
|
| |||||
| Female sex, % | 49.4 | 49.6 | 48.0 | 51.0 | 0.95 |
|
| |||||
| BSA (m2), mean ± SD | 2.1 ± 0.4 | 2.1 ± 0.4 | 2.0 ± 0.4 | 2.0 ± 0.3 | 0.22 |
|
| |||||
| Baseline INR, mean ± SD | 1.2 ± 0.1 | 1.2 ± 0.1 | 1.2 ± 0.2 | 1.2 ± 0.1 | 0.95 |
|
| |||||
| Self-reported race/ethnicity, % | |||||
| African American | 55.3 | 77.4 | 38.7 | 20.4 | <0.0001 |
| Non-Hispanic Caucasian | 15.6 | 8.3 | 20.0 | 28.6 | |
| Hispanic Caucasian | 17.1 | 6.8 | 28.0 | 28.6 | |
| Asian | 2.3 | 0.8 | 1.3 | 8.2 | |
| Other | 9.7 | 6.8 | 12.0 | 14.3 | |
|
| |||||
| Warfarin indication, % | |||||
| VTE | 62.3 | 66.9 | 57.3 | 57.1 | 0.28 |
| Atrial fibrillation | 19.1 | 16.5 | 22.7 | 20.4 | 0.54 |
| Atrial or ventricular thrombus | 4.3 | 5.3 | 2.7 | 4.1 | 0.72 |
| Cardioembolic stroke | 3.5 | 2.3 | 6.7 | 2.0 | 0.22 |
| Cerebral venous thrombosis | 3.5 | 3.0 | 1.3 | 8.2 | 0.15 |
| Other* | 7.4 | 6.0 | 9.3 | 8.2 | 0.63 |
|
| |||||
| Setting of first therapeutic INR (n=173) | |||||
| Inpatient, % | 60.7 | 65.1 | 52.8 | 62.2 | 0.36 |
| Outpatient, % | 39.3 | 34.9 | 47.2 | 37.8 | |
INR – international normalized ratio; SD – standard deviation; VTE – venous thromboembolism
P-values were generated from χ2 test of independence or analysis of variance (ANOVA) in order to assess differences among the 3 genetic subgroups (i.e. 0, 1, or ≥2 reduced-function alleles)
Arterial dissection, splenic vein thrombosis, antiphospholipid antibody syndrome, heart failure, pulmonary hypertension, arteriovenous fistula thrombus, inferior vena cava thrombus, portal vein thrombosis, peripheral vascular disease graft, heel ulcer, renal vein thrombosis, right internal jugular thrombosis
UI Health providers adhered to genotype-guided dose recommendations by the Personalized Medicine Program (PMP) (within 0.5 mg) 84% of the time. Accordingly, mean daily warfarin doses administered during hospitalization differed significantly by genetic subgroup (P<0.0001), with the lowest doses in patients with ≥2 reduced-function alleles (Figure 1). The association remained significant when analyzed within African American and non-African American subsets (Figure S-1). Twenty-six percent of patients received a loading dose on day 1 or 2, which was similar among genetic subgroups. The median length of hospitalization was 7 (IQR 3–14) days and did not differ by genetic subgroup.
Figure 1.
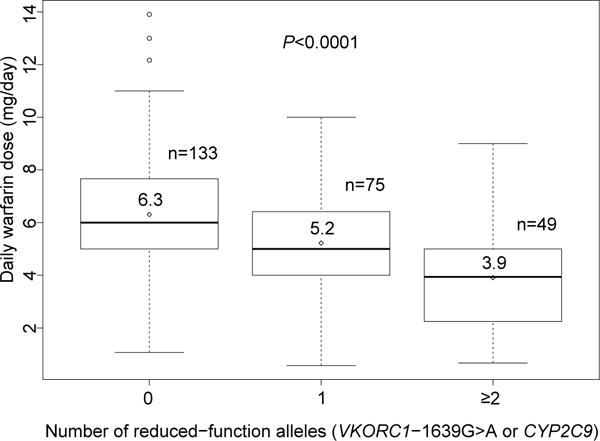
Box plots of daily warfarin dose during hospitalization by genetic subgroups for all study participants. The diamonds represent means and lines within boxes represent medians. The upper and lower boundaries of the boxes mark the 3rd and 1st quartile. The whiskers above the boxes represent the smaller value of the maximum and 3rd quartile plus 1.5 multiplied by the interquartile range, whereas the whiskers below the boxes represent the larger value of the minimum and 1st quartile minus 1.5 multiplied by the interquartile range. Circles represent outliers.
A total of 173 patients (67%) reached a therapeutic INR within the initial 28 days of warfarin therapy. The remaining 84 patients were censored observations in the time-to-event analysis. Controlling for race and inpatient status at the time of therapeutic INR, time to reach first therapeutic INR varied significantly across the 3 genetic subgroups, with patients reaching therapeutic anticoagulation earlier with each additional reduced-function allele (P=0.0004, Table 2). Consistent with this observation, the rate of INR rise also significantly differed among genetic subgroups, with a greater rise with each additional reduced-function allele (P<0.0001, Table 2). When stratifying by race, we observed similar trends for time to first therapeutic INR and rate of INR rise in African American and non-African American subgroups (Table S-1). As expected, the time to first therapeutic INR and rate of INR increase were inversely correlated (r= −0.88, P<0.0001).
Table 2.
Anticoagulation metrics by genetic subgroups
| Number of variant alleles (VKORC1-1639G>A or CYP2C9) |
P-value | |||
|---|---|---|---|---|
| 0 | 1 | ≥2 | ||
| Time to first therapeutic INR (days), mean ± SD | (n=83) 7.8 ± 5.8 |
(n=53) 7.2 ± 4.7 |
(n=37) 5.4 ± 4.6 |
0.0004 |
|
| ||||
| Rate of INR increase, mean ± SD | (n=83) 0.21 ± 0.16 |
(n=53) 0.23 ± 0.19 |
(n=37) 0.38 ± 0.31 |
<0.0001 |
|
| ||||
| Patients with an INR >4, % | (n=133) 5.3 |
(n=75) 10.7 |
(n=49) 14.3 |
0.1151 |
|
| ||||
| Daily warfarin dose during hospitalization (in mg), mean ± SD | (n=133) 6.3 ± 2.5 |
(n=75) 5.2 ± 1.9 |
(n=49) 3.9 ± 1.9 |
<0.0001 |
INR – international normalized ratio; SD – standard deviation
The time-to-event analysis showed a significant difference among genetic subgroups in probability of achieving therapeutic INR in the initial 28 days (Figure 2, Wilcoxon test of equality over strata P = 0.0077). There was a distinct separation of the Kaplan-Meier curves around day 10, and thus, probability of achieving therapeutic INR was examined in 2 intervals: days 0–10 and days 11–28. Adjusting for race and inpatient status, there was an increased chance of achieving first therapeutic INR at any time between days 0 and 10 with each additional reduced-function allele (HR 1.44, 95% CI 1.14–1.81, P=0.0019), while there was no significant association between genetic subgroup and achieving first therapeutic INR between days 11 and 28 (HR 0.99, 95% CI 0.59–1.64, P=0.9524). For patients with 0, 1, and ≥2 reduced-function alleles, mean percentage of time in therapeutic range in the first 28 days was 22.2, 27.8, and 32.2% (P=0.0127), and mean percentage of time below therapeutic range was 72.1, 61.1, and 57.0% (P=0.0016), respectively (Figure 3). Patients with ≥1 reduced-function alleles were more likely to have an INR >3 in the later phase (days 11–28) than those without variant alleles (P=0.0178). Twenty-two patients (8.6%) had an INR >4 over the course of follow-up. The percentage of patients with an INR>4 did not differ among genetic subgroups in the study population overall (P=0.1151, Table 2), or within the African American and non-African American subsets (Table S-1). However, it was nearly three times more common among patients with ≥2 versus 0 reduced-function alleles (P=0.0427 overall).
Figure 2.

Kaplan-Meier time-to-event function estimates for patients with 0, 1, or ≥2 reduced-function alleles
Figure 3.
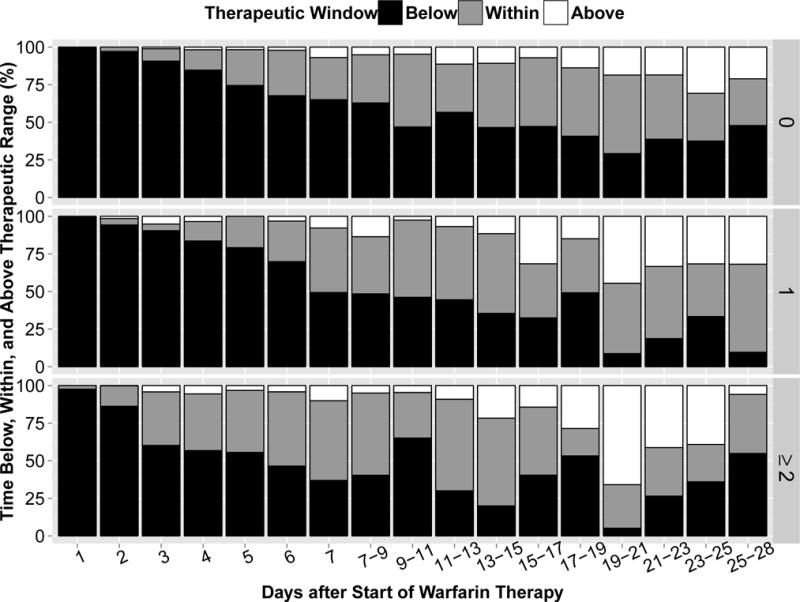
Percentage of time in INR range (as calculated by Rosendaal method)(45) that is i) above 3 (red) ii) below 2 (blue) and iii) within 2-3 (green) for patients with 0, 1, and ≥2 variant alleles
Optimized warfarin dosing nomogram
To decrease the time required to reach therapeutic INR in patients with 0 or 1 reduced-function VKORC1 or CYP2C9 alleles, a dosing nomogram was developed based on clinical trial simulations (Supplementary Material). The nomogram consists of a loading dose grid (Table 3A), accounting for genotype, to be utilized on days 1–2 and a maintenance dosing grid and calculation (Table 3B), accounting for genotype and age, to be utilized beginning on day 3 for maintenance dosing. Incremental dose adjustments (Table 3C) can be made on days 3, 5/6, and/or 7/8/9 to compensate for additional variability in dose/response reflected by INR measurements. To confirm the validity of our approach, maintenance doses calculated from our proposed nomogram were compared to recommended warfarin doses from the FDA-approved label (29) for different combinations of VKORC1 and CYP2C9 (Figure 4) variants; in most cases, there was less than 30% difference from the label recommendations.
Table 3.
Novel pharmacogenetics-based dosing nomogram†
| A)
| |||||||
|---|---|---|---|---|---|---|---|
| VKORC1 | CYP2C9 | ||||||
| *1/*1 | *1/*2 | *1/*3 | *1/*8 or *8/*8Δ | *2/*2 | *2/*3 | *3/*3 | |
| GG | 9 | 9 | 9 | 6.25 | 6.5 | 6.5 | 6.5 |
| GA | 9 | 6.5 | 6.5 | 6.25 | 5 | 5 | 5 |
| AA | 3 | 3 | 3 | 2 | 3 | 3 | 3 |
| B) | |||||||
|---|---|---|---|---|---|---|---|
|
Maintenance Dose (mg) = “Pharmacogenetics-based dose grid” − 0.01× Age
| |||||||
| CYP2C9 | |||||||
| VKORC1 | *1/*1 | *1/*2 | *1/*3 | *1/*8 or *8/*8 Δ | *2/*2 | *2/*3 | *3/*3 |
| GG | 8 | 6 | 5.5 | 5.5 | 3.75 | 2.75 | 2.5 |
| GA | 6.25 | 4.75 | 4.0 | 4.25 | 2.75 | 2.5 | 2.0 |
| AA | 3 | 2.5 | 2.5 | 2 | 2.25 | 1.75 | 1.5 |
| C)
| ||
|---|---|---|
| INR | Dose Adjustment | |
| Day 3 | < 1.3 | ↑ 10% |
| 1.3–1.5 | No change | |
| 1.6–1.8 | ↓ 10% | |
| 1.9–2.1 | ↓ 20% | |
| 2.2–2.5 | ↓ 50% | |
| > 2.5 | Hold dose for 1 day, then ↓ 50% | |
|
| ||
| Day 5/6 | < 1.3 | ↑ 50% |
| 1.4–1.7 | ↑ 20% | |
| 1.8–2.5 | No change | |
| 2.6–3.0 | ↓ 20% | |
| 3.1–3.9 | ↓ 50% | |
| ≥ 4.0 | Hold dose for 1 day, then ↓ 50% | |
|
| ||
| Day 7/8/9 | < 1.5 | ↑ 20% |
| 1.5–1.9 | ↑ 10% | |
| 2.0–2.8 | No change | |
| 2.9–3.5 | ↓ 10% | |
| 3.6–4.0 | Hold dose for 1 day, then ↓ 15% | |
| ≥ 4.0 | Hold dose, test INR daily until in range (2–3), then ↓ 25% | |
↑ indicates dose increase; ↓ indicates dose decrease
A) Pharmacogenetics-based loading dose grid according to VKORC1 and CYP2C9 genotypes to be used for days 1 and 2; B) Pharmacogenetics-based dose grid in maintenance dose calculation to be used starting on day 3; C) Dose-adjustment nomogram during warfarin initiation. All doses are determined by assuming a normal INR value of 1 prior to initiation.
Based on the relative difference in clearances (37), reduction in dosing by 30% is recommended for CYP2C9 *1/*8 or *8/*8 (found in African Americans), as compared to *1/*1.
Rounded to the nearest 0.25 milligrams.
Figure 4.
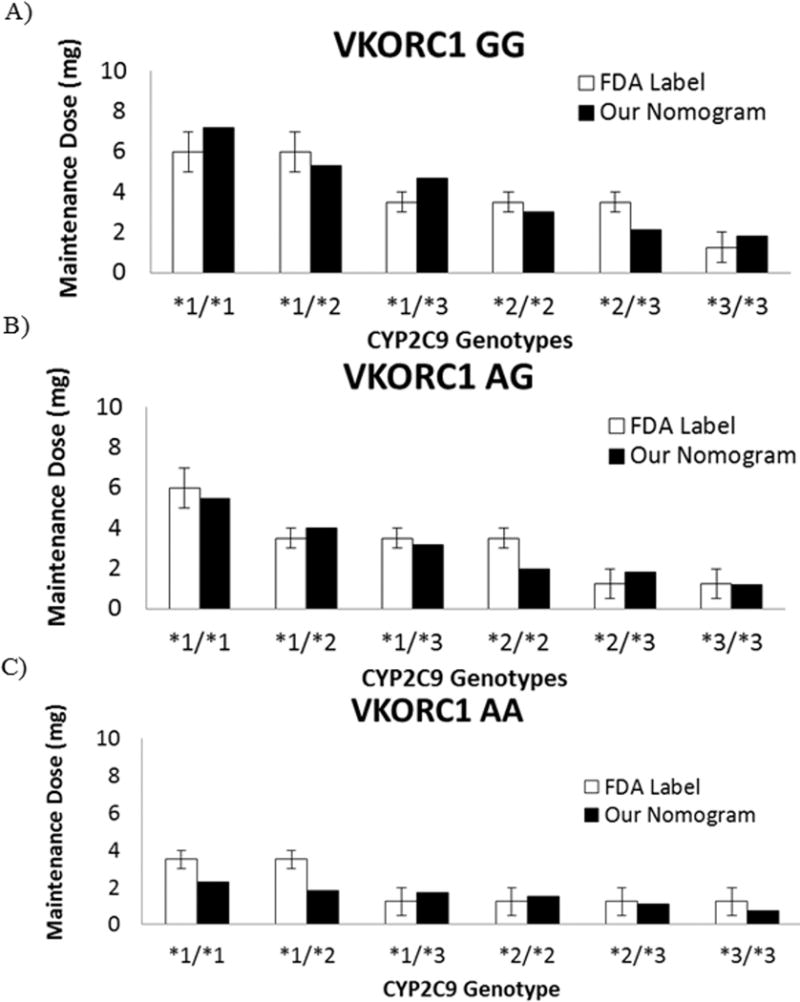
A-C) Comparison of warfarin maintenance doses for a 70-year old individual calculated using our nomogram vs. dose recommendations shown on the FDA-approved label for warfarin (Coumadin®) (29) as stratified by VKORC1 and CYP2C9 genotypes.
Error bar indicates the recommended dose range from the label.
Discussion
The VKORC1 and CYP2C9 genotypes are significant contributors to warfarin dose requirements and influence time to reach therapeutic anticoagulation and risk for over-anticoagulation and bleeding during warfarin initiation.(17–19) Based on this evidence, the FDA-approved warfarin (Coumadin®) product label provides average warfarin dose recommendations based on CYP2C9*2 and *3 and VKORC1 genotypes, (29) and the Clinical Pharmacogenetics Implementation Consortium (CPIC) recommends dosing warfarin based on genotype when genotype results are available. (23) CPIC further recommends the use of pharmacogenetic dosing algorithms, specifically citing algorithms by the IWPC and by Gage et al.(24–26) Both were derived from large patient populations, largely of European descent, and are publicly available through the www.warfarindosing.org website.
Ideally, use of genotype information to dose warfarin would eliminate differences in anticoagulation endpoints that are observed by genotype with traditional dosing. However, we found significant differences in such endpoints despite use of recommended pharmacogenetic dosing algorithms. Specifically, we found that patients with 2 or more reduced-function VKORC1 and/or CYP2C9 alleles reached a therapeutic INR rapidly, in some cases as early as day 2 of warfarin therapy. These patients were at an increased risk of having an INR above therapeutic range in the initial 4 weeks of therapy and were more likely than patients without a variant allele to have an INR >4, a level associated with increased bleeding risk.(13, 30) Conversely, there was a significant delay in achieving therapeutic INR among patients with 0 to 1 reduced-function alleles, and these patients were significantly less likely to reach a therapeutic INR in the initial 10 days of therapy. Although there were a limited number of African Americans in our study with 2 or more reduced-function alleles, similar trends were observed in the African American subset as in the population overall, suggesting that the findings extend across race groups. These data suggest that more aggressive dosing is needed early in the course of therapy for patients with ≤1 variant allele to prevent delays in achieving therapeutic anticoagulation, while more cautious dosing may be warranted in patients with multiple variant alleles to avoid over-anticoagulation.
A limitation with the algorithms used in this study is that they were derived from patients receiving stable warfarin doses during the maintenance phase of therapy, rather than from patients newly starting warfarin. As such, they were not designed to provide genotype-specific loading dose recommendations. Less than 30% of patients with 0 to 1 reduced-function alleles received a loading dose in our study. However, our data suggest that loading doses are needed in these patients to facilitate earlier attainment of therapeutic anticoagulation. In contrast, patients with multiple reduced-function alleles attain therapeutic anticoagulation quickly, and could potentially be harmed by loading doses. Further, the algorithms used in our study were derived from populations that had relatively few patients of African and Latino descent, who comprised the majority of our study population. Previous studies have shown that these algorithms perform worse in African Americans compared to Caucasians,(31, 32) suggesting a need for novel algorithms that perform well in non-European patients.
We believe our findings may help explain the negative outcomes with genotype-guided dosing observed in the COAG trial.(33) Specifically, COAG participants in the pharmacogenetic arm were dosed according to the Gage et al. algorithm used most often at our institution. The COAG trial found no benefit with regard to percentage of time in the therapeutic INR range during the initial 28 days of therapy with genotype-guided dosing compared to clinically-based dosing in an ethnically diverse cohort, in which 27% of study participants were African American.(33) Although a quarter of the COAG trial population was of African descent, investigators only tested for CYP2C9 reduced-function variants more commonly found in Caucasians. Furthermore, most African Americans have the VKORC1 GG genotype,(32) and our data suggest that the algorithm used in COAG would not have been sufficient for patients with the GG genotype (and 0 to 1 CYP2C9 allele) to facilitate efficient attainment of therapeutic anticoagulation. Moreover, our data suggest that dosing used in the COAG trial would also be insufficient for patients with the VKORC1 AG, CYP2C9*1/*1 genotype combination, which is most commonly observed in Europeans.
Herein, we propose a novel warfarin dosing nomogram based on kinetic/pharmacodynamic (K/PD) modeling and simulation that may adequately account for the dynamic aspects of warfarin dose response, and may more effectively attenuate differences in anticoagulation endpoints observed by genotype with use of existing pharmacogenetic algorithms. Given that warfarin inhibits the production of coagulation factors II, VII, IX, and X and that factor II has a half-life of about 60 hours, the full anticoagulant effects of warfarin are delayed until factor II reaches steady state; (34) current pharmacogenetic algorithms based on multivariable linear regression are unable to account for this delay between pharmacokinetics (PK) and pharmacodynamics (PD). In contrast to these regression-based algorithms that only provide a stable dose prediction, our dynamic dosing nomogram includes loading doses to be utilized on days 1 and 2, maintenance doses to be utilized starting day 3, and incremental dose adjustments to be made depending on the INR values at three “checkpoints” during the first week of initiation. The uniqueness of our nomogram is in its distinct genotype-specific loading and maintenance dose recommendations, designed to facilitate efficient and safe attainment of therapeutic anticoagulation across genotypes during the critical initiation phase. The application of this nomogram in virtual European and ethnically diverse patients eradicated overall differences in INR response profiles among genotype groups. Based on our simulations, our nomogram could potentially enable ethnically diverse individuals to achieve a therapeutic INR within one week, across VKORC1 and CYP2C9 genotypes. Although our dosing nomogram performed well in simulations, it requires prospective application and evaluation to confirm that it improves time to therapeutic INR and time within therapeutic range.
A limitation to our study is that neither the CYP2C9*8 variant nor the rs12777823 A>G variant, identified in a recent African American genome wide association study of warfarin dose response,(35) were included on the genotyping panel at UI Health. Therefore, the effect of accounting for these variants on anticoagulation endpoints could not be examined. An additional limitation is that our nomogram does not include variants other than VKORC1 and CYP2C9*2, *3, and *8. Without available PK data for patients in this study, we borrowed PK parameters for CYP2C9*1, *2, and *3 from Hamberg et al. (36) to estimate our own PD parameters for modeling. We used clearance data for CYP2C9*8 from Liu et al. (37) to extrapolate dose reduction in *8 carriers. We did not include other CYP2C9 variants in our nomogram due to lack of PK data of sufficient sample size needed for modeling. However, based on available in-vitro PK data, we suggest the following: use dosing recommendations for CYP2C9*1/*3 for patients with the *1/*5 or *1/11 genotype and dosing recommendations for the *2/*3 genotype for patients with the *1/*6 genotype.(37–39) For African Americans with the rs12777823A allele, after selecting a warfarin dose based on the nomogram for CYP2C9 and VKORC1 genotypes, we suggest reducing the weekly warfarin dose by 15% for the AG genotype and 25% for the AA genotype, based on dose requirements in previous studies.(35) Another limitation is that our data and associated nomogram are only generalizable to patients with a target INR range of 2–3. Further, 39% of patients did not have outpatient follow-up after hospital discharge, and since many were discharged before reaching therapeutic anticoagulation, this contributed to the fairly low percentage of time within therapeutic range values we observed. Lastly, the number of patients who received loading doses in our study was low, and thus we could not assess the effect of loading doses on anticoagulation-related outcomes.
In summary, our data from a real world setting suggest that genotype-guided dosing with recommended pharmacogenetic algorithms fails to eliminate differences in anticoagulation endpoints by genotype in a diverse patient population. More aggressive dosing appears necessary in patients with 0 to 1 reduced-function VKORC1 or CYP2C9 alleles to reduce time to achieve therapeutic INR. Conversely, carriers of multiple reduced-function alleles achieve therapeutic INR quickly with current dosing algorithms, and dose reduction may be necessary after reaching therapeutic INR to prevent over-anticoagulation. We propose a novel warfarin dosing nomogram that may facilitate more efficient attainment of therapeutic anticoagulation across genotype groups in most patient populations observed in the U.S.
Methods
Study population and procedures
Adult patients newly started on warfarin and receiving genotype-guided dosing by the Personalized Medicine Program (PMP) as part of their clinical care at the UI Health were enrolled. Patients with a history of warfarin use in the previous 6 months or history of liver transplant were excluded. Only patients who provided written informed consent with authorization for medical record review were included in the current analyses, and in order to avoid the confounding effects of differing INR goals, only patients with an INR goal of 2–3 were included. The study protocol was approved by the University of Illinois at Chicago Institutional Review Board.
The process for providing genotype-guided dosing has been previously described.(27) Briefly, an initial dose recommendation, calculated using a published clinical dosing algorithm,(24) was automatically provided to the ordering physician via an alert in the electronic health record at the time of the initial warfarin order. In cases where deemed appropriate, a clinical pharmacist followed up with the ordering physician to recommend an initial loading dose.
Genotyping was performed on an eSensor® XT-8 platform (Genmark Diagnostics Inc, Carlsbad, CA) within the UI Health Molecular Pathology Laboratory, a College of American Pathologists (CAP)-accredited/Clinical Laboratory Improvement Amendments (CLIA)-licensed clinical laboratory. This platform tested for the following alleles: VKORC1 c.-1639G>A (rs9923231); CYP2C9*2 (p.R144C, rs1799853), *3 (p.I359L, rs1057910), *5 (p.D360E, rs28371686), *6 (c.818delA, rs9332131), *11 (p.R335W, rs28371685), *14 (p.R125H, rs72558189), *15 (p.S162X, rs72558190), and *16 (p.T299A, rs72558192); and CYP4F2 p.V433M (rs2108622). Genotype results were targeted to be available in time to inform the second warfarin dose. A pharmacist within the PMP provided daily dose recommendations, which were calculated using published pharmacogenetic algorithms, via a consult note in the electronic health record. (24–26) The algorithm by Gage et al. (24, 26) (available through www.warfarindosing.org) was used except for patients on CYP2C9 enzyme inducers (e.g. phenytoin), in which case the algorithm from the International Warfarin Pharmacogenetics Consortium (25) (IWPC, also available through www.warfarindosing.org) was used. The algorithm available through www.warfarindosoing.org allows for daily refinement of warfarin dosing based on INR response to previous doses. Additional adjustment to the algorithm-calculated dose was made for patients with a CYP2C9*11 or *14 allele (30% reduction; no one had the CYP2C9*15 or *16 genotype), renal dysfunction (10% to 20% reduction for an estimated glomerular filtration rate of 30–60 ml/min or <30 ml/min, respectively), or taking medications known to interact with warfarin that were not included in the algorithm (e.g. metronidazole).(40, 41) In cases where the patient did not receive an initial loading dose, the PMP recommended a dose that 20–50% higher on day 2 where deemed appropriate. The majority of patients were referred to the UI Health Antithrombosis Clinic after discharge.
Data collection and statistical analysis
Patients were followed prospectively until hospital discharge and up to 450 days after warfarin initiation for those followed in the UI Health Antithrombosis Clinic. All clinical analyses were based on comparison among the following genetic subgroups: 0, 1, or ≥2 reduced-function VKORC1 (i.e. -1639A) and/or CYP2C9 (i.e. *2, *3, *5, *6, *11, *14) alleles. CYP4F2 was not included in our variant allele groupings because it was not utilized to inform warfarin dosing during the initial year of the program and its effects are minimal compared to the VKORC1 or CYP2C9 alleles.(7, 42, 43). Furthermore, the variant CYP4F2 433Met genotype is associated with warfarin resistance rather than sensitivity and is uncommon in African Americans, who comprised the largest population at UI Health. The primary outcome of interest was time to achieve an INR in therapeutic range (i.e. 2–3) within 28 days, calculated as the number of days between the first warfarin dose and first INR in range. Additional outcomes were daily warfarin dose during hospitalization, rate of INR increase, incidence of patients with an INR >4, and time in therapeutic range. Consistent with previous reports (33, 44), data for the primary and secondary outcomes were collected up to 28 days.
The χ2 test of independence was used to assess differences among the 3 genetic subgroups (i.e. 0, 1, or ≥2 reduced-function alleles) for categorical variables and analysis of variance (ANOVA) was used for continuous variables. Multivariable linear regression was used to determine the effect of genetic subgroup on the (log-transformed) time to first therapeutic INR within 28 days. Covariates included in the regression model were race and inpatient status at the time of first therapeutic INR. Race was included because it differed significantly among genetic subgroups, while inpatient status at the time of first therapeutic INR was used as a time-varying covariate because our hospitalized patients achieved first therapeutic INR more quickly on average than our outpatients.
Time-to-event analysis to evaluate the differences in time to first therapeutic INR stratified by genetic subgroups was performed, with an event defined as the first INR in therapeutic range of 2–3. A Kaplan-Meier plot was generated, and a Wilcoxon test of equality over strata was performed to determine whether the probability of reaching a therapeutic INR was different among genetic subgroups. Furthermore, piecewise Cox proportional hazards regression was performed, adjusting for the same covariates used in the multivariable regression model. Based on the Kaplan-Meier plot, the overall time to therapeutic INR was divided into 2 intervals of warfarin therapy, days 0–10 and days 11–28. All enrolled subjects were included in the time-to-event analysis; however, only a portion of them reached therapeutic INR. The remainder of subjects contributed all available information to the model until the censored event occurred (i.e., loss to follow-up or lack of the event occurrence in the first 28 days).
For every patient, daily warfarin dose was calculated by adding all warfarin doses the patient received while hospitalized, and dividing the sum by the number of days that he/she received a dose. Mean daily warfarin doses during hospitalization were compared among genetic subgroups by one-way ANOVA. To determine the rate of INR increase for each patient in the first 28 days, we utilized all INRs assessed up to the first INR in range. The value was calculated as a difference between first therapeutic and baseline INR divided by the number of days between. The log-transformed rate of INR increase was compared among genetic subgroups using multivariable linear regression, controlling for race and inpatient status. In order to compare rate of INR increase with time to first therapeutic INR within 28 days, the Spearman correlation test was used. To assess the incidence of patients with an INR >4 in the first 28 days, we compared the number of patients with INR values >4 in each genetic subgroup by using the χ2 or Fisher’s exact test, as appropriate. The percentage of time above, below and within therapeutic INR range (i.e. 2–3) for each patient were calculated in R (version 3.2.1) using the Rosendaal method, which assumes a linear increase or decrease between two consecutive INR measurements.(45) The average percentage of time in therapeutic range over 28 days after therapy initiation for all patients was then plotted using the ggplot2 package in R. Based on this plot, the decision was made to compare the percentage of time above therapeutic range for the later phase of warfarin therapy (days 11–28) in patients with ≥1 reduced-function alleles to that in patients without reduced-function alleles using the Welch two sample t-test. To compare the percentage of time within and below therapeutic range among genetic subgroups, the Wald test was performed using the Imtest package in R. All other statistical analyses were performed with SAS version 9.4 (SAS Institute, Cary, NC).
Development of warfarin initiation nomogram
A population kinetic/pharmacodynamic (K/PD) model was developed to characterize the warfarin dose/response relationship in our ethnically diverse patients, based on Hamberg et al., (36) as shown in the Supplementary Material. For this model, data were used from patients followed prospectively during hospitalization and up to 450 days after warfarin initiation. The K/PD model was then used in clinical trial simulations including virtual individuals (n=54), each with different combinations of VKORC1 (GG, GA, AA) and CYP2C9 (*1/*1, *1/*2, *1/*3, *2/*2, *2/*3, *3/*3) genotypes and age (50, 70, 90), in order to develop a warfarin initiation nomogram to reach therapeutic INR range (i.e. 2–3) across genotypes and race/ethnicities (African Americans, Hispanics, Caucasians, etc.). Parameter estimates trained with our own dataset or from Hamberg et al. were used to simulate dose/response behavior in a diverse or European population, respectively. The loading and maintenance doses derived from our nomogram were optimized to attenuate differences among genotype groups based on the performance of simulated INR profiles in typical individuals in the first 22 days after therapy initiation. Based on the relative difference in clearances,(37) we recommended a 30% dose reduction in our nomogram for patients with CYP2C9 *1/*8 or *8/*8.
Supplementary Material
Study Highlights.
What is the current knowledge on the topic?
Genotype significantly affects warfarin dose requirements, time to achieve therapeutic anticoagulation, and risk for supra-therapeutic anticoagulation and major bleeding.
What question did this study address?
Among our diverse patient population, how effective is genotype-guided warfarin dosing with use of recommended pharmacogenetic dosing algorithms and can we improve upon this dosing strategy?
What this study adds to our knowledge
Our data suggest that more aggressive dosing than recommended by current pharmacogenetic dosing algorithms is needed for patients with 0 to 1 reduced-function VKORC1 or CYP2C9 alleles, which encompasses most African American and Caucasian patients, while more cautious dosing may be necessary to avoid over-anticoagulation in multiple variant allele carriers. Our novel dosing nomogram, which provides genotype-specific loading dose recommendations, may enable more effective attainment of therapeutic anticoagulation among genotype groups within the diverse populations found in the U.S.
How this might change clinical pharmacology or translational science
Precision dosing of warfarin has the potential to aid patients in obtaining therapeutic anticoagulation more safely and efficiently, ultimately translating into improved patient outcomes.
Acknowledgments
The authors would like to thank Yee Ming Lee, Pharm.D., Supatat Chumnumwat, Pharm.D., Alison Quinn, Pharm.D., Adam Bress, Pharm.D., and James Stevenson, Pharm.D. for their contributions to the PMP with warfarin consults, consenting patients, and data collection. We would also like to thank Dan Gratie, Pharm.D. candidate for his assistance with data collection. The PMP is funded by the University of Illinois Hospital & Health Sciences System Office of the Vice President for Health Affairs. J.D.D. is supported by NIH/NIGMS award K23GM112014. E.A.N. is supported by NIH/NHLBI award K23HL112908. The content is solely the responsibility of the authors and does not necessarily represent the official views of the NIH.
Footnotes
Conflict of Interest/Disclosure
None
Author Contributions
L.H.C., M.J.A., J.D., and K.D. wrote the manuscript; L.H.C., M.J.A., J.D., K.D., O.P., and S.S. designed the research; L.H.C., M.J.A., J.D., K.D., and E.A.N. performed the research; L.H.C., M.J.A., J.D., K.D., and J.D.D. analyzed the data.
References
- 1.Barnes GD, Lucas E, Alexander GC, Goldberger ZD. National Trends in Ambulatory Oral Anticoagulant Use. The American journal of medicine. 2015 doi: 10.1016/j.amjmed.2015.05.044. Epub ahead of print. [DOI] [PMC free article] [PubMed] [Google Scholar]
- 2.Desai NR, et al. Patterns of Initiation of Oral Anticoagulants in Patients with Atrial Fibrillation – Quality and Cost Implications. Am J Med. 2014 doi: 10.1016/j.amjmed.2014.05.013. [DOI] [PubMed] [Google Scholar]
- 3.Guyatt GH, et al. Executive summary: Antithrombotic Therapy and Prevention of Thrombosis, 9th ed: American College of Chest Physicians Evidence-Based Clinical Practice Guidelines. Chest. 2012;141(2 Suppl):7S–47S. doi: 10.1378/chest.1412S3. [DOI] [PMC free article] [PubMed] [Google Scholar]
- 4.Steinberg BA, et al. Early adoption of dabigatran and its dosing in US patients with atrial fibrillation: results from the outcomes registry for better informed treatment of atrial fibrillation. J Am Heart Assoc. 2013;2(6):e000535. doi: 10.1161/JAHA.113.000535. [DOI] [PMC free article] [PubMed] [Google Scholar]
- 5.Weitz JI, Eikelboom JW. Urgent Need to Measure Effects of Direct Oral Anticoagulants. Circulation. 2016;134(3):186–8. doi: 10.1161/CIRCULATIONAHA.116.022307. [DOI] [PubMed] [Google Scholar]
- 6.Gong IY, et al. Clinical and genetic determinants of warfarin pharmacokinetics and pharmacodynamics during treatment initiation. PLoS One. 2011;6(11):e27808. doi: 10.1371/journal.pone.0027808. [DOI] [PMC free article] [PubMed] [Google Scholar]
- 7.Voora D, et al. A polymorphism in the VKORC1 regulator calumenin predicts higher warfarin dose requirements in African Americans. Clin Pharmacol Ther. 2010;87(4):445–51. doi: 10.1038/clpt.2009.291. [DOI] [PMC free article] [PubMed] [Google Scholar]
- 8.Carlquist JF, et al. Genotypes of the cytochrome p450 isoform, CYP2C9, and the vitamin K epoxide reductase complex subunit 1 conjointly determine stable warfarin dose: a prospective study. J Thromb Thrombolysis. 2006;22(3):191–7. doi: 10.1007/s11239-006-9030-7. [DOI] [PubMed] [Google Scholar]
- 9.White RH. The epidemiology of venous thromboembolism. Circulation. 2003;107(23 Suppl 1):I4–8. doi: 10.1161/01.CIR.0000078468.11849.66. [DOI] [PubMed] [Google Scholar]
- 10.Chitsike RS, et al. Risk of post-thrombotic syndrome after subtherapeutic warfarin anticoagulation for a first unprovoked deep vein thrombosis: results from the REVERSE study. J Thromb Haemost. 2012;10(10):2039–44. doi: 10.1111/j.1538-7836.2012.04872.x. [DOI] [PubMed] [Google Scholar]
- 11.Garcia DA, Lopes RD, Hylek EM. New-onset atrial fibrillation and warfarin initiation: high risk periods and implications for new antithrombotic drugs. Thromb Haemost. 2010;104(6):1099–105. doi: 10.1160/TH10-07-0491. [DOI] [PubMed] [Google Scholar]
- 12.Hylek EM, Skates SJ, Sheehan MA, Singer DE. An analysis of the lowest effective intensity of prophylactic anticoagulation for patients with nonrheumatic atrial fibrillation. N Engl J Med. 1996;335(8):540–6. doi: 10.1056/NEJM199608223350802. [DOI] [PubMed] [Google Scholar]
- 13.Hylek EM, et al. Effect of intensity of oral anticoagulation on stroke severity and mortality in atrial fibrillation. N Engl J Med. 2003;349(11):1019–26. doi: 10.1056/NEJMoa022913. [DOI] [PubMed] [Google Scholar]
- 14.Landefeld CS, Goldman L. Major bleeding in outpatients treated with warfarin: incidence and prediction by factors known at the start of outpatient therapy. Am J Med. 1989;87(2):144–52. doi: 10.1016/s0002-9343(89)80689-8. [DOI] [PubMed] [Google Scholar]
- 15.Pirmohamed M, et al. A randomized trial of genotype-guided dosing of warfarin. N Engl J Med. 2013;369(24):2294–303. doi: 10.1056/NEJMoa1311386. [DOI] [PubMed] [Google Scholar]
- 16.Anderson JL, et al. A randomized and clinical effectiveness trial comparing two pharmacogenetic algorithms and standard care for individualizing warfarin dosing (CoumaGen-II) Circulation. 2012;125(16):1997–2005. doi: 10.1161/CIRCULATIONAHA.111.070920. [DOI] [PubMed] [Google Scholar]
- 17.Schwarz UI, et al. Genetic determinants of response to warfarin during initial anticoagulation. N Engl J Med. 2008;358(10):999–1008. doi: 10.1056/NEJMoa0708078. [DOI] [PMC free article] [PubMed] [Google Scholar]
- 18.Mega JL, et al. Genetics and the clinical response to warfarin and edoxaban: findings from the randomised, double-blind ENGAGE AF-TIMI 48 trial. Lancet. 2015;385(9984):2280–7. doi: 10.1016/S0140-6736(14)61994-2. [DOI] [PubMed] [Google Scholar]
- 19.Limdi NA, Wiener H, Goldstein JA, Acton RT, Beasley TM. Influence of CYP2C9 and VKORC1 on warfarin response during initiation of therapy. Blood Cells Mol Dis. 2009;43(1):119–28. doi: 10.1016/j.bcmd.2009.01.019. [DOI] [PMC free article] [PubMed] [Google Scholar]
- 20.Redman AR, Dickmann LJ, Kidd RS, Goldstein JA, Ritchie DM, Hon YY. CYP2C9 genetic polymorphisms and warfarin. Clin Appl Thromb Hemost. 2004;10(2):149–54. doi: 10.1177/107602960401000205. [DOI] [PubMed] [Google Scholar]
- 21.Martis S, Peter I, Hulot JS, Kornreich R, Desnick RJ, Scott SA. Multi-ethnic distribution of clinically relevant CYP2C genotypes and haplotypes. Pharmacogenomics J. 2013;13(4):369–77. doi: 10.1038/tpj.2012.10. [DOI] [PMC free article] [PubMed] [Google Scholar]
- 22.Lee YM, Eggen J, Soni V, Drozda K, Nutescu EA, Cavallari LH. Warfarin dose requirements in a patient with the CYP2C9*14 allele. Pharmacogenomics. 2014;15(7):909–14. doi: 10.2217/pgs.14.47. [DOI] [PMC free article] [PubMed] [Google Scholar]
- 23.Johnson JA, et al. Clinical Pharmacogenetics Implementation Consortium Guidelines for CYP2C9 and VKORC1 genotypes and warfarin dosing. Clin Pharmacol Ther. 2011;90(4):625–9. doi: 10.1038/clpt.2011.185. [DOI] [PMC free article] [PubMed] [Google Scholar]
- 24.Gage BF, et al. Use of pharmacogenetic and clinical factors to predict the therapeutic dose of warfarin. Clin Pharmacol Ther. 2008;84(3):326–31. doi: 10.1038/clpt.2008.10. [DOI] [PMC free article] [PubMed] [Google Scholar]
- 25.International Warfarin Pharmacogenetics C et al. Estimation of the warfarin dose with clinical and pharmacogenetic data. N Engl J Med. 2009;360(8):753–64. doi: 10.1056/NEJMoa0809329. [DOI] [PMC free article] [PubMed] [Google Scholar]
- 26.Lenzini P, et al. Integration of genetic, clinical, and INR data to refine warfarin dosing. Clin Pharmacol Ther. 2010;87(5):572–8. doi: 10.1038/clpt.2010.13. [DOI] [PMC free article] [PubMed] [Google Scholar]
- 27.Nutescu EA, et al. Feasibility of implementing a comprehensive warfarin pharmacogenetics service. Pharmacotherapy. 2013;33(11):1156–64. doi: 10.1002/phar.1329. [DOI] [PMC free article] [PubMed] [Google Scholar]
- 28.Cavallari LH, Perera MA. The future of warfarin pharmacogenetics in under-represented minority groups. Future cardiology. 2012;8(4):563–76. doi: 10.2217/fca.12.31. [DOI] [PMC free article] [PubMed] [Google Scholar]
- 29.COUMADIN (Warfarin Sodium) package insert [Internet] Bristol-Myers Squibb; [cited 2016 Jun 15]. Available from: http://www.accessdata.fda.gov/drugsatfda_docs/label/2010/009218s108lbl.pdf. [Google Scholar]
- 30.Hylek EM, Singer DE. Risk factors for intracranial hemorrhage in outpatients taking warfarin. Annals of internal medicine. 1994;120(11):897–902. doi: 10.7326/0003-4819-120-11-199406010-00001. [DOI] [PubMed] [Google Scholar]
- 31.Schelleman H, et al. Dosing algorithms to predict warfarin maintenance dose in Caucasians and African Americans. Clin Pharmacol Ther. 2008;84(3):332–9. doi: 10.1038/clpt.2008.101. [DOI] [PMC free article] [PubMed] [Google Scholar]
- 32.Limdi NA, et al. Warfarin pharmacogenetics: a single VKORC1 polymorphism is predictive of dose across 3 racial groups. Blood. 2010;115(18):3827–34. doi: 10.1182/blood-2009-12-255992. [DOI] [PMC free article] [PubMed] [Google Scholar]
- 33.Kimmel SE, et al. A pharmacogenetic versus a clinical algorithm for warfarin dosing. N Engl J Med. 2013;369(24):2283–93. doi: 10.1056/NEJMoa1310669. [DOI] [PMC free article] [PubMed] [Google Scholar]
- 34.Wright DF, Winter HR, Duffull SB. Understanding the time course of pharmacological effect: a PKPD approach. British journal of clinical pharmacology. 2011;71(6):815–23. doi: 10.1111/j.1365-2125.2011.03925.x. [DOI] [PMC free article] [PubMed] [Google Scholar]
- 35.Perera MA, et al. Genetic variants associated with warfarin dose in African-American individuals: a genome-wide association study. Lancet. 2013;382(9894):790–6. doi: 10.1016/S0140-6736(13)60681-9. [DOI] [PMC free article] [PubMed] [Google Scholar]
- 36.Hamberg AK, et al. A pharmacometric model describing the relationship between warfarin dose and INR response with respect to variations in CYP2C9, VKORC1, and age. Clinical pharmacology and therapeutics. 2010;87(6):727–34. doi: 10.1038/clpt.2010.37. [DOI] [PubMed] [Google Scholar]
- 37.Liu Y, et al. Decreased warfarin clearance associated with the CYP2C9 R150H (*8) polymorphism. Clin Pharmacol Ther. 2012;91(4):660–5. doi: 10.1038/clpt.2011.269. [DOI] [PMC free article] [PubMed] [Google Scholar]
- 38.Dickmann LJ, et al. Identification and functional characterization of a new CYP2C9 variant (CYP2C9*5) expressed among African Americans. Mol Pharmacol. 2001;60(2):382–7. doi: 10.1124/mol.60.2.382. [DOI] [PubMed] [Google Scholar]
- 39.Niinuma Y, et al. Functional characterization of 32 CYP2C9 allelic variants. Pharmacogenomics J. 2014;14(2):107–14. doi: 10.1038/tpj.2013.22. [DOI] [PubMed] [Google Scholar]
- 40.Tai G, et al. In-vitro and in-vivo effects of the CYP2C9*11 polymorphism on warfarin metabolism and dose. Pharmacogenet Genomics. 2005;15(7):475–81. doi: 10.1097/01.fpc.0000162005.80857.98. [DOI] [PubMed] [Google Scholar]
- 41.Limdi NA, et al. Warfarin dosing in patients with impaired kidney function. Am J Kidney Dis. 2010;56(5):823–31. doi: 10.1053/j.ajkd.2010.05.023. [DOI] [PMC free article] [PubMed] [Google Scholar]
- 42.Cha PC, et al. Genome-wide association study identifies genetic determinants of warfarin responsiveness for Japanese. Hum Mol Genet. 2010;19(23):4735–44. doi: 10.1093/hmg/ddq389. [DOI] [PubMed] [Google Scholar]
- 43.Teichert M, et al. A genome-wide association study of acenocoumarol maintenance dosage. Hum Mol Genet. 2009;18(19):3758–68. doi: 10.1093/hmg/ddp309. [DOI] [PubMed] [Google Scholar]
- 44.Hillman MA, et al. A prospective, randomized pilot trial of model-based warfarin dose initiation using CYP2C9 genotype and clinical data. Clinical medicine & research. 2005;3(3):137–45. doi: 10.3121/cmr.3.3.137. [DOI] [PMC free article] [PubMed] [Google Scholar]
- 45.Rosendaal FR, Cannegieter SC, van der Meer FJ, Briet E. A method to determine the optimal intensity of oral anticoagulant therapy. Thromb Haemost. 1993;69(3):236–9. [PubMed] [Google Scholar]
Associated Data
This section collects any data citations, data availability statements, or supplementary materials included in this article.