Abstract
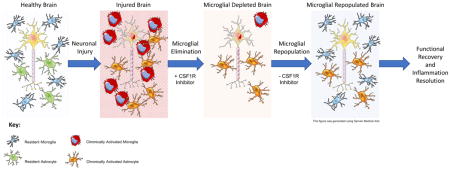
Microglia mediate chronic neuroinflammation following central nervous system (CNS) disease or injury, and in doing so, damage the local brain environment by impairing recovery and contributing to disease processes. Microglia are critically dependent on signaling through the colony-stimulating factor 1 receptor (CSF1R) and can be eliminated via administration of CSF1R inhibitors. Resolving chronic neuroinflammation represents a universal goal for CNS disorders, but long-term microglial elimination may not be amenable to clinical use. Notably, withdrawal of CSF1R inhibitors stimulates new microglia to fully repopulate the CNS, affording an opportunity to renew this cellular compartment. To that end, we have explored the effects of acute microglial elimination, followed by microglial repopulation, in a mouse model of extensive neuronal loss. Neuronal loss leads to a prolonged neuroinflammatory response, characterized by the presence of swollen microglia expressing CD68 and CD45, as well as elevated levels of cytokines, chemokines, complement, and other inflammatory signals. These collective responses are largely resolved by microglial repopulation. Furthermore, microglial repopulation promotes functional recovery in mice, with elevated plus maze performance matching that of uninjured mice, despite the loss of 80% of hippocampal neurons. Analyses of synaptic surrogates revealed increases in PSD95 and synaptophysin puncta with microglial repopulation, suggesting that these cells sculpt and regulate the synaptic landscape. Thus, our results show that short-term microglial elimination followed by repopulation may represent a clinically feasible and novel approach to resolve neuroinflammatory events and promote brain recovery.
Keywords: colony-stimulating factor 1 receptor, neuronal loss, glia, neuroinflammation, dendritic spines
Graphical abstract
INTRODUCTION
Microglia are the primary immune cell of the central nervous system (CNS) and respond to insults involving cellular harm and death. Microglia express numerous receptors, allowing them to detect a wide range of cell distress and death signals, become activated, and subsequently migrate to the site of insult (Nimmerjahn et al. 2005). There, microglia secrete a plethora of inflammatory signaling molecules, ultimately supporting neuronal health and clearing dead or dying neurons. We have recently determined that the absence of microglia during an insult can exacerbate neuronal loss (Rice et al. 2015). Despite the protective roles that microglia play in the brain, they are negatively implicated in many CNS disorders and injuries (Clark et al. 2016; Colton and Wilcock 2010). During normal inflammatory responses to pathogens or dead cells, microglia undergo a phenotypic shift in order to respond appropriately to the event, then subsequently revert to a surveillant state, at which point the inflammatory response is effectively resolved. However, after severe insults such as traumatic brain injury (TBI) and stroke, as well as during neurodegenerative disease, microglia fail to return to a surveillant state and instead, remain activated. In both primates and rodents, acute neuronal injuries can produce chronic neuroinflammatory responses lasting a year or more, thereby harming the local brain environment (Loane et al. 2014; Nagamoto-Combs et al. 2007; Smith et al. 1997). In humans, chronic neuroinflammation has been observed up to 17 years after traumatic brain injury (Ramlackhansingh et al. 2011), and for decades after repetitive head injuries in American football athletes, correlating with dementia and chronic traumatic encephalopathy (Cherry et al. 2016). Consequently, finding ways to manipulate and resolve microglial responses is a high priority.
We have determined that microglia in both the healthy (Dagher et al. 2015; Elmore et al. 2014) and injured brain (Rice et al. 2015; Spangenberg et al. 2016) are dependent upon signaling through the colony-stimulating factor 1 receptor (CSF1R) for their survival. Small-molecule inhibitors of the CSF1R that cross the blood brain barrier (BBB) rapidly eliminate microglia within days (Acharya et al. 2016; Elmore et al. 2014). Microglia remain eliminated for the duration of treatment, be it days, weeks, or months (Elmore et al. 2014). As chronic microglial responses are negatively implicated in neurodegenerative diseases and severe brain injuries, inhibition of the CSF1R may offer therapeutic promise (Rice et al. 2015; Spangenberg et al. 2016). However, because microglia are the primary immune cell of the CNS, it is unlikely that indefinite elimination of microglia from humans will be clinically feasible.
Crucially, we find that withdrawal of CSF1R inhibitors from microglia-depleted mice results in the rapid repopulation of the entire CNS with new cells within 14 days. Repopulation occurs both from the proliferation of surviving microglia and from progenitors that differentiate into microglia (Bruttger et al. 2015; Elmore et al. 2014). Here, we set out to determine if we could eliminate and then fully repopulate microglia following extensive neuronal injury, and if such a strategy could represent a translatable opportunity to resolve chronic neuroinflammation and promote brain recovery.
MATERIALS AND METHODS
Compounds
PLX5622 was provided by Plexxikon Inc. (Berkeley, CA) and formulated in standard chow by Research Diets Inc. at 1200 ppm. Doxycycline was provided in standard chow by Research Diets Inc. at 2000 mg/kg, or by researchers in deionized drinking water at 2 mg/ml (Sigma-Aldrich, St. Louis, MO) with 5% sucrose.
Animal Treatments
All rodent experiments were performed in accordance with animal protocols approved by the Institutional Animal Care and Use Committee at the University of California, Irvine. The CaM/Tet-DTA mouse model of inducible neuronal loss was employed for functional studies, and has been previously described (Yamasaki et al. 2007), and was crossed with the Thy1-GFP-M mouse to enable visualization of neuronal structures (Feng et al. 2000), as previously shown (Castello et al. 2014; Rice et al. 2015). 5–8 month-old male and female mice were maintained since birth on doxycycline chow (n= 5–8 M/group; 4–7 F/group). Upon induction of the 30-day lesion period, doxycycline chow was replaced with standard chow. To cease expression of DTA, doxycycline was provided in drinking water, and after seven days, control or PLX5622 chow was provided for 14 days. Finally, PLX5622 treatment was withdrawn for 21 days, allowing microglia to fully repopulate. Behavioral tasks were performed during the final week of the study. At the conclusion of experiments, mice were sacrificed via lethal IP injection of Euthasol (Virbac AH, Fort Worth, TX) and perfused transcardially with 1X phosphate-buffered saline (PBS). Brains were extracted and dissected down the midline, with one half flash-frozen on dry ice for subsequent RNA and protein analyses, and the other half drop-fixed in 4% paraformaldehyde (PFA) in 1X PBS. Fixed brains were cryopreserved in a 30% sucrose solution, frozen, and sectioned at 40 μm on a Leica SM2000 R sliding microtome for subsequent immunohistochemical analyses.
Confocal microscopy
Fluorescent immunolabeling followed a standard indirect technique (primary antibody followed by fluorescent secondary antibody), as previously described (Elmore et al. 2014). Primary antibodies used include NeuN (1:1000; Abcam, Cambridge, MA), IBA1 (1:1000; Wako, Richmond, VA), GFAP (1:10,000; Abcam), S100b (1:1000, Abcam), CD45 (1:1000, AbD Serotec, Raleigh, NC) CD68 (1:2000, AbD Serotec), synaptophysin (1:500; Sigma Aldrich), and PSD95 (1:1000; Cell Signaling, Danvers, MA). Numbers, size, and signal intensity of microglia, astrocytes, PSD95 puncta, and synaptophysin puncta were determined using the spots module in Bitplane Imaris 7.5 software. Synaptic puncta quantifications were obtained from high-resolution z-stack images, from equivocal brain regions.
Behavioral testing
Mouse behavior was evaluated on elevated plus maze, accelerating rotarod (Elmore et al. 2014), and Morris water maze (Baglietto-Vargas et al. 2013), in the order as presented, and as previously described.
RNA Extraction and Analysis
RNA was extracted and purified from microdissected hippocampi of frozen half brains using Qiagen RNEasy Mini Kit (Hilden, Germany). Total RNA was diluted to 20 ng/μl with nuclease-free water and protocols were carried out per manufacturer instructions. 182 inflammation-, Alzheimer’s disease-, plasticity-, and aging-related genes were selected for analysis and probes were designed and synthesized by NanoString nCounter™ technologies (Nanostring, Seattle, WA) against mouse genes, according to the manufacturer’s instructions. Fold-change and calculated p-values were imported into Ingenuity Pathway Analyses software suite (Qiagen), and predicted canonical pathways and upstream regulators identified, and z-scores calculated representing extent of predicted activation or inhibition.
Dendritic Spine Analyses
Dendritic spine analysis was performed as previously described (Rice et al. 2015).
Statistics
One-way ANOVA with Bonferroni’s multiple comparisons test was employed using GraphPad Prism (La Jolla, CA) to determine differences with PLX5622 treatment and repopulation timelines (Figure 1). Two-way ANOVAs were employed to analyze differences between all four groups of mice (Repopulation: Control vs. Repopulation; Genotype: Non-lesion vs. Lesion) using GraphPad Prism or Statistical Analysis Systems (SAS) software (SAS Institute Inc., Cary, NY). Morris water maze training over five days, as well as accelerating rotarod training over four trials (Repopulation: Control vs. Repopulation; Genotype: Non-lesion vs. Lesion; Repeated: Trial number), were analyzed by repeated measures Two-way ANOVA using SAS (SAS Institute Inc.). For Nanostring analyses specifically, Tukey-Kramer post-hoc values are reported when p<0.05, regardless of the p value for the interaction as determined via two-way ANOVA. For all other two-way ANOVA analyses, Holm-Sidak post-hoc values are reported when p<0.05, regardless of the p value for the interaction as determined via two-way ANOVA. For dendritic spine analyses, a one-way nonparametric ANOVA adjusted for multiple comparisons was employed and p values were determined using Dunn’s test in SAS. Results are presented as average ± standard error of the mean (SEM). Significance is defined as p<0.05. The following symbols are used to denote significant differences between groups, as obtained by post-hoc analyses: † Control vs. Repopulation; * Control vs. Lesion; ϕ Repopulation vs. Lesion + Repopulation; # Lesion vs. Lesion + Repopulation.
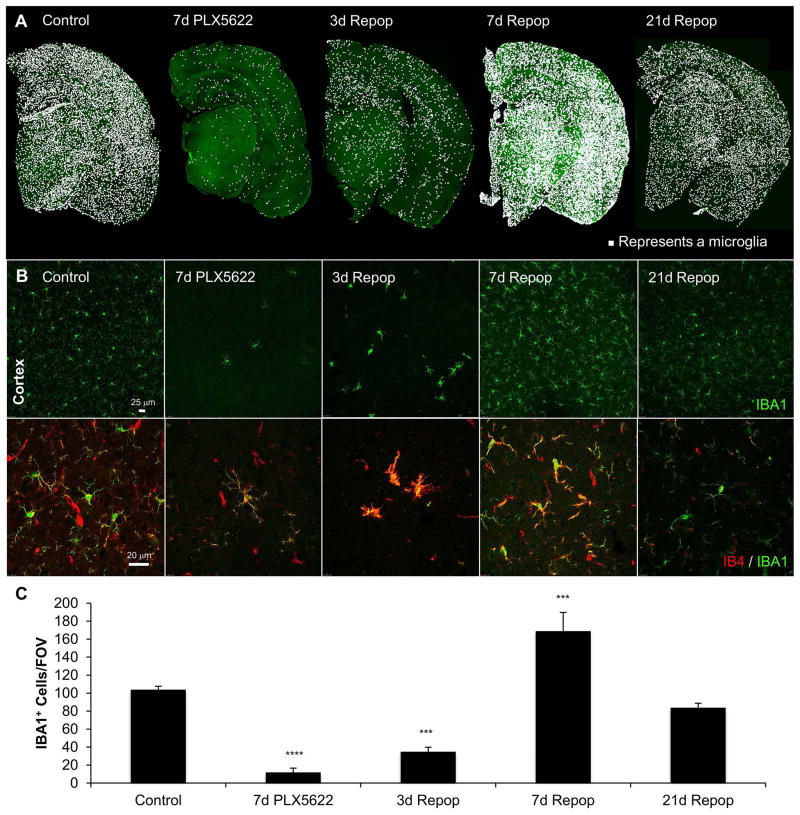
Figure 1. Microglial elimination and repopulation with the specific CSF1R inhibitor PLX5622.
Wild-type mice treated for 7 days with PLX5622 (1200 ppm in chow) and then drug withdrawn and mice sacrificed 3, 7, and 21 days later. A, IBA1 staining in whole half-brain sections with a white dot superimposed over each microglial cell body for each of the conditions. B, Representative images of the cortex shown with IBA1 (top panels) and IBA1 (green)/IB4 (red) in z-stacks (bottom panels). C, Quantification of the number of IBA1+ cells/field of view for each of the conditions showing that 7 days PLX5622 eliminates ~90% of microglia, and that drug withdrawal stimulates rapid repopulation returning brain microglia to control levels within 21 days. Error bars represent SEM, (n=4/group). *p<0.05, **p<0.01, ***p<0.005, ****p<0.0001 versus control.
RESULTS
Microglial repopulation following elimination with PLX5622
We first wanted to establish an appropriate treatment paradigm for microglial elimination and repopulation with the selective CSF1R antagonist PLX5622 (Acharya et al. 2016; Dagher et al. 2015; Klein et al. 2015; Schreiner et al. 2015; Valdearcos et al. 2014), a more brain-penetrant and specific sister molecule of the clinically utilized PLX3397 (Tap et al. 2015). We treated wild-type mice with either control chow or chow with 1200 ppm PLX5622 for seven days. In a subset of microglia-depleted mice, we then withdrew treatment for either three, seven, or 21 days to allow microglia to repopulate (Fig. 1A and B; n=4 males per group). In accordance with our prior data, seven days of treatment eliminated ~90% of microglia throughout the brain (Dagher et al. 2015). Repopulating cells appeared three days following drug withdrawal and displayed enlarged cell bodies and a lack of ramification, consistent with our prior findings (Elmore et al. 2014). By seven days of repopulation, microglia overshot in number to ~160% of that in control mice, with their morphologies intermediate between that of cells seen at three days’ repopulation, and normal ramified microglia (Fig. 1B and C). By 21 days of microglial repopulation, no significant differences existed in number or morphology of microglia between repopulated and control mice. As we previously showed (Elmore et al. 2014), repopulating microglia are highly reactive for the lectin IB4 when they first appear, but are no longer reactive by 21 days (Figure 1B). Thus, seven days of PLX5622 treatment is sufficient to deplete the vast majority of microglia from the brain, while 21 days of repopulation allows microglia to return to normal numbers and morphology.
Microglial elimination and repopulation following neuronal lesion
To make our studies relevant to both injury and disease, we utilized a tetracycline-off inducible transgenic CaM/Tet-DTA mouse, in which diphtheria toxin A chain (DTA) is expressed in forebrain excitatory neurons upon withdrawal of doxycycline from the diet, leading to cellular death (Yamasaki et al. 2007). The hippocampal region, specifically the CA1 subfield, exhibits the strongest lesion in these mice, followed by the cortex. This neuronal loss elicits a strong and prolonged neuroinflammatory response that lasts for months after the neuronal lesion has ended (Rice et al. 2015). We further crossed CaM/Tet-DTA mice to the Thy1-GFP-M mouse line, yielding CaM/Tet-GFP mice, in which neuronal morphologies can be readily visualized (Castello et al. 2014; Feng et al. 2000).
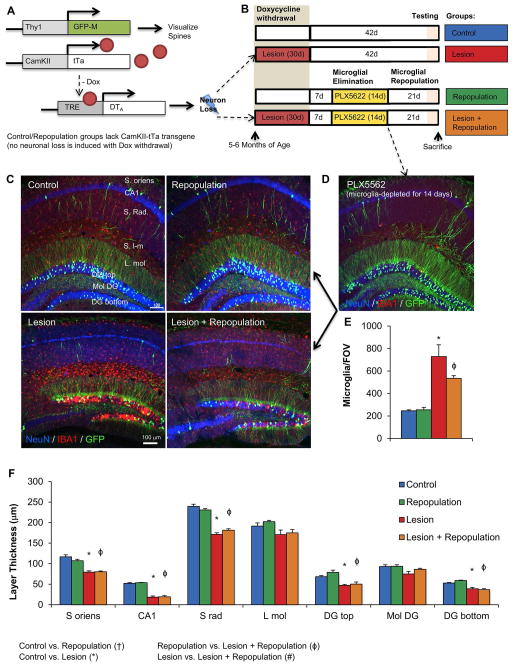
We induced a 30-day neuronal lesion in adult CaM/Tet-GFP mice (control mice do not harbor the CaM transgene, and therefore do not lesion upon doxycycline withdrawal), leading to the loss of 80% of CA1 neurons (Yamasaki et al. 2007). We then re-administered doxycycline to stop further neuronal loss. After waiting seven days for expression of DTA to fully cease, we treated mice for 14 days with control chow or chow formulated with 1200 ppm PLX5622 to eliminate microglia. PLX5622 at this dose eliminates ~90% of all microglia within seven days (Figure 1; (Acharya et al. 2016; Dagher et al. 2015; Schreiner et al. 2015; Valdearcos et al. 2014)). Importantly, chronically activated microglia induced by this neuronal lesion model are eliminated with CSF1R inhibitors to the same extent as in control mice (Rice et al. 2015). Once the microglia were eliminated (Figure 2D), we withdrew PLX5622 treatment to stimulate microglial repopulation throughout the CNS and waited 21 days. This experimental paradigm effectively yields four experimental groups of mice, as seen in Figure 2A–B: 1) non-lesioned mice with resident microglia (Control; n= 5M, 4F); 2) non-lesioned mice with repopulated microglia (Repopulation; n= 5 M, 4F); 2) lesioned mice with resident microglia (Lesion; n= 6M, 4F); and 4) lesioned mice with repopulated microglia (Lesion + Repopulation; n= 6M, 3F).
Figure 2. Neuronal lesioning followed by subsequent microglial repopulation in CaM/Tet-GFP mice.
A, Schematic depicting the mouse transgenes. B, Schematic depicting the treatment paradigm and resulting experimental groups. C, Representative images of hippocampal regions, with IBA1 (red; microglia), NeuN (blue; neuronal nuclei), and GFP (green; GFP transgene in sparse neuronal populations), from Control, Control + Repopulation, Lesion, and Lesion + Repopulation groups. D, Representative image of mice sacrificed after 14 days of treatment with PLX5622, showing microglial depletion. E, Quantification of IBA1+ cell bodies per field of view, showing increased microglial numbers following lesioning. F, Quantification of neuronal layer thickness, via NeuN immunoreactivity. Error bars represent SEM, (n=9–11). Symbols denote significant differences between groups (p<0.05): † Control vs. PLX3397; * Control vs. Lesion; ϕ PLX3397 vs. Lesion + PLX3397; # Lesion vs. Lesion + PLX3397. S. oriens, stratum oriens; CA, cornus ammonis; S. Rad., stratum radiatum; L. mol., molecular layer; DG, dentate gyrus.
Post-mortem analyses of the brains revealed shrunken hippocampi as well as significantly reduced layer thicknesses across most of the hippocampus in both lesioned groups (Figure 2F). Notably, neuronal loss occurred prior to microglial elimination and repopulation, and thus, we would not expect repopulation to affect the extent of neuronal loss. Analysis of microglial numbers via immunostaining for IBA1 showed that lesioning dramatically increases the number of microglia within the brain, even ten weeks after lesion initiation (Figure 2C, E). Microglial repopulation in the non-lesioned mice resulted in microglial numbers precisely that of control levels, while microglial repopulation in the lesioned mice resulted in elevated microglial numbers to the same extent seen with only lesion.
Repopulating microglia appear morphologically naïve
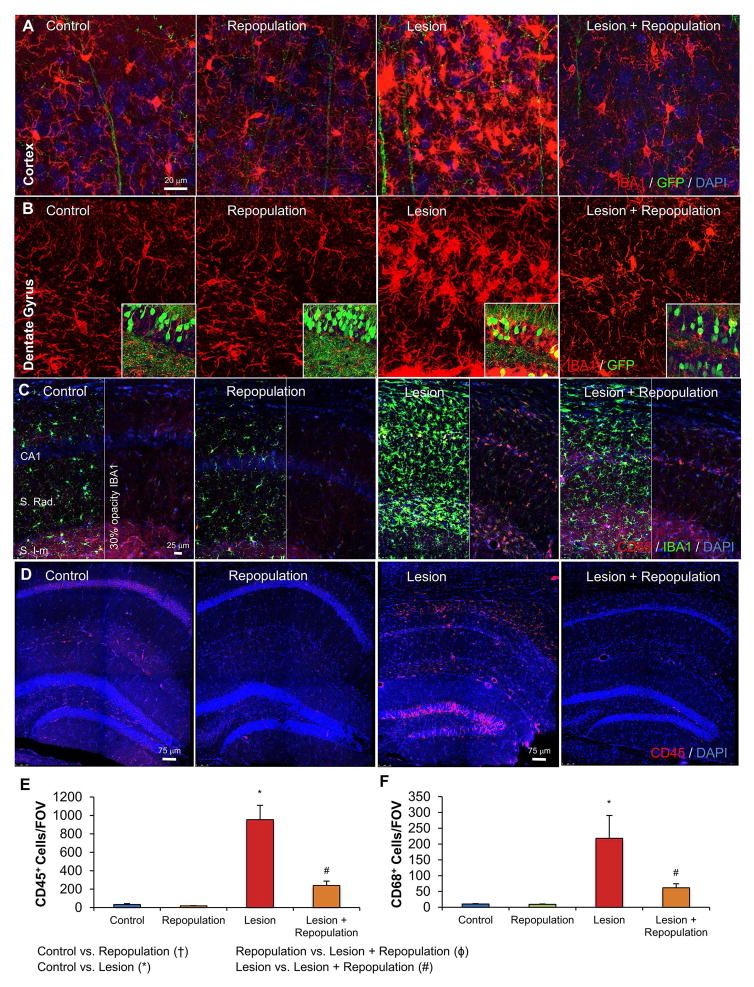
While we did not find a significant difference in the number of microglia between the Lesion and Lesion + Repopulation groups of mice, an obvious difference existed in the morphology of repopulated microglia following lesioning. Indicative of a reactive state, microglia in Lesion mice displayed highly swollen cell bodies, particularly in the dentate gyrus and in the cortex, stained more intensely for IBA1, and possessed short stubby processes. However, microglia in the Lesion + Repopulation mice resembled normal ramified microglia, with smaller somas and long, fine processes (Figure 3A, B). Thus, these findings indicate that microglial repopulation has robust effects on microglial morphologies, appearing to resolve the classically reactive morphological phenotype. In addition, reactive microglia express several inflammatory markers not usually present in surveillant microglia, including CD45 (Masliah et al. 1991) and CD68 (Holness and Simmons 1993; Muhleisen et al. 1995). Immunostaining for CD68 revealed robust microglial expression in Lesion mice, which was significantly attenuated in the Lesion + Repopulation group (Figure 3C and F). Similarly, CD45+ microglia were increased with Lesion, but significantly reduced with Lesion + Repopulation (Figure 3D, E).
Figure 3. Repopulating microglia appear morphologically naïve.
A, Representative images of the cortex with IBA1 (red; microglia), NeuN (blue; neuronal nuclei), and GFP (green; GFP transgene in sparse neuronal populations), from Control, Control + Repopulation, Lesion, and Lesion + Repopulation groups. B, Representative images of the dentate gyrus with IBA1 (red; microglia). Box inserts show same images but with green channel also shown to highlight the neuronal layers. C, Representative images of CD68 labeling (red) and IBA1 labeling (green). Images are split in two with the opacity of the green channels reduced to 30% in the right panels to clearly show the CD68 in the red channel. D, Representative images of CD45 labeling (red) and IBA1 labeling (green), with cell nuclei shown via DAPI (blue). E, Quantification of (C) shows that the number of CD68+ cells is significantly increased in Lesion compared to Control and Lesion + Repopulation groups. F, Quantification of (D) shows that the number of CD45+ cells per field of view increases with Lesion but is resolved with Lesion + Repopulation. Error bars represent SEM, (n=5–6). Symbols denote significant differences between groups (p<0.05): † Control vs. PLX3397; * Control vs. Lesion; ϕ PLX3397 vs. Lesion + PLX3397; # Lesion vs. Lesion + PLX3397.
Lesion-induced astrocytic responses are not affected by microglial repopulation
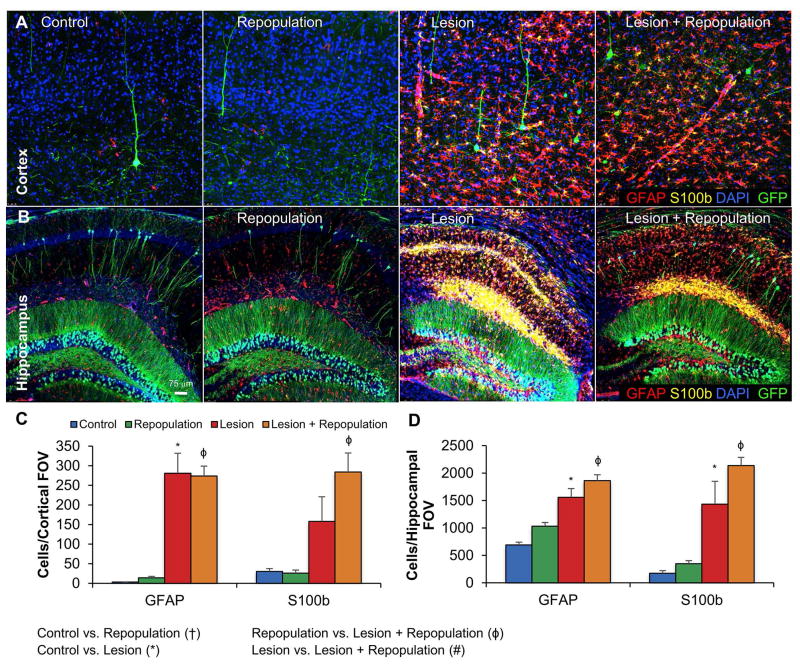
Like microglia, astrocytes are critical to neuronal health and are capable of modulating inflammatory events in the CNS (Min et al. 2006; Saijo et al. 2009). To determine the effects of both lesion and microglial repopulation on astrocyte populations, we probed fixed tissue with antibodies against GFAP and S100β, two canonical markers of astrocytes. The number of GFAP+ and S100β+ astrocytes were greatly increased in the Lesion group, both in the cortex and the hippocampus, and remained similarly increased in the Lesion + Repopulation group (Figure 4).
Figure 4. Lesion-induced astrocytic responses are not affected by microglial repopulation.
Astrocyte numbers and reactivity were assessed in the hippocampus (A) and cortex (B). Representative images shown with GFAP (red; astrocytes), S100b (yellow; astrocytes), GFP (green; GFP transgene in sparse neuronal populations), and DAPI (blue; nuclei), from Control, Control + Repopulation, Lesion, and Lesion + Repopulation groups. C, Quantification of (A). D, Quantification of (B). Error bars represent SEM. (n=7–10/group). Symbols denote significant differences between groups (p<0.05): † Control vs. PLX3397; * Control vs. Lesion; ϕ PLX3397 vs. Lesion + PLX3397; # Lesion vs. Lesion + PLX3397.
Microglial elimination and repopulation increases total spine number
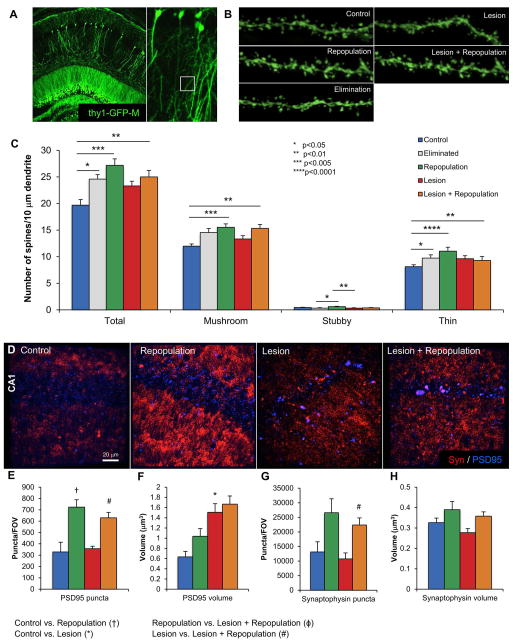
In the design of our experiment, we included the Thy1-GFP-M transgene to explore how microglial repopulation affects the synaptic landscape (Figure 5A, B). Quantification of dendritic spine densities on CA1 non-primary apical neurons revealed a robust increase with just two weeks of microglial elimination; these increases were further sustained in the Repopulation group compared to the Control group (Figure 5C; n=5–7). These increases were seen in mushroom and thin spines, with no effect on stubby spines. Lesioning had no effect on total spine density, but significantly reduced stubby spines; this phenomenon was seen regardless of microglial repopulation status. However, no significant differences were seen between Lesion and Lesion + Repopulation groups. Previously, we found that both lesioning and microglial elimination had dramatic effects on the number and properties of synaptophysin and PSD95 puncta, markers of pre- and post-synaptic areas, respectively (Rice et al. 2015). Quantification of these markers revealed that microglial repopulation significantly increases the number of PSD95 and synaptophysin puncta in both Control and Lesion mice (Figure 5D, E and G). Lesion alone dramatically increased PSD95 puncta size (Figure 5F).
Figure 5. Microglial repopulation results in increased dendritic spine density.
A, Representative image of sparse GFP expressing neurons in the hippocampus as a result of the Thy1-GFP-M transgene. White box illustrates the non-primary apical dendrites from the CA1 neurons that are imaged at high power and quantified. B, Representative images of dendrites from Control, Elimination, Repopulation, Lesion, and Lesion + Repopulation obtained with z-stacks and then deconvoluted. C, Quantification of dendritic spine densities revealing significant increases in Total, Mushroom, and Thin spines with microglial repopulation. Spine numbers are normalized to 10 μm of dendrite length. D, Representative flattened z-stack images of PSD95 and synaptophysin immunoreactivity in the CA1 region display alterations in puncta area and size. Quantification of PSD95 puncta number (E) and volume (F) shows that microglial repopulation increases puncta numbers, while lesion increases puncta volume. Quantification of synaptophysin puncta number (G) and volume (H) shows that microglial repopulation increases puncta numbers, with no significant effects on puncta volume. Error bars indicate SEM, (n=7–10/group). Symbols denote significant differences between groups (p<0.05): † Control vs. PLX3397; * Control vs. Lesion; ϕ PLX3397 vs. Lesion + PLX3397; # Lesion vs. Lesion + PLX3397.
Microglial repopulation rescues behavioral deficits induced by neuronal lesion
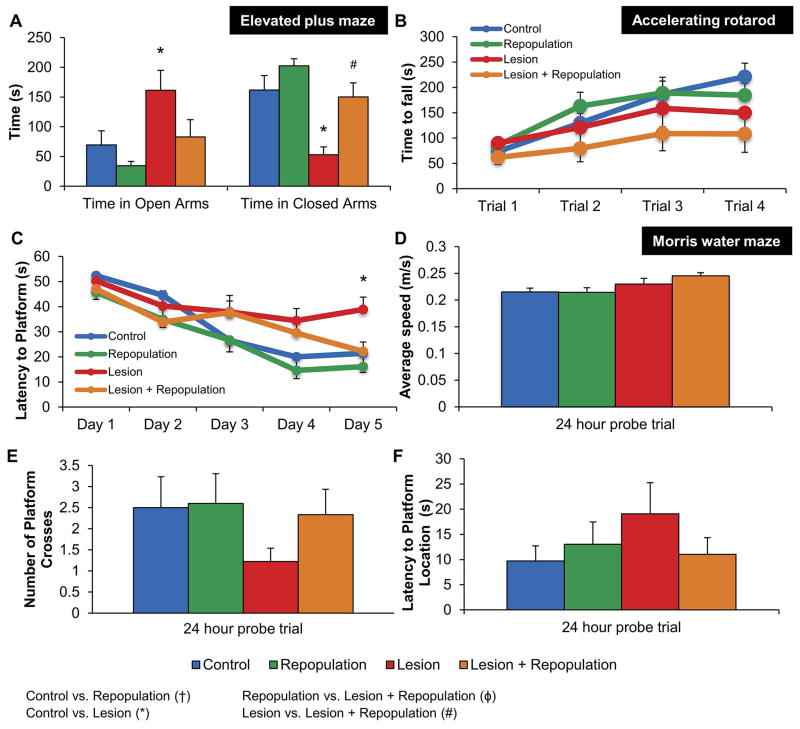
We tested motor and cognitive abilities prior to sacrificing the mice to determine how microglial repopulation affects functional recovery. Mice were first tested on the elevated plus maze, a measure of anxiety-related behaviors. Mice in the Lesion group spent significantly more time in the open arms of the maze, and significantly less time in the closed arms of the maze, compared to mice in the Control group (Figure 6A). The behavioral deficit associated with the closed arms of the maze completely recovered with microglial repopulation, indicating that elimination and subsequent repopulation of the microglia compartment is sufficient to rescue a lesion-induced alteration in this task. Mice were also tested on the Morris water maze, a hippocampal-dependent measure of learning and memory. On the fifth day of training, mice in the Lesion group exhibited significantly increased latencies to find the platform, compared to Control mice (Figure 6C), while mice in the Lesion + Repopulation group performed at a level similar to that of Control mice. No statistically significant differences were found among any of the groups during the probe trial, although a tendency of the Lesion group to perform most poorly was observed in both the latency to platform location and the number of platform crosses (Figure 6E and F), suggesting that low sample size hindered statistical power. Finally, we assessed motor function via swim speed during the Morris water maze and time to fall during accelerating rotarod. Although lesioning had a significant main effect on accelerating rotarod performance (p<0.05), mice in all four groups exhibited similar swim speeds in the water maze (Figures 6B and D).
Figure 6. Microglial repopulation restores lesion-induced deficits on behavioral tasks.
A, Elevated plus maze shows Lesion mice spend significantly more time in open arms and less time in closed arms, but Lesion + Repopulation mice perform identically to controls. B, Accelerating rotarod shows that lesioned mice exhibit significantly shorter times to fall during. C, Morris water maze training shows that Lesion mice take significantly more time to find the platform, compared to Control after 5 days of training. However, Lesion + Repopulation mice perform similar to control groups. D–F, Morris water maze probe trial was performed 24 hours after last training session. D, No significant differences in swim speed exist among groups of mice. E, Lesion group mice trend to have fewer platform crosses than the other groups. F, Lesion group mice trend to have increased latencies to the platform location than the other groups. Error bars represent SEM, (n=9–11). Symbols denote significant differences between groups (p<0.05): † Control vs. PLX3397; * Control vs. Lesion; ϕ PLX3397 vs. Lesion + PLX3397; # Lesion vs. Lesion + PLX3397.
Microglial repopulation dampens lesion-induced inflammation
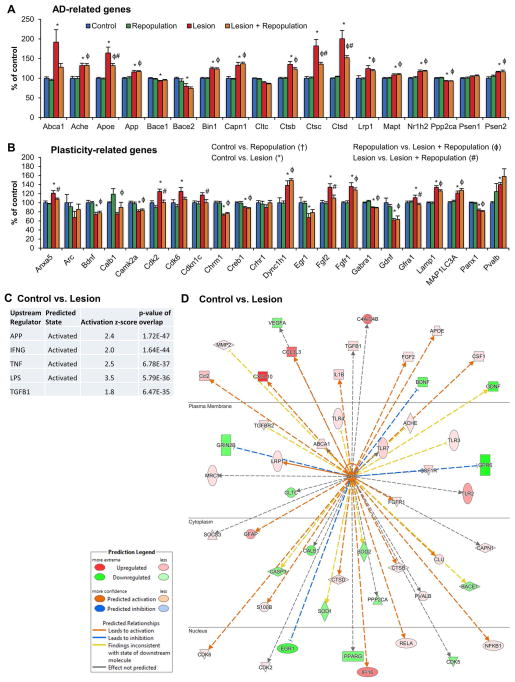
We sought to explore the effects of lesioning and microglial repopulation by measuring levels of mRNA in dissected hippocampal tissue via Nanostring technology. To that end we created a custom gene set encompassing 101 genes related to neurodegeneration, synaptic plasticity, and learning and memory, and a further 81 genes related to neuroinflammation. Of interest, several AD-related genes were upregulated with lesion, including ABCA1, APOE, APP, BIN1, CAPN1, LRP1, MAPT, and PSEN2. These genes encompass pathological proteins implicated in the disease (APP, PSEN2, and MAPT), as well as genetic risk factors (APOE, BIN1, and LRP1; also TREM2 in the inflammatory panel (Figure 7)), and demonstrate how neuronal injury alone upregulates genes implicated in the development of AD (Figure 7A). Of these AD genes, APOE and CTSB, CTSC, and CTSD (Cathepsins B, C, and D) were all significantly increased in Lesion compared to Control, but attenuated in Lesion + Repopulation compared to Lesion (Figure 7A). Of the other genes, ANXA5 (Annexin A5), CDK2 (Cyclin-dependent kinase 2), and CDKN1C (Cyclin-dependent kinase inhibitor 1C) were significantly lowered in Lesion + Repopulation, compared to Lesion alone (Figure 7B). Five neurotransmission-related genes decreased with lesioning, and four increased. Of these, only two lesion-associated increases are rescued by microglial repopulation—FGF2 (fibroblast growth factor 2), which is upregulated by astrocytes with brain lesion (Clarke et al. 2001), and GFRA1, which is a receptor for GDNF (Cik et al. 2000). Pathway analyses of gene expression changes highlighted several predicted upstream regulators, with APP being the most significant, followed by inflammatory molecules, such as IFNG and TNF (Figure 7C). The downstream gene activation states from APP in control and lesioned mice were plotted, and revealed that lesioning upregulated inflammatory signals, but downregulated molecules associated with plasticity and memory (Figure 7D). Thus, neuronal loss itself recapitulates many of the pathway changes seen in the AD brain (Matarin et al. 2015).
Figure 7. Gene expression changes induced by neuronal lesion and microglial repopulation.
NanoString technology was employed to assess RNA transcript levels of 182 genes in hippocampal tissue. A, Subset of genes related to Alzheimer’s Disease, B, Subset of genes related to aging, plasticity, and neurotransmission. Levels have been normalized to control, set at 100%. C, Pathway analyses of Control vs. Lesion significant changes in gene expression revealed predicted upstream regulators, including APP and IFNG. Predicted states shown (activation or inhibition), as well as z-score and p-value. D, Downstream network from APP shown for Control vs. Lesion gene expression changes, highlighting decreases in synaptic associated genes, and increases in inflammatory genes. Shades of green show downregulated genes, while shades of red show upregulated genes. Network is shown in the context of subcellular localization. Error bars represent SEM, (n=4/group). Symbols denote significant differences between groups (p<0.05): † Control vs. PLX3397; * Control vs. Lesion; ϕ PLX3397 vs. Lesion + PLX3397; # Lesion vs. Lesion + PLX3397.
Microglial repopulation dampens lesion-induced inflammation
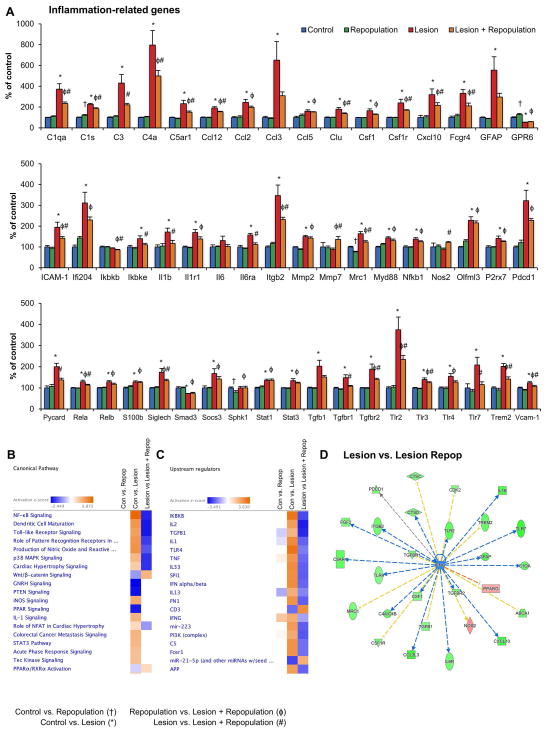
Having shown that microglial repopulation following extensive neuronal injury has dramatic effects on the localization and morphology of reactive microglia, we characterized neuroinflammatory signaling in the brain by directly analyzing mRNA levels for 81 inflammatory-related genes. Forty-six of the surveyed inflammatory-associated genes were upregulated in mice that were lesioned. This finding demonstrates a robust and chronic neuroinflammatory response to the lesioning paradigm, despite ten weeks having passed since the lesion began. Of the 46 genes that were increased with lesion, 28 were significantly reduced with microglial repopulation (Figure 8A). These genes encode proteins involved in complement signaling and other immune response pathways, monocyte chemoattraction, leukocyte endothelial transmigration, microglia proliferation and survival, microglia-mediated phagocytosis, and apoptotic pathways. Pathway analyses of the total 182 genes in all 4 groups was performed to identify the canonical pathways and their activation states, as well as the predicted upstream regulators (Figure 8B and C). No changes in canonical pathways were seen between Control and Repopulation groups, showing that repopulated microglia in uninjured mice are indistinguishable in this way from resident microglia in Control mice. On the other hand, lesioning robustly upregulated pathways associated with inflammation, such as NF-kB and Toll-like receptor signaling (Figure 8B), with IKBKB, IL2, TGFB1, IL1, and TLR4 being identified as highly activated upstream regulators (Figure 8C). Crucially, all of these canonical pathways and upstream regulators were significantly downregulated with Lesion + Repopulation (Figure 8B and C). We expanded the pathway from IFNG for Lesion vs. Lesion + Repopulation, showing significant downregulation of most downstream molecules (Figure 8D). Thus, microglial elimination, followed by repopulation, largely resolves chronic neuroinflammatory signaling at the mRNA level. Importantly, we demonstrate that repopulating microglia do not inherit the activation state of the original lesion-associated microglia.
Figure 8. Microglial repopulation dampens inflammatory signaling following neuronal lesion.
A, NanoString technology was employed to assess RNA transcript levels of inflammation-related genes in hippocampal tissue. Levels have been normalized to control, set at 100%. B, Changes in canonical pathways were identified for Control vs. Repopulation, Control vs. Lesion, and Lesion vs. Lesion + Repopulation, and z-scores calculated with + values indicating activation of a pathway and – values indicating inhibition. Comparisons of z-scores shows activation of inflammatory related pathways with Lesion but these are resolved with Lesion + Repopulation. C, Upstream regulators were identified for Control vs. Repopulation, Control vs. Lesion, and Lesion vs. Lesion + Repopulation, and z-scores calculated. Comparisons of z-scores shows overall activation of inflammatory related regulators with Lesion but these are resolved with Lesion + Repopulation. D, Downstream pathway shown from IFNG for Lesion vs. Lesion + Repopulation, showing downregulation of most components. Error bars represent SEM, (n=4/group). Symbols denote significant differences between groups (p<0.05): † Control vs. PLX3397; * Control vs. Lesion; ϕ PLX3397 vs. Lesion + PLX3397; # Lesion vs. Lesion + PLX3397.
DISCUSSION
Microglia become primed with age, disease, and injury, wherein they fail to resolve insults and instead remain chronically activated (Holtman et al. 2015; Perry and Holmes 2014; Wes et al. 2016). Such chronic inflammation is a key component of most CNS insults, and harms the local brain environment through the production of inflammatory substances such as reactive oxygen species (ROS) and cytokines (Liu et al. 1998; Renno et al. 1995). Additionally, chronically activated microglia can physically interact with other cell types such as neurons to facilitate synaptic stripping (Trapp et al. 2007; Wake et al. 2009). Thus, identifying effective ways to control and resolve chronic neuroinflammation is a pressing issue with relevance to the majority of CNS disorders and injuries.
Microglia are critically dependent upon CSF1R signaling; CSF1R knockout mice do not develop microglia (Erblich et al. 2011; Ginhoux et al. 2010), while pharmacologic inhibition of the CSF1R rapidly eliminates most microglia from the brain (Elmore et al. 2014), including those in an activated state (Rice et al. 2015), without detrimental effects to the animal. Microglia remain eliminated for the duration of treatment, but withdrawal of CSF1R inhibition stimulates robust and rapid repopulation of the entire CNS with new cells that become microglia (Elmore et al. 2015; Elmore et al. 2014), effectively replacing the entire microglial compartment. As CSF1R inhibitors are currently used in the clinic, and more are being developed (Tap et al. 2015), these molecules offer a powerful tool against neuroinflammation. As chronic microglial elimination after injury or during disease might not be clinically feasible, we have explored the potential of short-term microglial depletion, followed by repopulation of the microglial compartment, to assess the effects on neuroinflammation, neuronal structures, and functional recovery.
Critically, our data reveal that we can renew the microglial compartment in the face of massive inflammation, and that doing so results in robustly positive effects. Firstly, repopulation resolves many aspects of chronic neuroinflammation, including microglial morphology and expression of reactive markers, as well as inflammatory transcripts. Secondly, elimination and subsequent repopulation appears to increase synaptic surrogates, such as dendritic spines and synaptophysin and PSD95 puncta numbers. Remarkably, just two weeks of microglial elimination is sufficient to dramatically increase spine densities, revealing a critical homeostatic role for microglia in regulating neuronal structures. Finally, and most importantly, microglial repopulation results in an almost complete reversal of behavioral impairment, despite the continued deficit in forebrain neurons, suggesting that repopulation promotes an environment for recovery.
Additionally, these data provide insight as to the nature of microglia and sustained inflammatory responses. That repopulating microglia appear to be less reactive than the microglia they replaced suggests that unresolved chronic inflammation is inherent within the cells themselves, rather than being fully dictated by the environment. This may help to explain why microglia fail to return to a quiescent state following damage, such as a traumatic brain injury (Ramlackhansingh et al. 2011)(Cherry et al. 2016).
In conclusion, we present a novel approach to the resolution of chronic neuroinflammatory events and the promotion of brain repair. We propose that CSF1R-dependent elimination of chronically reactive microglia followed by microglial repopulation can potentially offer a lasting solution to chronic inflammation and improve functional outcomes in individuals who have suffered severe brain insults.
Acknowledgments
This work was supported by the National Institutes of Health under awards 1R01NS083801 (NINDS), P50 AG016573 (NIA) to KNG, and F31NS086409 to RAR. The content is solely the responsibility of the authors and does not necessarily represent the official views of the National Institutes of Health.
Footnotes
Financial Disclosures:
Dr. Rice reports no financial interests or conflicts of interest; Mr. Pham reports no financial interests or conflicts of interest; Mr. Lee reports no financial interests or conflicts of interest; Mrs. Najafi reports no financial interests or conflicts of interest; Dr. West is an employee of Plexxikon Inc.; Dr. Green reports no financial interests or conflicts of interest.
References
- Acharya MM, Green KN, Allen BD, Najafi AR, Syage A, Minasyan H, Le MT, Kawashita T, Giedzinski E, Parihar VK, et al. Elimination of microglia improves cognitive function following cranial irradiation. Sci Rep. 2016;6:31545. doi: 10.1038/srep31545. [DOI] [PMC free article] [PubMed] [Google Scholar]
- Baglietto-Vargas D, Medeiros R, Martinez-Coria H, LaFerla FM, Green KN. Mifepristone alters amyloid precursor protein processing to preclude amyloid beta and also reduces tau pathology. Biol Psychiatry. 2013;74:357–66. doi: 10.1016/j.biopsych.2012.12.003. [DOI] [PMC free article] [PubMed] [Google Scholar]
- Bruttger J, Karram K, Wortge S, Regen T, Marini F, Hoppmann N, Klein M, Blank T, Yona S, Wolf Y, et al. Genetic Cell Ablation Reveals Clusters of Local Self-Renewing Microglia in the Mammalian Central Nervous System. Immunity. 2015;43:92–106. doi: 10.1016/j.immuni.2015.06.012. [DOI] [PubMed] [Google Scholar]
- Castello NA, Nguyen MH, Tran JD, Cheng D, Green KN, LaFerla FM. 7,8-Dihydroxyflavone, a small molecule TrkB agonist, improves spatial memory and increases thin spine density in a mouse model of Alzheimer disease-like neuronal loss. PLoS One. 2014;9:e91453. doi: 10.1371/journal.pone.0091453. [DOI] [PMC free article] [PubMed] [Google Scholar]
- Cherry JD, Tripodis Y, Alvarez VE, Huber B, Kiernan PT, Daneshvar DH, Mez J, Montenigro PH, Solomon TM, Alosco ML, et al. Microglial neuroinflammation contributes to tau accumulation in chronic traumatic encephalopathy. Acta Neuropathol Commun. 2016;4:112. doi: 10.1186/s40478-016-0382-8. [DOI] [PMC free article] [PubMed] [Google Scholar]
- Cik M, Masure S, Lesage AS, Van Der Linden I, Van Gompel P, Pangalos MN, Gordon RD, Leysen JE. Binding of GDNF and neurturin to human GDNF family receptor alpha 1 and 2. Influence of cRET and cooperative interactions. J Biol Chem. 2000;275:27505–12. doi: 10.1074/jbc.M000306200. [DOI] [PubMed] [Google Scholar]
- Clark KC, Josephson A, Benusa SD, Hartley RK, Baer M, Thummala S, Joslyn M, Sword BA, Elford H, Oh U, et al. Compromised axon initial segment integrity in EAE is preceded by microglial reactivity and contact. Glia. 2016;64:1190–209. doi: 10.1002/glia.22991. [DOI] [PubMed] [Google Scholar]
- Clarke WE, Berry M, Smith C, Kent A, Logan A. Coordination of fibroblast growth factor receptor 1 (FGFR1) and fibroblast growth factor-2 (FGF-2) trafficking to nuclei of reactive astrocytes around cerebral lesions in adult rats. Mol Cell Neurosci. 2001;17:17–30. doi: 10.1006/mcne.2000.0920. [DOI] [PubMed] [Google Scholar]
- Colton C, Wilcock DM. Assessing activation states in microglia. CNS Neurol Disord Drug Targets. 2010;9:174–91. doi: 10.2174/187152710791012053. [DOI] [PubMed] [Google Scholar]
- Dagher NN, Najafi AR, Kayala KM, Elmore MR, White TE, Medeiros R, West BL, Green KN. Colony-stimulating factor 1 receptor inhibition prevents microglial plaque association and improves cognition in 3xTg-AD mice. J Neuroinflammation. 2015;12:139. doi: 10.1186/s12974-015-0366-9. [DOI] [PMC free article] [PubMed] [Google Scholar]
- Elmore MR, Lee RJ, West BL, Green KN. Characterizing newly repopulated microglia in the adult mouse: impacts on animal behavior, cell morphology, and neuroinflammation. PLoS One. 2015;10:e0122912. doi: 10.1371/journal.pone.0122912. [DOI] [PMC free article] [PubMed] [Google Scholar]
- Elmore MR, Najafi AR, Koike MA, Dagher NN, Spangenberg EE, Rice RA, Kitazawa M, Matusow B, Nguyen H, West BL, et al. Colony-stimulating factor 1 receptor signaling is necessary for microglia viability, unmasking a microglia progenitor cell in the adult brain. Neuron. 2014;82:380–97. doi: 10.1016/j.neuron.2014.02.040. [DOI] [PMC free article] [PubMed] [Google Scholar]
- Erblich B, Zhu L, Etgen AM, Dobrenis K, Pollard JW. Absence of colony stimulation factor-1 receptor results in loss of microglia, disrupted brain development and olfactory deficits. PLoS One. 2011;6:e26317. doi: 10.1371/journal.pone.0026317. [DOI] [PMC free article] [PubMed] [Google Scholar]
- Feng G, Mellor RH, Bernstein M, Keller-Peck C, Nguyen QT, Wallace M, Nerbonne JM, Lichtman JW, Sanes JR. Imaging neuronal subsets in transgenic mice expressing multiple spectral variants of GFP. Neuron. 2000;28:41–51. doi: 10.1016/s0896-6273(00)00084-2. [DOI] [PubMed] [Google Scholar]
- Ginhoux F, Greter M, Leboeuf M, Nandi S, See P, Gokhan S, Mehler MF, Conway SJ, Ng LG, Stanley ER, et al. Fate mapping analysis reveals that adult microglia derive from primitive macrophages. Science. 2010;330:841–5. doi: 10.1126/science.1194637. [DOI] [PMC free article] [PubMed] [Google Scholar]
- Holness CL, Simmons DL. Molecular cloning of CD68, a human macrophage marker related to lysosomal glycoproteins. Blood. 1993;81:1607–13. [PubMed] [Google Scholar]
- Holtman IR, Noback M, Bijlsma M, Duong KN, van der Geest MA, Ketelaars PT, Brouwer N, Vainchtein ID, Eggen BJ, Boddeke HW. Glia Open Access Database (GOAD): A comprehensive gene expression encyclopedia of glia cells in health and disease. Glia. 2015;63:1495–506. doi: 10.1002/glia.22810. [DOI] [PubMed] [Google Scholar]
- Klein D, Patzko A, Schreiber D, van Hauwermeiren A, Baier M, Groh J, West BL, Martini R. Targeting the colony stimulating factor 1 receptor alleviates two forms of Charcot-Marie-Tooth disease in mice. Brain. 2015 doi: 10.1093/brain/awv240. [DOI] [PubMed] [Google Scholar]
- Liu JS, Amaral TD, Brosnan CF, Lee SC. IFNs are critical regulators of IL-1 receptor antagonist and IL-1 expression in human microglia. J Immunol. 1998;161:1989–96. [PubMed] [Google Scholar]
- Loane DJ, Kumar A, Stoica BA, Cabatbat R, Faden AI. Progressive neurodegeneration after experimental brain trauma: association with chronic microglial activation. J Neuropathol Exp Neurol. 2014;73:14–29. doi: 10.1097/NEN.0000000000000021. [DOI] [PMC free article] [PubMed] [Google Scholar]
- Masliah E, Mallory M, Hansen L, Alford M, Albright T, Terry R, Shapiro P, Sundsmo M, Saitoh T. Immunoreactivity of CD45, a protein phosphotyrosine phosphatase, in Alzheimer’s disease. Acta Neuropathol. 1991;83:12–20. doi: 10.1007/BF00294425. [DOI] [PubMed] [Google Scholar]
- Matarin M, Salih DA, Yasvoina M, Cummings DM, Guelfi S, Liu W, Nahaboo Solim MA, Moens TG, Paublete RM, Ali SS, et al. A genome-wide gene-expression analysis and database in transgenic mice during development of amyloid or tau pathology. Cell Rep. 2015;10:633–44. doi: 10.1016/j.celrep.2014.12.041. [DOI] [PubMed] [Google Scholar]
- Min KJ, Yang MS, Kim SU, Jou I, Joe EH. Astrocytes induce hemeoxygenase-1 expression in microglia: a feasible mechanism for preventing excessive brain inflammation. J Neurosci. 2006;26:1880–7. doi: 10.1523/JNEUROSCI.3696-05.2006. [DOI] [PMC free article] [PubMed] [Google Scholar]
- Muhleisen H, Gehrmann J, Meyermann R. Reactive microglia in Creutzfeldt-Jakob disease. Neuropathol Appl Neurobiol. 1995;21:505–17. doi: 10.1111/j.1365-2990.1995.tb01097.x. [DOI] [PubMed] [Google Scholar]
- Nagamoto-Combs K, McNeal DW, Morecraft RJ, Combs CK. Prolonged microgliosis in the rhesus monkey central nervous system after traumatic brain injury. J Neurotrauma. 2007;24:1719–42. doi: 10.1089/neu.2007.0377. [DOI] [PubMed] [Google Scholar]
- Nimmerjahn A, Kirchhoff F, Helmchen F. Resting microglial cells are highly dynamic surveillants of brain parenchyma in vivo. Science. 2005;308:1314–8. doi: 10.1126/science.1110647. [DOI] [PubMed] [Google Scholar]
- Perry VH, Holmes C. Microglial priming in neurodegenerative disease. Nat Rev Neurol. 2014;10:217–24. doi: 10.1038/nrneurol.2014.38. [DOI] [PubMed] [Google Scholar]
- Ramlackhansingh AF, Brooks DJ, Greenwood RJ, Bose SK, Turkheimer FE, Kinnunen KM, Gentleman S, Heckemann RA, Gunanayagam K, Gelosa G, et al. Inflammation after trauma: microglial activation and traumatic brain injury. Ann Neurol. 2011;70:374–83. doi: 10.1002/ana.22455. [DOI] [PubMed] [Google Scholar]
- Renno T, Krakowski M, Piccirillo C, Lin JY, Owens T. TNF-alpha expression by resident microglia and infiltrating leukocytes in the central nervous system of mice with experimental allergic encephalomyelitis. Regulation by Th1 cytokines. J Immunol. 1995;154:944–53. [PubMed] [Google Scholar]
- Rice RA, Spangenberg EE, Yamate-Morgan H, Lee RJ, Arora RP, Hernandez MX, Tenner AJ, West BL, Green KN. Elimination of Microglia Improves Functional Outcomes Following Extensive Neuronal Loss in the Hippocampus. J Neurosci. 2015;35:9977–89. doi: 10.1523/JNEUROSCI.0336-15.2015. [DOI] [PMC free article] [PubMed] [Google Scholar]
- Saijo K, Winner B, Carson CT, Collier JG, Boyer L, Rosenfeld MG, Gage FH, Glass CK. A Nurr1/CoREST pathway in microglia and astrocytes protects dopaminergic neurons from inflammation-induced death. Cell. 2009;137:47–59. doi: 10.1016/j.cell.2009.01.038. [DOI] [PMC free article] [PubMed] [Google Scholar]
- Schreiner B, Romanelli E, Liberski P, Ingold-Heppner B, Sobottka-Brillout B, Hartwig T, Chandrasekar V, Johannssen H, Zeilhofer HU, Aguzzi A, et al. Astrocyte Depletion Impairs Redox Homeostasis and Triggers Neuronal Loss in the Adult CNS. Cell Rep. 2015;12:1377–84. doi: 10.1016/j.celrep.2015.07.051. [DOI] [PubMed] [Google Scholar]
- Smith DH, Chen XH, Pierce JE, Wolf JA, Trojanowski JQ, Graham DI, McIntosh TK. Progressive atrophy and neuron death for one year following brain trauma in the rat. J Neurotrauma. 1997;14:715–27. doi: 10.1089/neu.1997.14.715. [DOI] [PubMed] [Google Scholar]
- Spangenberg EE, Lee RJ, Najafi AR, Rice RA, Elmore MR, Blurton-Jones M, West BL, Green KN. Eliminating microglia in Alzheimer’s mice prevents neuronal loss without modulating amyloid-beta pathology. Brain. 2016;139:1265–81. doi: 10.1093/brain/aww016. [DOI] [PMC free article] [PubMed] [Google Scholar]
- Tap WD, Wainberg ZA, Anthony SP, Ibrahim PN, Zhang C, Healey JH, Chmielowski B, Staddon AP, Cohn AL, Shapiro GI, et al. Structure-Guided Blockade of CSF1R Kinase in Tenosynovial Giant-Cell Tumor. N Engl J Med. 2015;373:428–37. doi: 10.1056/NEJMoa1411366. [DOI] [PubMed] [Google Scholar]
- Trapp BD, Wujek JR, Criste GA, Jalabi W, Yin X, Kidd GJ, Stohlman S, Ransohoff R. Evidence for synaptic stripping by cortical microglia. Glia. 2007;55:360–8. doi: 10.1002/glia.20462. [DOI] [PubMed] [Google Scholar]
- Valdearcos M, Robblee MM, Benjamin DI, Nomura DK, Xu AW, Koliwad SK. Microglia dictate the impact of saturated fat consumption on hypothalamic inflammation and neuronal function. Cell Rep. 2014;9:2124–38. doi: 10.1016/j.celrep.2014.11.018. [DOI] [PMC free article] [PubMed] [Google Scholar]
- Wake H, Moorhouse AJ, Jinno S, Kohsaka S, Nabekura J. Resting microglia directly monitor the functional state of synapses in vivo and determine the fate of ischemic terminals. J Neurosci. 2009;29:3974–80. doi: 10.1523/JNEUROSCI.4363-08.2009. [DOI] [PMC free article] [PubMed] [Google Scholar]
- Wes PD, Holtman IR, Boddeke EW, Moller T, Eggen BJ. Next generation transcriptomics and genomics elucidate biological complexity of microglia in health and disease. Glia. 2016;64:197–213. doi: 10.1002/glia.22866. [DOI] [PubMed] [Google Scholar]
- Yamasaki TR, Blurton-Jones M, Morrissette DA, Kitazawa M, Oddo S, LaFerla FM. Neural stem cells improve memory in an inducible mouse model of neuronal loss. J Neurosci. 2007;27:11925–33. doi: 10.1523/JNEUROSCI.1627-07.2007. [DOI] [PMC free article] [PubMed] [Google Scholar]


