Abstract
Background
ICD shocks are potentially associated with myocardial injury, altered hemodynamics, apoptosis and inflammatory signaling. Their precise cellular impact can be explored after defibrillation testing (DFT) via biomarkers. We evaluated changes in biomarkers after ICD shocks during DFT.
Methods
We prospectively enrolled outpatients presenting for first implantation of a cardiac device. Biomarkers indicative of myocardial injury, inflammation and apoptosis were measured before and after implantation, and compared between patients receiving DFT (DFT+) to those not (DFT−).
Results
Sixty-three patients were enrolled, 40 in the DFT+ group and 23 in the DFT− group. Average levels of troponin I, hsCRP, Calprotectin, NTproBNP, and sFas increased by >50% after cardiac device implantation compared to baseline. Increase in troponin never exceeded 50 fold upper limit of normal (2ng/mL). Troponin trended higher in the DFT+ group at 8 hours (median 0.18 ng/mL, IQR 0.11–0.48) versus the DFT− group (0.10 ng/mL, IQR 0.06–0.28, P=0.0501); NTproBNP had a similar trend (p=0.0581). sFas significantly increased in the DFT+ group from baseline (median 4663 pg/mL, IQR 2908–5679) to 24 hours (5039 pg/mL, IQR 3274–6261; p=0.0338) but not in the DFT− group (p=0.4705).
Conclusion
DFT testing is associated with acutely increased plasma levels of troponin and sFas, a biomarker of apoptosis, along with a trend towards higher NTproBNP.
Keywords: Biomarkers, apoptosis, implantable cardioverter-defibrillator, defibrillation testing, shock, Troponin, sFas
INTRODUCTION
Implantable cardioverter-defibrillators (ICD) reduce mortality in selected patient populations[1]. However, ICD shocks have been associated with adverse clinical outcomes such as reduced quality of life, psychiatric disorders, induced ventricular arrhythmias, and increased mortality[2–4]. ICD shocks are difficult to study in clinical setting as their occurrence is unpredictable and associated with multiple clinical variables. On the other hand, ICD shocks delivered during defibrillation testing (DFT) provides a more controlled environment and a unique opportunity to study their impact on various factors such as plasma biomarkers.
Plasma biomarkers may reflect changes in cardiac tissue and provide mechanistic insight into cellular effects of ICD shocks. To assess the acute effects of ICD shocks on the ventricular myocardium, we measured levels of common cardiac biomarkers representing myocardial cellular injury, systemic inflammation, apoptosis, and failing ventricle(s) in a prospective cohort of stable outpatients, at baseline and after implantation of an ICD with DFT testing. A control group was concurrently studied for comparison and included patients presenting for implantation of a permanent cardiac implantable electronic device (CIED), but without DFT testing. The purpose of this study is to measure biomarker changes linked to defibrillation while considering other potential confounders such as lead screw deployment in the myocardium, and specifically evaluate the range of troponin increase with DFT.
MATERIALS AND METHODS
Patients
We prospectively enrolled 63 consecutive outpatients presenting to our institution from 2011 to 2014 for initial implantation of CIED. Patients were excluded if they were already hospitalized for any other reason, had any known ongoing medical condition that could suggest baseline biomarker alteration (such as active inflammatory disease, ongoing heart failure or atrial fibrillation), underwent concomitant radiofrequency ablation, had preexisting CIED or could not undergo DFT (e.g. LV thrombus). The study was approved by the local IRB. All subjects provided written informed consent.
Device implantation and DFT testing
All patients met appropriate criteria for device implantation based on current ACCF/AHA/HRS guidelines[1]. The device manufacturer and procedural techniques were determined by the implanting physician. All CIED used active-fixation transvenous lead systems, implanted in the left or right pectoral region, from one of four major device companies. In some patients, multiple lead positioning attempts were required to obtain optimal sensing and pacing thresholds. The total number of lead screw deployment attempts was recorded for each patient to quantify direct myocardial trauma.
After successful ICD implantation, intraoperative DFT testing was based on the operator’s practice [5]. Some operators performed routine testing, while others never did, given data questioning the clinical benefit of this practice[6,7]. Patients were sedated using conscious sedation (fentanyl and midazolam). For patients that underwent DFT testing, ventricular fibrillation (VF) was induced using shock on T wave or DC fibber methods[8]. Defibrillation was then performed after automatic detection of VF, typically with a threshold of at least 10 J safety margin as compared to the maximal energy delivered through the device. In case of failure of the first defibrillation, a second defibrillation was performed at maximal device output. External rescue defibrillation was performed in case of failed second internal defibrillation. DFT testing was not repeated if the first defibrillation was successful with 14 J or less. DFT testing was otherwise typically repeated once. Following the procedure, patients were admitted for overnight observation and discharged the subsequent day.
Biomarker sampling and analysis
Blood samples were drawn at baseline immediately before the procedure and at approximately 8, 16, and 24 hours post-procedure.
Troponin
The Access AccuTnI chemiluminescent immunoassay(R) (Beckman Coulter; Brea, CA) was used by the clinical laboratory at the University of Kentucky to quantify cTnI concentrations (ng/mL). The 99th percentile value for this assay was estimated as 0.04 ng/mL, as documented by the package insert and established by internal quality control procedures of the clinical laboratory using samples from >120 healthy volunteers. The 6 month median coefficient of variation (CV) at the 99th percentile was 14%. The upper limit of normal was set at a CV of 10% and defined as <0.05[9].
Inflammatory, apoptosis and heart failure biomarkers
Detailed biomarker analysis was performed on pre-procedure and 24 hour samples. Plasma was obtained from EDTA anticoagulated blood centrifuged at 135g for 10 minutes. Plasma was aliquoted and kept at −80°C until biomarker analysis. sE-Selectin, sVCAM-1, sICAM, NTproBNP, sFas, and hsCRP were analyzed using LuminexxMAP technology (Luminex; Austin, TX) with plates obtained from Millipore (EMD Millipore; Billerica, MA) and read on either a Bio-Plex 200 System (Bio-Rad; Hercules, CA) or MAGPIX multiplex reader (Luminex; Austin, TX). Thrombomodulin and collagen (C-telopeptide of type I collagen) were analyzed using ELISA kits purchased from R&D systems (Minneapolis, MN). Calprotectin (S100A8/A9) was analyzed by ELISA using plates purchased from ALPCO (Salem, NH). Results were standardized using plasma samples from a cohort of healthy volunteers.
A pilot experiment (Figure 1) was performed on the first 20 patients receiving ICD and DFT testing. Thrombomodulin, collagen, VCAM1, sE-selection, and ICAM1 displayed a mean <1.15 fold change in levels at 24 hours, and therefore were not measured in the entire cohort. The remaining biomarkers displayed a mean >1.5 fold change and were measured in all subjects.
Figure 1.
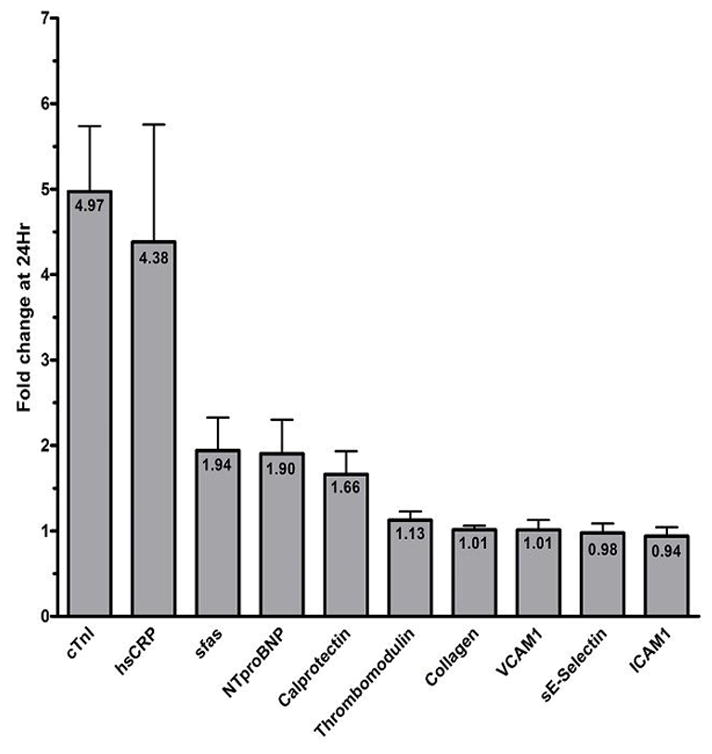
Pilot experiment: fold change of biomarkers at 24h following ICD implantation with DFT compared to baseline. Change is normalized to 1 (no change). Error bars represent standard error. Values in each column represent mean fold change.
Consideration of potential confounders
Besides the shock during the DFT process in the DFT+ group, the magnitude of change in biomarkers compared to the DFT− group could also be related to potential confounders such as: the lead screw including the type of lead (pacemaker vs. defibrillator lead), or the low blood pressures achieved during deep sedation for DFT testing. These factors were compared between the DFT+ and DFT− groups, in particular using the mean arterial blood pressure (MAP) reflective of organ perfusion and calculated via the approximation formula MAP=2/3 Diastolic BP +1/3 Systolic BP. The mean MAP from the DFT+ group before DFT and the mean MAP from the DFT− group were compared. The mean MAP within 10 minutes before DFT and the mean MAP within 10 minutes after DFT were also compared within the DFT+ group. Finally, the lowest MAP within 10 min post DFT and the level of change in MAP pre DFT vs. post DFT were correlated with the change in sFas and NTproBNP from baseline to 24 hours as well as with the change in troponin from baseline to 8, 16, and 24 hours respectively.
Statistical analysis
Results in this manuscript were obtained using the following statistical methods. Comparisons within groups over time were performed with the Wilcoxon signed rank test. Comparisons between patient groups were performed by a T-test for normally distributed variables, a Mann-Whitney test for continuous non-normally distributed variables, or Fisher’s exact test for dichotomous variables. In addition, mixed effects linear modeling analyses assessed troponin trajectories over time among DFT+ patients vs. DFT− patients and among ICD lead DFT− patients vs. pacemaker lead DFT− patients; Bonferroni-adjusted post-hoc tests were used for examinations at specific time points (8 hours, 16 hours, 24 hours) as appropriate, and troponin was log-transformed to reduce its non-normality. Bivariate associations between continuous variables were assessed using Spearman correlations. Descriptive statistics are mean ±SD for normally distributed variables, median with interquartile range for continuous non-normally distributed variables, or number with percent for dichotomous variables. Statistical analysis and graph generation were accomplished using GraphPad Prism (version 4.03) and SAS (Version 9.3). P<0.05 was considered significant.
RESULTS
Patient and device implantation characteristics
The patient characteristics and procedure implantation parameters are detailed in Table 1. Patients in the DFT− group had 14 ICDs implanted for primary prevention and 9 pacemakers for pacing indications (5 single-chamber ICDs, 5 dual-chamber ICDs, 4 biventricular ICDs, 2 single-chamber pacemakers, 6 dual-chamber pacemakers, and 1 biventricular pacemaker). There were 4 single-chamber ICDs, 26 dual-chamber ICDs, and 10 biventricular ICDs in the DFT+ group. There were a total of 184 lead screw deployments. Among the 40 patients that underwent DFT, 22 patients underwent one shock, 14 patients two shocks and 4 patients 3 shocks. The maximal total energy delivered to any patient was 86.5 J. The modal energy for the DFT+ group was 40 J. One patient required rescue external defibrillation.
Table 1.
Baseline characteristics
| Cohort | DFT+ | DFT− | ||
|---|---|---|---|---|
|
| ||||
| Demographics | (n = 63) | (n = 40) | (n = 23) | p-value |
| Age (years) | 59.4 ± 13.6 | 55.9 ± 12.4 | 65.6 ± 13.7 | 0.007 |
| Number of males (%) | 41 (65) | 27 (68) | 14 (61) | 0.375 |
| Median LVEF (IQR) | 30.0 (21.8–35.0) | 28.8 (23.0–30.0) | 30.0 (21.3–50.0) | 0.255 |
| Number with ischemic etiology (%) | 35 (56) | 25 (63) | 10 (43) | 0.190 |
| Creatinine (mg/dL) | 1.04 ± 0.33 | 1.03 ± 0.29 | 1.06 ± 0.08 | 0.757 |
|
| ||||
| Implantation parameters | ||||
|
| ||||
| Screw deployments (number) | 2.9 ± 1.6 | 3.1 ±1.3 | 2.7±2.0 | 0.530 |
| Shocks per patient (number) | - | 1.6 ± 0.7 | n/a | - |
| Energy (J) | - | 33.1 ± 18.4 | n/a | - |
| Duration VF (sec) | - | 13 ± 3 | n/a | - |
| VF cycle length (ms) | - | 188 ± 23 | n/a | - |
Baseline characteristics of cohort and implantation parameters. VF (ventricular fibrillation).
Biomarker analysis
cTnI
The values for cTnI before and at indicated times after the procedure are graphed in Figure 2. Baseline mean cTnI values were comparable between the two groups (0.02 ng/mL median, IQR 0.02–0.03 vs. 0.03 ng/mL median, IQR 0.02–0.05, P=0.3869), the CTnI normal value ranging from 0.00 to 0.04 ng/mL. A statistically significant rise in cTnI was seen in both groups at 8 hours compared to baseline values (P<0.05 for both groups). The DFT+ group displayed a greater absolute cTnI at 8 hours (0.18 ng/mL, IQR 0.11–0.48) compared to the DFT− group (0.10 ng/mL, IQR 0.06–0.28, P=0.0501). Levels of cTnI declined over time in both groups but remained elevated at 24 hours compared to baseline (P < 0.05 for both groups at each time). Most patients (38/40, 95%) displayed an increase in troponin that was <25 fold the upper limit of normal troponin level (<1 ng/mL); no patients had a cTnI increase >50 fold the upper limit of normal (<2 ng/mL).
Figure 2.
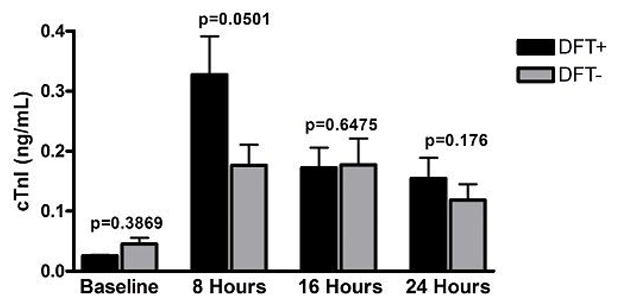
Serum cTnI levels (ng/ml) versus time: baseline and approximately 8, 16 and 24 hours post procedure in patients receiving ICDs and DFT testing(black bars) and patients receiving cardiac devices without DFT testing (gray bars).
The mixed effects linear modeling on log-transformed troponin established that the change of troponin over time was different for DFT+ than for DFT−, when one considered 8 hours, 16 hours, and 24 hours simultaneously (p = 0.024). Bonferroni adjusted post-hoc testing did not localize the difference to any specific time point.
Among patients in the DFT+ group, the upper quarter with respect to increase in cTnI level at 8 hours following implantation was identified. In this subgroup, cTnI was ≥0.30 ng/mL at 8 hours. To identify factors associated with largest troponin rise, we compared the subgroup of DFT+ patients who had cTnI≥0.30 ng/mL versus those who had cTnI<0.30 ng/mL at 8 hours, identifying differences in some parameters (Figure 3). However, no significant differences were seen for mean age (58 vs. 60 years, p=0.707), LVEF (32% vs. 31%, p=0.723), serum creatinine (1.10 vs. 0.90 mg/dL, p=0.334), or total lead screwing attempts (3.0 vs. 2.5, p=0.360).
Figure 3.
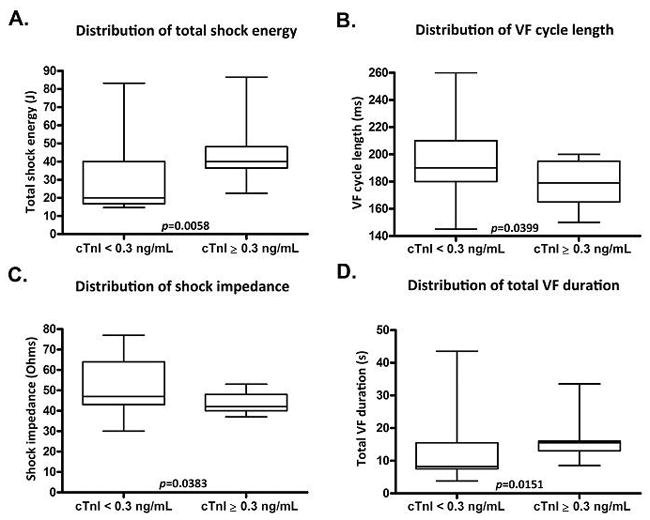
Comparisons of cTnI level ≥0.3 ng/mL subgroup with cTnI level <0.3 ng/mL subgroup after DFT testing in total shock energy, VF cycle length, shock impedance and VF duration.
In the DFT− group, the increase in cTnI from baseline to 8 hours correlated with the total number of lead screw deployment attempts (p=0.008, 0.607 Spearman correlation). Furthermore, when comparing the 14 patients with ICD leads and the 9 patients with pacemaker leads, there was no statistical difference regarding release of troponin (p=0.55 by linear mixed modeling) or number of screw attempts (p=0.33).
sFas
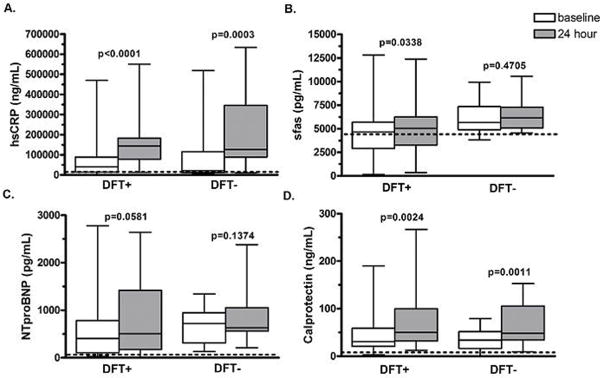
Levels of soluble Fas (sFas) in the DFT+ and DFT− groups were not significantly different from healthy controls at baseline (p=0.9815 and 0.0808, respectively, Figure 4). Levels of sFas increased significantly in the DFT+ group at 24 hours from a median of 4663 (2908–5679, IQR) to 5039 pg/mL (3274–6261, IQR) (p=0.0338) but not in the DFT− group, where median levels were 5673 pg/mL (4891–7345, IQR) and 6048 pg/mL (5084–7283, IQR) (p=0.4705), respectively, at baseline and 24 hours.
Figure 4.
Biomaker levels at baseline and at 24 hours post procedure in patients receiving implantable devices with and without DFT. The line within each boxy represents the median value while the box displays the 25th–75th percentile (interquartile range). The dashed line represents the median serum level of each biomarker in a healthy control group.
In addition, we evaluated the sFas change in the DFT+ group versus the 14 patients in the DFT− group with ICD implantation for a more homogenous comparison (no statistical difference in age). Levels of sFas increased significantly in the DFT+ group at 24 hours but not in the DFT− group with ICD only (figure 5). Importantly, among patients in the DFT+ group, wide variation in sFas levels was noted, with 10 patients demonstrating a ≥ 1.5 fold increase, and one patient displaying a nearly 7 fold-change in sFas (Figure 5). In contrast, only 1 patient in the DFT− cohort with ICDs displayed a >1.5 fold increase in sFas, yet with a mild elevation less than 1.7 fold. In the DFT+ group, the median sFas increase among the 10 patients with a ≥ 1.5 fold change from baseline was 2356 ng/L (IQR 1175–2958) compared to a median sFas increase of 44 ng/L (IQR −793 to 1088) among patients with sFas fold changes < 1.5. Among DFT+ patients with sFas fold change ≥ 1.5 at 24 hours, there was a significant correlation between the change in sFas level and the total number of screw deployments (p=0.0147), total shocking energy (p=0.0357), duration of VF (first induction, p=0.0057), and VF cycle length (first induction, p=0.0360).
Figure 5.
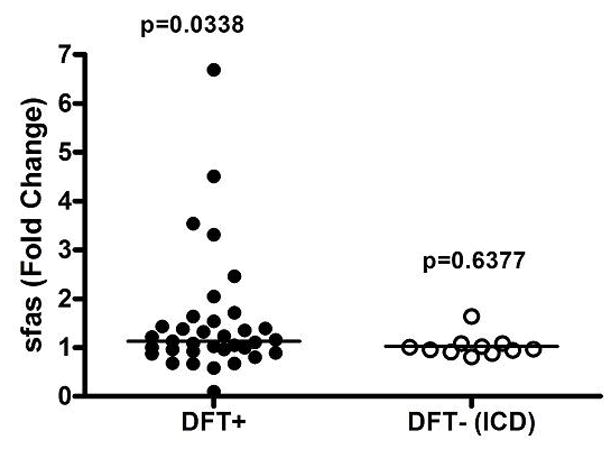
This figure reports for each patient the fold change of sFas level from before to after the procedure, among patients that underwent a DFT versus those that did not and had an ICD.
NTproBNP and other biomarkers
Levels of NT-proBNP were similar between DFT+ and DFT− groups at baseline (p=0.0945) and indistinguishable from healthy controls (p=0.5495 and 0.7150, respectively; Figure 4). At 24 hours, levels of NT-proBNP were not significantly different from baseline or between groups, although there was a trend towards BNP elevation in the DFT+ group at 24 hours (median 506 pg/mL [IQR 176–1415]) versus baseline (median 403 pg/mL [IQR 105–781]; P=0.0581). There was no significant difference between DFT+ and DFT− groups for hsCRP and calprotectin at 24 hours.
Potential confounders
The mean±SD MAP from the DFT+ group before testing was 86.14±15.98 mmHg vs. 86.61±15.83 mmHg for the DFT− group, p=0.38. In the DFT+ group, there was no statistical difference between the MAP measured within 10 minutes before and after testing (86.14±15.98 mmHg vs. 84.57±15.65 mmHg, p=0.09). There was no significant correlation between either the lowest MAP post DFT or the level of MAP change pre vs. post DFT, with the amount of absolute change in any of the following biomarkers: sFas; NTproBNP; troponin at 8, 16, and 24 hours.
DISCUSSION
Troponin increase
High energy shocks can cause histologic myocardial damage[10,11]; however, detection of myocardial injury in humans using biomarker surrogates of myocardial injury (primarily creatinine kinase and cardiac troponin isoforms) in response to defibrillation at standard energy levels has been inconsistent and controversial[12,13].
In our study, two different mechanisms of troponin elevation were observed. The first, distinct from defibrillation shock, was observed in the DFT− group with a troponin increase related to the number of lead screw deployments. This suggests direct myocardial trauma from the helix deployment during active lead fixation, as described in a recent study[14].
The second mechanism of troponin elevation seems a direct effect of intracardiac defibrillation shock. Although cTnI increased in both DFT+ and DFT− groups in our study, DFT+ patients had higher levels of cTnI release compared to the DFT− group, likely associated with the defibrillation shock. Our results, similar to other studies [13,15,16], contrast with those of Furniss et al [14] who used a control group with DFT only (at time of ICD generator change) and found no troponin elevation associated with defibrillation. This discrepancy may be related to the lower number of patients included in their study, as well as the lower energy delivered with a single shock. In our study, the subgroup of DFT+ patients who displayed a greater release of cTnI levels (≥0.3 ng/mL) was exposed to higher total shock energy, lower VF cycle length, and longer VF duration. Greater myocardial oxygen supply-demand mismatch with a faster VF rate and longer duration of VF may underlie this observation. However, a recent animal study does not support this hypothesis since shocks from subcutaneous defibrillators associated with VF induction, and expected longer VF detection time, were not associated with troponin increase[17]. This was confirmed in the TropShock-Trial, where DFT with or without arrhythmia induction (upper limit of vulnerability in the latter case) increased troponin [18]. Therefore, the most likely mechanism for troponin elevation associated with DFT testing is electroporation [19,20], although limited myocardial necrosis cannot be ruled out. In addition, the magnitude of cTnI peak levels was small, less than 1 ng/mL following implantation (25 fold the upper limit of normal) in 38/40 (95%) patients and less than 50 fold the upper limit of normal (2 ng/mL) in all patients. Also, much of this troponin increase is not due to the shocks but to lead screw deployments.
sFas
We observed a statistically significant increase in sFas after DFT testing (approximately 13% on average), which was not seen in the group without DFT testing. However, an important increase of sFas beyond 50% of baseline was only seen in 10/40 patients of the DFT+ group (5 of whom had an increase >100%) and one of the DFT− group (barely above 50% for this latter patient). In the 10 patients, sFas increase correlated with various parameters that included the total amount of energy delivered.
The Fas/Fas ligand (FasL) system facilitates apoptotic signaling and is an important regulator of lymphocyte activity and autoimmunity[21]. While the Fas/FasL system normally maintains proper lymphocyte and cellular composition, deranged function in response to inherent or exogenous stimulation can lead to lymphoid proliferation, autoimmunity, malignancy and cardiomyopathy[22]. Furthermore, this system plays a role in the early remodeling of granulation tissue to fibrotic scar in the early post-myocardial infarction period [23]. sFas, an alternatively spliced construct of Fas, can be measured in circulating plasma as a surrogate of apoptotic activity. This biomarker has clinical application in patients presenting with ischemic symptoms, where sFas elevation improves accuracy in the diagnosis of true ACS versus non-ACS symptoms [24]. Levels of sFas may remain elevated above baseline for 30–40 days following the initial ACS event, in contrast to markers of myocardial necrosis and systemic inflammation, cTnI and hsCRP, respectively, which exhibit transient elevations post-infarct [25]. Thus, this system may mediate post-infarct remodeling remotely from the initial necrosis and inflammation. The acute sFas increase suggests that some apoptotic and remodeling signaling occurs after defibrillation. However, shocks in the setting of DFT testing have not been associated with better or adverse outcomes among patients undergoing ICD implantation in recent studies [6,26]. Therefore, DFT, which used to be performed routinely after ICD implants, is currently performed only in a minority of patients with particular features (e.g. subcutaneous ICD). Whether a sFas increase occurs among patients receiving ICD shocks in clinical settings has not been demonstrated yet but is likely based on our results. Further studies are needed to assess the clinical value of sFas elevation among patients receiving spontaneous ICD shocks. The potential negative effect of DFT should not overshadow the improved survival related to ICD therapies, which may occur months to years after ICD implantation.
Study limitations
Our study, although prospective, was not randomized; there were slight differences in patient variables between experimental and control groups, given a minority of patients receiving pacemakers in the control group. However, there was not a statistical difference in troponin when comparing patients with pacemakers vs. ICD in the DFT− control group. This limitation does not apply to the sFas findings, since sFas changes were similarly negligible whether the DFT− group was examined in toto or limited to patients with ICD. Yet, since baseline levels were used to assess biomarker changes, slight group differences in patient variables should have little impact on the study.
The changes observed in biomarker levels were limited to an acute period of 24 hours. The evolution of those biomarkers over the next few days or weeks, in particular for sFas, was not assessed. Nevertheless, meaningful alterations in hemodynamics leading to clinical heart failure would be expected to persist up to or beyond 24 hours. Thus, our timeframe likely represents a meaningful reference.
Similarly, there was no attempt at association of clinical outcomes with the biomarker changes, since the number of patients was relatively small and the follow-up relatively short. Finally, the sample size may not have allowed detection of some modest changes in biomarkers.
CONCLUSION
In our prospective study of stable outpatients, those who received DFT testing with ICD implantation experienced significant increases in cTnI and sFas along with a trend toward increased NTproBNP. Patients not receiving DFT testing did not have significant increases in sFas or NTproBNP, and their significant increase in cTnl was milder than that of patients receiving DFT. Further studies are needed to explore the clinical importance of sFas elevation following ICD shocks.
Acknowledgments
This publication was supported by the National Center for Research Resources and the National Center for Advancing Translational Sciences, National Institutes of Health, through Grant UL1TR000117. The content is solely the responsibility of the authors and does not necessarily represent the official views of the NIH.
Footnotes
Conflict of interest:
Dr Charnigo has been a co-investigator on two grants from Astra Zeneca
References
- 1.Tracy CM, Epstein AE, Darbar D, DiMarco JP, Dunbar SB, Estes M, Ferguson TB, et al. 2012 ACCF/AHA/HRS focused update incorporated into the ACCF/AHA/HRS 2008 guidelines for device-based therapy of cardiac rhythm abnormalities: a report of the American College of Cardiology Foundation/American Heart Association Task Force on Practice Guidelines and the Heart Rhythm Society. J Am Coll Cardiol. 2013;61(3):e6–75. doi: 10.1016/j.jacc.2012.11.007. [DOI] [PubMed] [Google Scholar]
- 2.Poole JE, Johnson GW, Hellkamp AS, Anderson J, Callans DJ, Raitt MH, Reddy RK, et al. Prognostic importance of defibrillator shocks in patients with heart failure. N Engl J Med. 2008;359(10):1009–1017. doi: 10.1056/NEJMoa071098. [DOI] [PMC free article] [PubMed] [Google Scholar]
- 3.Moss AJ, Schuger C, Beck CA, Brown MW, Cannom DS, Daubert JP, Estes M, et al. Reduction in inappropriate therapy and mortality through ICD programming. N Engl J Med. 2012;367(24):2275–2283. doi: 10.1056/NEJMoa1211107. [DOI] [PubMed] [Google Scholar]
- 4.Heller SS, Ormont MA, Lidagoster L, Sciacca RR, Steinberg S. Psychosocial outcome after ICD implantation: a current perspective. Pacing Clin Electrophysiol. 1998;21(6):1207–15. doi: 10.1111/j.1540-8159.1998.tb00179.x. [DOI] [PubMed] [Google Scholar]
- 5.Barold SS, Herweg B, Curtis AB. The defibrillation safety margin of patients receiving ICDs: a matter of definition. Pacing Clin Electrophysiol. 2005;28(9):881–882. doi: 10.1111/j.1540-8159.2005.00191.x. [DOI] [PubMed] [Google Scholar]
- 6.Healey JS, Hohnloser SH, Glikson M, Neuzner J, Mabo P, Vinolas X, Kautzner J, et al. Shockless IMPLant Evaluation [SIMPLE] investigators. Cardioverter defibrillator implantation without induction of ventricular fibrillation: a single-blind, non-inferiority, randomised controlled trial (SIMPLE) Lancet. 2015;385(9970):785–91. doi: 10.1016/S0140-6736(14)61903-6. [DOI] [PubMed] [Google Scholar]
- 7.Stavrakis S, Patel NH, Reynolds DW. Defibrillation threshold testing does not predict clinical outcomes during long-term follow-up: a meta-analysis. Pacing Clin Electrophysiol. 2013;36(11):1402–1408. doi: 10.1111/pace.12218. [DOI] [PubMed] [Google Scholar]
- 8.Ito H, Kawamura M, Badhwar N, Vedantham V, Tseng ZH, Lee BK, Lee RJ, et al. The Effect of Direct Current Stimulation versus T-Wave Shock on Defibrillation Threshold Testing. Pacing Clin Electrophysiol. 2015;38(10):1173–1180. doi: 10.1111/pace.12684. [DOI] [PubMed] [Google Scholar]
- 9.Whitley RJ, DABCC, FACB, Director, Clinical Chemistry, Toxicology, & Core Laboratory; University of Kentucky, Lexington, KY. Personal communication. 2014.
- 10.Babbs CF, Tacker WA, VanVleet JF, Bourland JD, Geddes LA. Therapeutic indices for transchest defibrillator shocks: effective, damaging, and lethal electrical doses. Am Heart J. 1980;99(6):734–738. doi: 10.1016/0002-8703(80)90623-7. [DOI] [PubMed] [Google Scholar]
- 11.Avitall B, Port S, Gal R, McKinnie J, Tchou P, Jazayeri M, Troup P, et al. Automatic implantable cardioverter/defibrillator discharges and acute myocardial injury. Circulation. 1990;81(5):1482–1487. doi: 10.1161/01.cir.81.5.1482. [DOI] [PubMed] [Google Scholar]
- 12.Bonnefoy E, Chevalier P, Kirkorian G, Guidolet J, Marchand A, Touboul P. Cardiac troponin I does not increase after cardioversion. Chest. 1997;111(1):15–18. doi: 10.1378/chest.111.1.15. [DOI] [PubMed] [Google Scholar]
- 13.Hurst TM, Hinrichs M, Breidenbach C, Katz N, Waldecker B. Detection of myocardial injury during transvenous implantation of automatic cardioverter-defibrillators. J Am Coll Cardiol. 1999;34(2):402–408. doi: 10.1016/s0735-1097(99)00194-1. [DOI] [PubMed] [Google Scholar]
- 14.Furniss G, Shi B, Jimenez A, Harding SA, Larsen PD. Cardiac troponin levels following implantable cardioverter defibrillation implantation and testing. Europace. 2015;17(2):262–266. doi: 10.1093/europace/euu306. [DOI] [PubMed] [Google Scholar]
- 15.Davoodi G, Mohammadi V, Shafiee A, Kazemisaeid A, Sadeghian S, Vasheghani-Farahani A, Yaminisharif A. Detection of myocardial injury due to defibrillation threshold checking after insertion of implantable cardioverter/defibrillators. Acta Cardiol. 2013;68(2):167–172. doi: 10.1080/ac.68.2.2967274. [DOI] [PubMed] [Google Scholar]
- 16.Francis CK, Kuo YH, Azzam I, Selim S, Patel N, Beri R, Goldman D, et al. Brain natriuretic peptide and biomarkers of myocardial ischemia increase after defibrillation threshold testing. Pacing Clin Electrophysiol. 2012;35(3):314–319. doi: 10.1111/j.1540-8159.2011.03275.x. [DOI] [PubMed] [Google Scholar]
- 17.Killingsworth CR, Melnick SB, Litovsky SH, Ideker RE, Walcott GP. Evaluation of acute cardiac and chest wall damage after shocks with a subcutaneous implantable cardioverter defibrillator in Swine. Pacing Clin Electrophysiol. 2013;36(10):1265–1272. doi: 10.1111/pace.12173. [DOI] [PMC free article] [PubMed] [Google Scholar]
- 18.Semmler V, Biermann J, Haller B, Jilek C, Sarafoff N, Lennerz C, Vrazic H, et al. ICD Shock, Not Ventricular Fibrillation, Causes Elevation of High Sensitive Troponin T after Defibrillation Threshold Testing--The Prospective, Randomized, Multicentre TropShock-Trial. PLoS One. 2015;10(7):e0131570. doi: 10.1371/journal.pone.0131570. [DOI] [PMC free article] [PubMed] [Google Scholar]
- 19.Tsai MS, Tang W, Sun S, Wang H, Freeman G, Chen WJ, Weil MH. Individual effect of components of defibrillation waveform on the contractile function and intracellular calcium dynamics of cardiomyocytes. Crit Care Med. 2009;37(8):2394–2401. doi: 10.1097/CCM.0b013e3181a02ea1. [DOI] [PubMed] [Google Scholar]
- 20.Elayi CS, Whitbeck MG, Charnigo R, Shah J, Macaulay TE, Morales G, Gurley JC, et al. Is there an association between external cardioversions and long-term mortality and morbidity? Insights from the Atrial Fibrillation Follow-up Investigation of Rhythm Management study. Circ Arrhythm Electrophysiol. 2011;4(4):465–469. doi: 10.1161/CIRCEP.110.960591. [DOI] [PubMed] [Google Scholar]
- 21.Nishigaki K, Minatoguchi S, Seishima M, Asano K, Noda T, Yasuda N, Sano H, et al. Plasma Fas ligand, an inducer of apoptosis, and plasma soluble Fas, an inhibitor of apoptosis, in patients with chronic congestive heart failure. J Am Coll Cardiol. 1997;29(6):1214–1220. doi: 10.1016/s0735-1097(97)00055-7. [DOI] [PubMed] [Google Scholar]
- 22.Niu J, Azfer A, Wang K, Wang X, Kolattukudy PE. Cardiac-targeted expression of soluble fas attenuates doxorubicin-induced cardiotoxicity in mice. J Pharmacol Exp Ther. 2009;328(3):740–748. doi: 10.1124/jpet.108.146423. [DOI] [PMC free article] [PubMed] [Google Scholar]
- 23.Li Y, Takemura G, Kosai K, Takahashi T, Okada H, Miyata S, Yuge K, et al. Critical roles for the Fas/Fas ligand system in postinfarction ventricular remodeling and heart failure. Circ Res. 2004;95(6):627–636. doi: 10.1161/01.RES.0000141528.54850.bd. [DOI] [PubMed] [Google Scholar]
- 24.Cardinal H, Brophy JM, Bogaty P, Joseph L, Hebert MJ, Boyer L, Madore F. Usefulness of soluble fas levels for improving diagnostic accuracy and prognosis for acute coronary syndromes. Am J Cardiol. 2010;105(6):797–803. doi: 10.1016/j.amjcard.2009.10.061. [DOI] [PubMed] [Google Scholar]
- 25.Cardinal H, Madore F, Brophy JM, Joseph L, Hebert MJ, Min S, Boyer L, et al. Longitudinal trends in sFas, a biomarker of apoptosis, after an acute coronary syndrome: clues to the pathogenesis underlying adverse events on follow-up. Int J Cardiol. 2014;173(3):603–607. doi: 10.1016/j.ijcard.2014.03.139. [DOI] [PubMed] [Google Scholar]
- 26.Brignole M, Occhetta E, Bongiorni MG, Proclemer A, Favale S, Iacopino S, Calò L, Vado A, Buja G, Mascioli G, Quartieri F, Tritto M, Parravicini U, Castro A, Tomasi C, Villani GQ, D’Acri MG, Klersy C, Gasparini M SAFE-ICD Study Investigators. Clinical evaluation of defibrillation testing in an unselected population of 2,120 consecutive patients undergoing first implantable cardioverter-defibrillator implant. J Am Coll Cardiol. 2012 Sep 11;60(11):981–7. doi: 10.1016/j.jacc.2012.05.014. [DOI] [PubMed] [Google Scholar]


