Abstract
Quantitative analysis of morphogenesis aids our understanding of developmental processes by providing a method to link changes in shape with cellular and molecular processes. Over the last decade many methods have been developed for 3D imaging of embryos using microCT scanning to quantify the shape of embryos during development. These methods generally involve a powerful, cross-linking fixative such as paraformaldehyde to limit shrinkage during the CT scan. However, the extended time frames that these embryos are incubated in such fixatives prevent use of the tissues for molecular analysis after microCT scanning. This is a significant problem because it limits the ability to correlate variation in molecular data with morphology at the level of individual embryos. Here, we outline a novel method that allows RNA, DNA or protein isolation following CT scan while also allowing imaging of different tissue layers within the developing embryo. We show shape differences early in craniofacial development (E11.5) between common mouse genetic backgrounds, and demonstrate that we are able to generate RNA from these embryos after CT scanning that is suitable for downstream RT-PCR and RNAseq analyses.
Introduction
Understanding mechanisms of morphogenesis has been of crucial importance to developmental biology since its inception (Hall, 1999). Over the last 20 years, significant effort has been focused on developing methods to quantify morphology as it is the direct result of morphogenesis (Dickinson, 2006). 3D micro- computed tomography or microCT imaging has emerged as a key method for quantifying 3D morphology in embryos using geometric morphometrics (Kristensen et al., 2008; Parsons et al., 2008; Sensen and Hallgrímsson, 2008; Zelditch et al., 2012) as well as atlas based phenotyping (Wong et al., 2014). While scanning electron microscopy can generate detailed images of 3D surfaces, specimen preparation often causes shrinkage artifacts and usually generates a 2D image of a 3D object (Boyde and Wood, 1969; Peddie and Collinson, 2014), limiting the utility of these kinds of images for quantification.
The goal of any morphometric analysis is to quantify size and shape. In early development, this can be tricky due to the fragility of embryos. Before the development of skeletal elements, embryos lack structural support and are prone to shape distortion and shrinking. It is generally necessary to use strong fixatives to prevent the embryos from deforming during imaging. These strong fixatives cause their own problems and can cause shrinkage and shape deformation (Schmidt et al., 2010). These fixatives all have strong cross-linking properties, rendering highly degraded nucleic acids and protein and preventing the use of the embryos for downstream analysis such as quantitative-PCR or western blot. Further, early to mid-gestational mouse embryos lack the calcified tissue typically visualized during computed tomography X-ray scanning. Therefore, the use of contrast agents is necessary to visualize the tissue (Wong et al., 2012). A properly contrasted scan also allows segmentation of different regions and tissues (Wong et al., 2014). Different contrast agents can be used to mark different regions of the developing embryo (Metscher, 2009). One of the most commonly used agents is iodine, either in an aqueous solution with potassium iodide or iodine metal in alcohol (Gignac et al., 2016); however, both of these agents are known to cause shrinkage artifacts in young embryos (Schmidt et al., 2010).
The inability to both image specimens in 3D and quantify development, limits the study of the mechanistic basis of morphogenesis because molecular mechanisms and the phenotypic results of those mechanisms must be quantified in separate sets of embryos. This means that comparisons can only be made between groups such that one can only relate the mean of the shape within a genotype, stage or treatment group to the mean of gene expression. Obviously, this results in loss of statistical power because individuals within such groups commonly vary in both parameters. More importantly, though, this hampers the mechanistic study of individual-level variation. Studies of the molecular basis for morphogenesis will be aided by the ability to relate quantitative variation in morphology directly to the variation in the molecular mechanisms that are driving morphogenesis. This is particularly relevant when studying the mechanistic basis for variable expressivity, incomplete penetrance, or variation among individuals in response to a treatment. This ability can also be used to relate molecular changes to morphological variation across ontogenetic stages. To facilitate these studies, we developed a new method that minimizes shrinkage artifacts, maximizes contrast between tissue layers and, most importantly, protects nucleic acids allowing examination of RNA changes in the same embryos that are used for microCT analysis. To test this method, we analyzed shape differences between two common strains of mice, C57BL/6J and BALB/c and show that we are able to generate high quality RNA from the same embryos after they have been subjected to microCT scanning.
Experimental Procedures
Mouse work and embryo dissection
C57BL/6J and BALB/cJ mice were imported from Jackson Labs (Bar Harbor, USA) and bred in the animal facility at University of Calgary. Matings were set for each strain and dams checked daily for the presence of a post-coital plug. Dams were sacrificed by isoflurane anesthesia followed by cervical dislocation 11 days following visualization of the plug – Embryonic Day (E) 11.5. Embryos were dissected in ice-cold phosphate buffered saline treated with Diethyl-pyrocarbonate (DEPC, 1:1000 - incubated at room temperature overnight, then autoclaved).
Embryo Fixation
Immediately following dissection, embryos were placed in sterilized glass vials in the PaxGene tissue fix solution (Qiagen - PreAnalytics, cat # 765312) and immediately placed in an inverting style rotary mixer to ensure that samples were continually moving and did not flatten against the side of the vial during fixation. Samples were incubated overnight at room temperature in this mixer. In the morning, the solution was changed to the PaxGene Tissue Stabilizer solution prepared to manufacture specification (Qiagen - PreAnalytics, cat # 765512). Samples were incubated 15 mins, the solution replaced then samples were stored at −20°C until CT scanning.
MicroCT scan preparation and scanning
Prior to CT scanning a contrast solution was made consisting of PaxGene Tissue Stabilizer solution mixed with 1% weight to volume iodine metal. This solution was incubated at room temperature at least overnight to allow iodine to dissolve and then was thoroughly mixed prior to use.
One hour prior to CT scanning each embryo was transferred into a fresh contrast solution. Embryos were then briefly washed in PaxGene Tissue Stabilizer solution, photographed to count tail somites. For the embryos used for landmark analysis the heads were dissected and quickly dried on kimwipes before being mounted on soft wax and covered with an inverted microcentrifuge tube. 50–100μl of clean Tissue Stabilizer solution was then injected from the top of the tube around the edge of the wax to prevent desiccation during scanning. The inverted PCR tube was placed in a Scanco UCT 35 desktop scanner and scanned at 19μM resolution and 55kpV and reconstructed using the Scanco software.
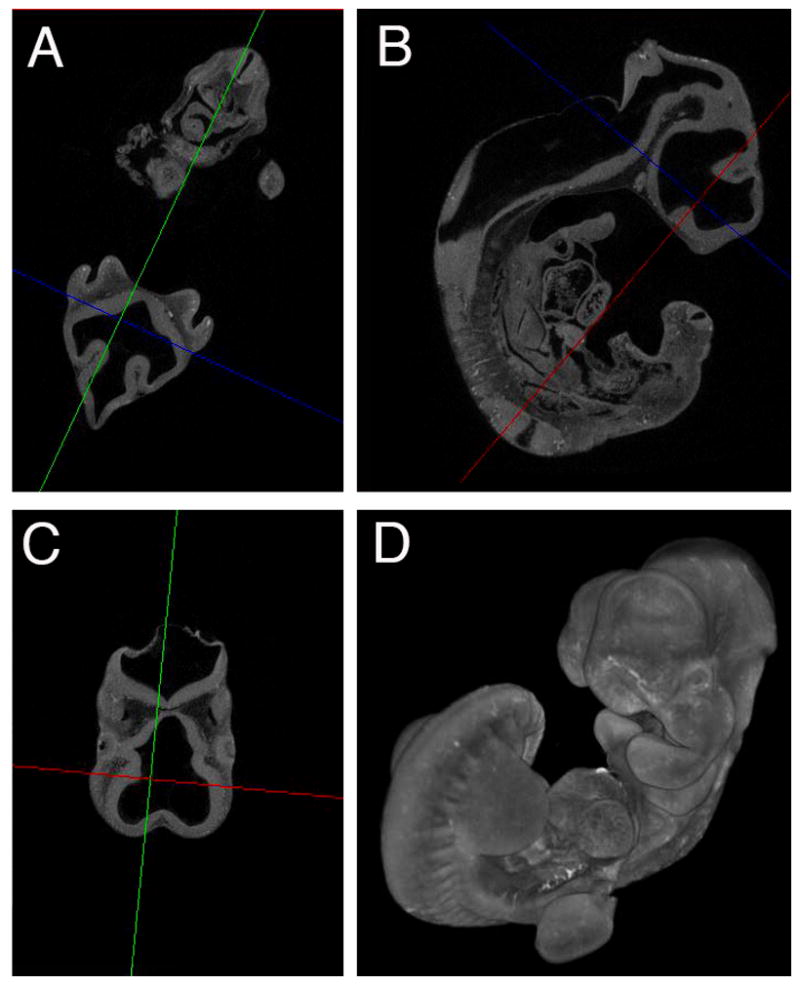
The embryo shown in Figure 4 was placed in a 200μl pipette tip filled with Tissue Stabilizer solution with the tip bent and sealed similar to (Metscher, 2009) and imaged using an XRadia scanner. Following CT scanning, embryos were rinsed 3x15 minutes in fresh Tissue Stabilizer solution then stored at −20°C.
Figure 4.

Embryo images. A-C) Segment images taken at various angles, D) Projection view of embryo.
Landmark analysis
Embryos were landmarked as previously published (Percival et al., 2014). Landmark coordinates were imported into R (Ver 3.3) (R Core Team) using Rstudio (Ver 1.0.44) and analyzed using Geomorph (Ver 3.0.3) (Adams and Otárola Castillo, 2013) and Moprho packages (Ver 2.4.1.1) (Schlager, 2016). Code is available upon request.
RNA extraction and analysis
RNA was extracted using the PaxGene Tissue miRNA extraction kit (Cat # 766134) following manufacture instructions with the following exception. Tissue lysis was performed by placing the in a clean 1.7 ml snap-top tube, adding 100μl of the lysis buffer and then lysing using a 1.5 ml tube sized pestle attached to battery operated motor. RNA was analyzed using the Agilent TapeStation instrument. cDNA was made using the Maxima First Strand Kit (ThermoFisher Cat #K1641) per manufacture instructions. Real time PCR was performed using pre-designed assays from the Integrated DNA Technologies Prime -Time Series GAPDH (Mm.PT.39a.1), Camkmt (Mm.PT.58.7890215), Six2 (Mm.PT.58.22007192).
Results and Discussion
Here we develop and test a method to generate both a 3D computed tomography scan and RNA from the same embryo. This method is based on fixing embryos using the PAXgene system in place of a crosslinking fixative with the goal of preserving histological integrity, while also protecting both nucleic acid and protein. We show that this system can be integrated into a microCT workflow to preserve nucleic acid during microCT scanning. In order to test this method, we fixed at least 10 of each C57BL/6J and BALB/c E11.5 mouse embryos in both a standard 4% Paraformaledhyde (PFA/5% Gluteraldehyde (Glu) fix (Schmidt et al., 2010) and also in the PaxGene tissue system. Using two different mouse lines allows us to test two hypotheses. The first hypothesis is that strain difference results in early developmental shape differences and the second is that any changes due to fixation difference will be similar between the two lines.
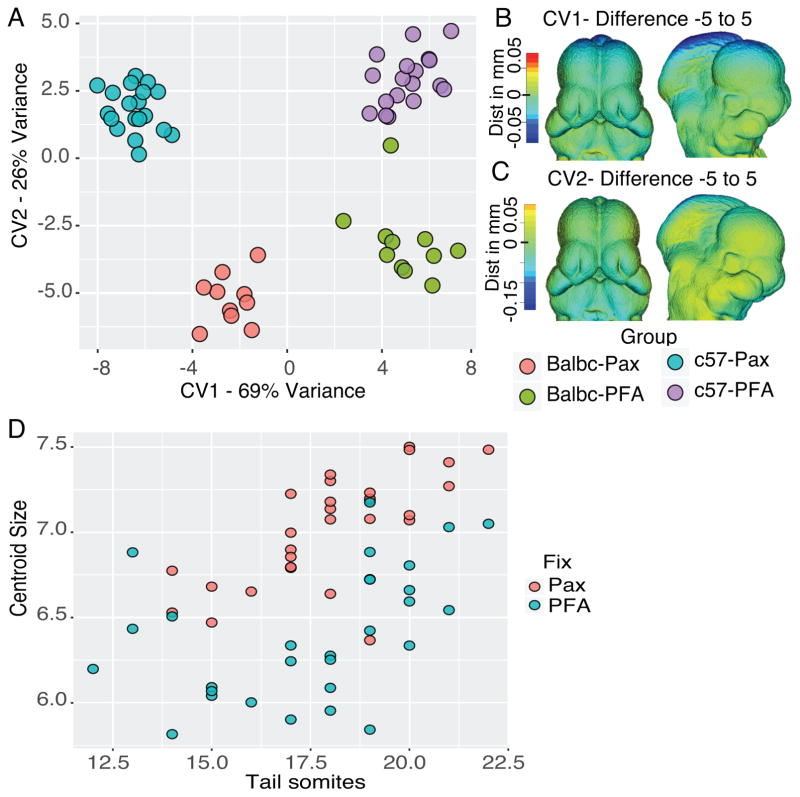
Understanding how alternate fixation and contrasting agents affect shape is necessary before a new fixation method can be utilized in quantitative studies. If a fixation method alters shape in a non-uniform manner, it would be less than ideal for quantitative studies. To test the effect of fixation, we fixed at least 10 embryos from each of the different lines in either our standard 4% PFA/5% Glu fixative, followed by contrasting in CystoConray (Schmidt et al., 2010) or in the PAXgene system followed by contrasting in 1% iodine in the stabilization buffer (see Methods section). Following scanning and landmarking, a basic geometric morphometric analysis was performed. Analysis of all 4 groups (BALB/c PFA, BALB/c Pax, C57BL/6 PFA, and C57BL/6 Pax) showed several interesting trends (Figure 1). First based on a multivariate ANOVA there were differences in shape between all four groups (Table 1). These differences could be interpreted using a Canonical Variates Analysis (CVA), which determines the largest axis of variation between defined groups. Using this analysis we observed that changes between the fixation method account for the majority of the shape differences among the groups (69%) (Figure 1A). The differences caused by changing the fixation method appear to be quite comparable between the two strains, as no strain by fixation interaction was detected. Analysis of the differences that generate this 1st Canonical Variate shows that there are minimal changes in the region of the developing face, but that there are strong changes in the regions of the embryo which tend to shrink during microCT scanning: the mid and hindbrain. The Pax fixed embryos were generally larger in these regions, suggesting less shrinkage. Further, when plotting age (number of tail somites) against the size of the head shows that the Pax fixed embryos had a generally larger head size to age ratio and apparently less variability in this ratio. This result is also suggests that the Pax fixed embryos are less prone to shrinkage during scanning, though the tail somites are also easier to count in the Pax fixed groups.
Figure 1.
Different fixation methods effect size. A) Canonical Variates Analysis of the two mouse strains by two fixation methods. The first Canonical Variate separates group by fixation and the second by strain. B–C) Heat maps showing the changes across CV1 (B) and CV2 (C). Changes are the difference between the −5 end of the CV and the +5 end of the CV. Note that there are large negative changes in the top of the head in CV1 as CV value moves toward the PFA fixation. D) Plot of tail somite number versus centroid size.
Table 1.
ANOVA table showing various factors included in the model.
| Df | SS | MS | Rsq | F | Z | Pr(>F) | |
|---|---|---|---|---|---|---|---|
| age | 1.0000 | 0.1028 | 0.1028 | 0.2347 | 26.0292 | 9.8294 | 0.0020 |
| Csize | 1.0000 | 0.0505 | 0.0505 | 0.1154 | 12.7973 | 7.2084 | 0.0020 |
| fix | 1.0000 | 0.0291 | 0.0291 | 0.0666 | 7.3796 | 5.2235 | 0.0020 |
| strain | 1.0000 | 0.0397 | 0.0397 | 0.0907 | 10.0520 | 7.9980 | 0.0020 |
| Csize:fix | 1.0000 | 0.0104 | 0.0104 | 0.0237 | 2.6260 | 2.5574 | 0.0040 |
| Residuals | 52.0000 | 0.2053 | 0.0039 | ||||
| Total | 57.0000 | 0.4378 |
Csize = centroid size, age = number of tail somites.
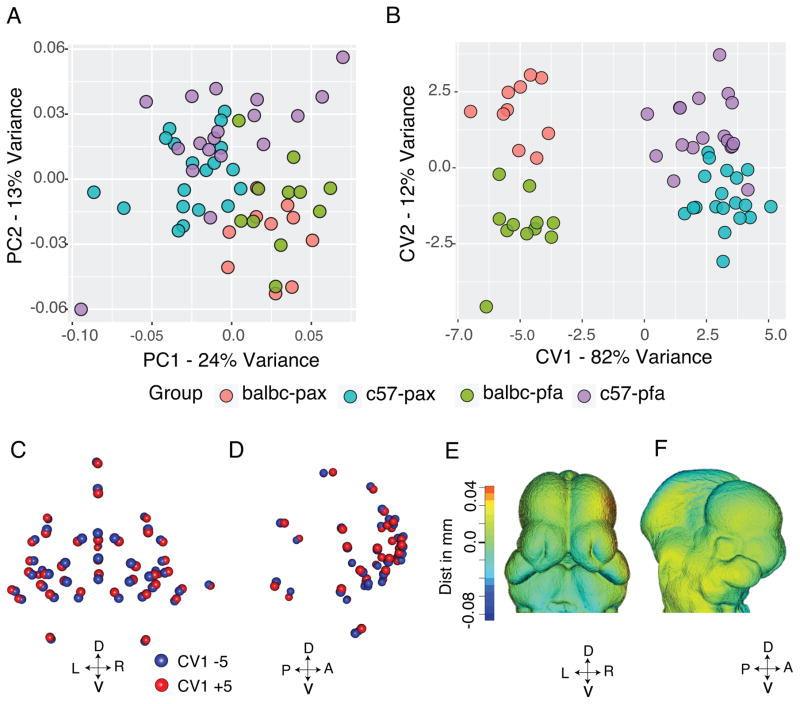
Since embryos change shape very rapidly over time, when working with embryos that can be staged using tail somite number we perform a multivariate linear regression on a combination of centroid size (size of the head) and tail somite number and use the residuals of this regression to remove some of the allometric or age-size related shape variation (Green et al., 2015). This method allows pooling of embryos that are approximately the same age (eg within 1 day for E11.5 mouse embryos). Previous results have shown that the combination of age and size generates a more linear regression than either variable alone, possibly due to the occasional difficulty of counting tail somites (Smith et al., 2015). Once age and size have been corrected for, the shape differences between the two lines represent the majority of the remaining variation (Figure 2A, B). A Principal Components Plot, showing the largest two axes of variation amongst all samples shows a primary separation by strain and a weak separation by fixation. Canonical Variate 1 represents the differences between the lines and 82% of the remaining shape variation (Figure 2B). While there is some separation between fixation along the second canonical variate, this separation may be due to forcing a between group difference, which is quite weak. There is, however, a size by fixation interaction, which is also shown in the ANOVA table (Table 1). By this time point we observe subtle differences in the shape of the faces of C57BL/6J E11.5 and BALB/c embryos, C57BL/6J embryos generally have wider midfaces, while BALB/c embryos tend to have longer midfaces, suggesting that there are subtle alterations in facial development in these mice (Figure 2C–F).
Figure 2.
Shape differences between groups following size regression. A) Principal Components Analysis showing the overall variation of all data. B) Canonical Variates Analysis with grouping by the two mouse strains and the two fixation methods. The first Canonical Variate separates group by strain. C–D) Displacement maps showing the difference at each landmark position between CV1 −5 (blue) and CV +5 (Red). Dorsal (D) is up, Ventral (V) is down. C) Frontal view (L -left, R - right) and D) lateral view (A - anterior, P - posterior). E–F) Color map of the same changes.
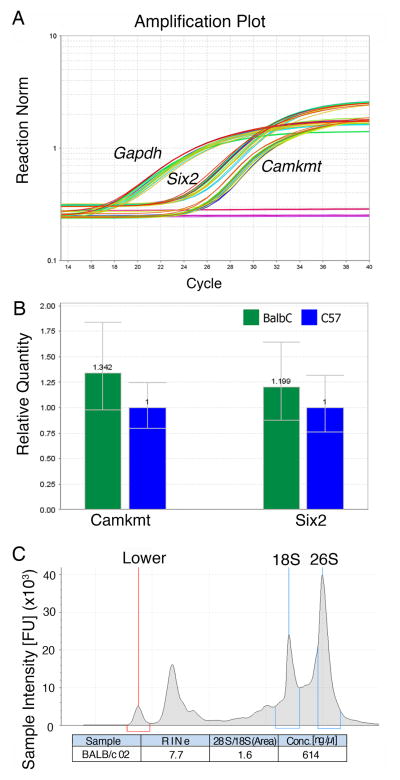
A subset of three stage-matched embryos from each group was then used to assess the ability to perform gene expression analysis. Total RNA was extracted and cDNA was made from the PAX gene fixed groups, six samples and real-time PCR was performed for Six2 and Camkmt, two genes known to be expressed in the mouse face during craniofacial development (Figure 3A–B). While we did not observe any significant differences in gene expression for these genes, they show clean amplification curves. RNA integrity analysis for this RNA shows RIN values in the range of 7–8 (Figure 3C). While these numbers appear low for RNAseq purposes, this is anticipated due to the incorporation of small RNAs and is within the expected range of the kit. We were unable to generate RNA of any quality or quantity from the formaldehyde fixed samples.
Figure 3.
Analysis of RNA following CT scanning. A) Graph of the amplification plots for each Gapdh, Camkmt and Six2. Rn is the fluorescence of the reporter dye divided by the fluorescence of a passive reference dye. Negative control wells show no amplification. B) Relative levels of Camkmt and Six2 across the groups. C) RNA integrity analysis from the BioAnalyzer, showing the clear 18S, 26S bands as well as a lower marker.
The identification of contrast reagents for computed tomography analysis of embryonic tissues has been tricky, because many contrast reagents cause the embryos to shrink. Some of the contrast agents that do not seem to cause shrinkage such as CystoConray contrast the embryos so strongly that only the exterior surface is visible, but any interior detail is lost. Iodine, either in the form of Lugol’s solution (iodine and IKI in H20) or iodine in alcohol are perhaps the two most common contrast agents for embryo work and can provide excellent tissue resolutions (Gignac et al., 2016). However, they can both cause shrinkage of soft tissues (Vickerton et al., 2013). Fixation of embryos in the PaxGene fixative and introduction of 1% iodine metal into the storage solution seems to limit the iodine induced shrinkage while still generating clear tissue level absorption of iodine (Figure 4). The PaxGene method appears to limit the shrinkage induced due to iodine contrast. Other methods to reduce iodine shrinkage have required embedding the samples in a hydrogel, which is an expensive and time consuming process (Wong et al., 2013).
In summary, we present a new method for CT scanning of embryos that has several key advantages over previous methods. First, this method limits the shrinkage induced due to iodine contrast. The second, and most important, is the ability to extract high quality RNA following a CT scan. The ability to generate both a 3D surface and also to be able to identify changes in gene expression in the same embryo at the same time will allow the understanding of individual level changes. Use of this method will increase our understanding of the developmental origins of subtle phenotypic changes and variable birth defects. It will be possible to separate groups of embryos based on small, early phenotypic changes and understand how gene expression is altered between groups. This approach presents a fundamental shift in the analysis of partially penetrant phenotypes by facilitating the direct study of variability among individual embryos and the ability to relate variation in phenotype with gene expression outcomes. Based on the specifications of the PaxGene system, this method should be extendable to preparation of protein for western blot applications. Further, it should be possible to embed the embryos following CT scanning. The embedded tissue should then be usable for in situ hybridization, immunofluorescence or histology. The versatility of this protocol should make it of primary utility to the developmental biology community.
Acknowledgments
The authors would like to acknowledge the funding sources for this study. NIH NIDCR R01 to BH and RSM DE019638, NIH NIDCR R01 DE021708 to BH and RSM, NSERC 238992-12 to BH, Alberta Children’s Hospital Research Institute Fellowship to RMG, NSERC Undergraduate Student Award to CLL.
References
- Adams DC, Otárola Castillo E. geomorph: an R package for the collection and analysis of geometric morphometric shape data. Methods Ecol Evol. 2013;4:393–399. doi: 10.1111/2041-210X.12035. [DOI] [Google Scholar]
- Boyde A, Wood C. Preparation of animal tissues for surface-scanning electron microscopy. J Microsc. 1969;90:221–249. doi: 10.1111/j.1365-2818.1969.tb00709.x. [DOI] [PubMed] [Google Scholar]
- Dickinson ME. Multimodal imaging of mouse development: Tools for the postgenomic era. Dev Dyn. 2006;235:2386–2400. doi: 10.1002/dvdy.20889. [DOI] [PubMed] [Google Scholar]
- Gignac PM, Kley NJ, Clarke JA, Colbert MW, Morhardt AC, Cerio D, Cost IN, Cox PG, Daza JD, Early CM, Echols MS, Henkelman RM, Herdina AN, Holliday CM, Li Z, Mahlow K, Merchant S, Müller J, Orsbon CP, Paluh DJ, Thies ML, Tsai HP, Witmer LM. Diffusible iodine-based contrast-enhanced computed tomography (diceCT): an emerging tool for rapid, high-resolution, 3-D imaging of metazoan soft tissues. J Anat. 2016;228:889–909. doi: 10.1111/joa.12449. [DOI] [PMC free article] [PubMed] [Google Scholar]
- Green RM, Feng W, Phang T, Fish JL, Li H, Spritz RA, Marcucio RS, Hooper J, Jamniczky H, Hallgrímsson B, Williams T. Tfap2a-dependent changes in mouse facial morphology result in clefting that can be ameliorated by a reduction in Fgf8 gene dosage. Dis Model Mech. 2015;8:31–43. doi: 10.1242/dmm.017616. [DOI] [PMC free article] [PubMed] [Google Scholar]
- Hall BK. Evolutionary Developmental Biology. Springer Science & Business Media; 1999. [Google Scholar]
- Kristensen E, Parsons TE, Hallgrímsson B, Boyd SK. A novel 3-D image-based morphological method for phenotypic analysis. IEEE Trans Biomed Eng. 2008;55:2826–2831. doi: 10.1109/TBME.2008.923106. [DOI] [PubMed] [Google Scholar]
- Metscher BD. MicroCT for comparative morphology: simple staining methods allow high-contrast 3D imaging of diverse non-mineralized animal tissues. BMC Physiol. 2009;9:11–14. doi: 10.1186/1472-6793-9-11. [DOI] [PMC free article] [PubMed] [Google Scholar]
- Parsons TE, Kristensen E, Hornung L, Diewert VM, Boyd SK, German RZ, Hallgrímsson B. Phenotypic variability and craniofacial dysmorphology: increased shape variance in a mouse model for cleft lip. J Anat. 2008;212:135–143. doi: 10.1111/j.1469-7580.2007.00845.x. [DOI] [PMC free article] [PubMed] [Google Scholar]
- Peddie CJ, Collinson LM. Exploring the third dimension: volume electron microscopy comes of age. Micron. 2014;61:9–19. doi: 10.1016/j.micron.2014.01.009. [DOI] [PubMed] [Google Scholar]
- Percival C, Green R, Marcucio R, Hallgrímsson B. Surface landmark quantification of embryonic mouse craniofacial morphogenesis. BMC Dev Biol. 2014;14:31. doi: 10.1186/1471-213X-14-31. [DOI] [PMC free article] [PubMed] [Google Scholar]
- R Development Core Team. R: A Language and Environment for Statistical Computing. Vienna, Austria: 2016. [Google Scholar]
- Schlager S. R package Morpho version 2.4.1.1. 2016. Calculations and Visualisations Related to Geometric Morphometrics. [Google Scholar]
- Schmidt EJ, Parsons TE, Jamniczky HA, Gitelman J, Trpkov C, Boughner JC, Logan CC, Sensen CW, Hallgrímsson B. Micro-computed tomography-based phenotypic approaches in embryology: procedural artifacts on assessments of embryonic craniofacial growth and development. BMC Dev Biol. 2010;10:18. doi: 10.1186/1471-213X-10-18. [DOI] [PMC free article] [PubMed] [Google Scholar]
- Sensen CW, Hallgrímsson B. Advanced Imaging in Biology and Medicine. Springer Science & Business Media; 2008. [Google Scholar]
- Smith FJ, Percival CJ, Young NM, Hu D, Schneider RA, Marcucio RS, Hallgrímsson B. Divergence of craniofacial developmental trajectories among avian embryos. Dev Dyn. 2015;244:1158–1167. doi: 10.1002/dvdy.24262. [DOI] [PMC free article] [PubMed] [Google Scholar]
- Vickerton P, Jarvis J, Jeffery N. Concentration-dependent specimen shrinkage in iodine-enhanced microCT. J Anat. 2013;223:185–193. doi: 10.1111/joa.12068. [DOI] [PMC free article] [PubMed] [Google Scholar]
- Wong MD, Dorr AE, Walls JR, Lerch JP, Henkelman RM. A novel 3D mouse embryo atlas based on micro-CT. Development. 2012;139:3248–3256. doi: 10.1242/dev.082016. [DOI] [PMC free article] [PubMed] [Google Scholar]
- Wong MD, Maezawa Y, Lerch JP, Henkelman RM. Automated pipeline for anatomical phenotyping of mouse embryos using micro-CT. Development. 2014;141:2533–2541. doi: 10.1242/dev.107722. [DOI] [PMC free article] [PubMed] [Google Scholar]
- Wong MD, Spring S, Henkelman RM. Structural Stabilization of Tissue for Embryo Phenotyping Using Micro-CT with Iodine Staining. PLoS ONE. 2013;8:e84321. doi: 10.1371/journal.pone.0084321. [DOI] [PMC free article] [PubMed] [Google Scholar]
- Zelditch ML, Swiderski DL, Sheets HD. Geometric Morphometrics for Biologists. 1. Elsevier Academic Press; San Diego: 2012. [Google Scholar]


