Abstract
The function of the heart valve interstitial cells (VICs) is intimately connected to heart valve tissue remodeling and repair, as well as the onset and progression of valvular pathological processes. There is yet only very limited knowledge and extant models for the complex three-dimensional VIC internal stress-bearing structures, the associated cell-level biomechanical behaviors, and how they change under varying activation levels. Importantly, VICs are known to exist and function within the highly dynamic valve tissue environment, including very high physiological loading rates. Yet we have no knowledge on how these factors affect VIC function. To this end, we extended our previous VIC computational continuum mechanics model (Sakamoto, et al., 2016, “On Intrinsic Stress Fiber Contractile Forces in Semilunar Heart Valve Interstitial Cells Using a Continuum Mixture Model,” J. Mech. Behav. Biomed. Mater., 54(244–258)). to incorporate realistic stress-fiber geometries, force-length relations (Hill model for active contraction), explicit α-smooth muscle actin (α-SMA) and F-actin expression levels, and strain rate. Novel micro-indentation measurements were then performed using cytochalasin D (CytoD), variable KCl molar concentrations, both alone and with transforming growth factor β1 (TGF-β1) (which emulates certain valvular pathological processes) to explore how α-SMA and F-actin expression levels influenced stress fiber responses under quasi-static and physiological loading rates. Simulation results indicated that both F-actin and α-SMA contributed substantially to stress fiber force generation, with the highest activation state (90 mM KCL + TGF-β1) inducing the largest α-SMA levels and associated force generation. Validation was performed by comparisons to traction force microscopy studies, which showed very good agreement. Interestingly, only in the highest activation state was strain rate sensitivity observed, which was captured successfully in the simulations. These unique findings demonstrated that only VICs with high levels of αSMA expression exhibited significant viscoelastic effects. Implications of this study include greater insight into the functional role of α-SMA and F-actin in VIC stress fiber function, and the potential for strain rate-dependent effects in pathological states where high levels of α-SMA occur, which appear to be unique to the valvular cellular in vivo microenvironment.
1. Introduction
Heart valves ensure unidirectional blood flow within the heart and undergo 40 × 106 cardiac cycles per year, totaling to at least 3 × 10⁹ times over an average lifetime [1]. Within all heart valve tissues are a resident population of valve interstitial cells (VIC) that play the essential role in tissue maintenance, with VIC dysfunction implicated as the underlying cause of many heart valve diseases [1,2]. VICs are myofibroblasts in that they have characteristics of both fibroblasts and smooth-muscle cells, with contractile activities mediated by stress fibers with high α-smooth muscle actin (α-SMA) content. VICs are activated by mechanical stimuli during tissue repair, development, and remodeling [3]. They are known to revert to an inactivated state [1,4] or are removed by apoptosis [5] when there is a return to homeostasis.
Interestingly, VICs appear to be quite sensitive to their surrounding microenvironment; excessive and persistent environmental changes will cause the improper regulation of VICs [2] that is linked to various pathological processes. These processes include increased expression and release of profibrotic factors such as transforming growth factor β1 (TGF-β1) and upregulation of matrix metalloproteinases (MMPs), which leads to extracellular matrix (ECM) degradation [6]. in vitro, cyclic tensile strain induced the activation of the mitral VIC, with the degree of activation levels correlated with the peak strain [7]. It has been speculated that once VICs initiate maladaptive tissue remodeling, enhanced mechanotransductive signaling due to the remodeling of the tissue itself causes a positive feedback loop and ultimately heart valve failure [6]. Yet, it is not well understood that how the VICs and surrounding tissues interact, especially in the highly dynamic valvular environment which includes extraordinarily high strain rates [2,8].
In recent years, whole-cell VIC mechanical properties have been studied using various experimental techniques, such as micropipette aspiration (MA) [9–11], collagen-gel contraction [12], and atomic force microscopy (AFM) [13]. These studies have indicated that higher expression levels of α-SMA are closely correlated with VIC increased stiffness and collagen biosynthesis. Related studies of fibroblasts and myofibroblasts have also shown that the incorporation of α-SMA into stress fibers enhances the stiffness and contractility of these cells [14–19]. However, these studies only measured the VIC total “effective” stiffness using linear elastic models under static, steady-state conditions. The time-dependent, viscoelastic properties of the VICs have been studied previously by Merryman et al. using micropipette aspiration [10]. However, VICs were treated as a homogenized standard linear solid material, with the VIC internal structure ignored. Due to the nature of experimental methodology, VICs were suspended in fluid, inactivating the VIC stress fiber structure. Moreover, it is well known that valvular tissues, and thus the imbedded VIC population, are subjected to very high strain rates in vivo [8]. Yet, there exist no studies known to the authors that investigate VIC strain rate sensitivity in either normal or pathological states. It thus remains an open question whether the high loading rates valve cells undergo in vivo affects their biosynthetic activities in health or disease, or that they are simply “along for the ride.”
Advanced bio-chemo-mechanical models of nonmotile mechanocytes, such as fibroblasts, chondrocytes, smooth muscle cells, have been developed to understand their internal structures. Deshpande et al. [20] developed the general bio-chemo-mechanical model framework and simulated the development of stress fibers, contractile behaviors, formation of adhesion complexes, and mechanical responses to external stimuli for various types of cells such as smooth muscle cells, fibroblasts, mesenchymal stem cells [21], chondrocytes [22], and osteoblast [23]. In particular, using their bio-chemo-mechanical model, they analyzed the time-dependent mechanical response of a spread human endothelial cell under micropipette aspiration experiment [24]. They observed creeplike increase of an aspiration length under constant pressure over ∼300 s, where significantly lower steady-state length was observed for untreated contractile cells compared to cells in which actin polymerization was chemically inhibited by cytochalasin D (CytoD). They showed that incorporates stress fiber remodeling and contractility must be used in order to accurately simulate micropipette aspiration of a contractile endothelial cell. Farsad and Vernerey also developed a similar model using mixture theory, with stress fibers with strain and strain rate-dependent contraction, remodeling of the stress fibers with actin monomer transfer within a fluid cytosol, and adhesion complex formation [25]. They simulated the contraction of a fibroblast on a flat substrate and reproduced the cell and stress fiber morphologies very similar to the one observed in experiments.
These studies provide insight on how these mechanocytes respond to external stimuli in long term, from 10 s to 100 s. However, in order to capture the unique VIC contractile behaviors, especially in rapid loading condition, we need to develop a comprehensive VIC-specific mechanical model compatible with available experimental data. Thus, it is necessary to develop a computational model of a VIC capable of capturing the effects of different subcellular structures with more refined experimental methodology that mimic the native environment of VICs. We previously developed a novel mathematical model of a VIC that modeled different mechanical structures of the VICs such as basal cytoskeleton, oriented stress fibers with passive elastic response and active contractile response, and nucleus [26]. We determined that the stress fibers within VICs indeed exhibited significantly stronger intrinsic contractile force than the ones in PVICs by a ratio of about 9:1, suggesting intrinsic differences between these two VIC types at the subcellular component level. However, in our first study, neither the stress fiber length-tension relationship [27] nor the three-dimensional (3D) stress geometry were considered. The model only considered the expression levels of α-SMA, although stress fibers are composed of actin bundles cross-linked by α-actinin with double-headed myosin II motor protein [28].
In the present study, we thus sought to substantially extend our VIC model to specifically gain insight into how F-actin and α-SMA coordinate to modulate VIC cell-level biomechanical function under both quasi-static and physiological loading rates. Specifically, our objectives were to: (1) develop an improved VIC computational model by incorporating a more realistic stress fiber model, inspired by recent development in computational cell mechanics [20,29] and micromechanical experimental observations [20,29], and (2) to derive the insight in how the stress fibers in the VICs respond to different activation states and loading rates. We developed an improved computational model of a VIC that incorporated the passive elastic, active contractile (using an explicit force-length relation), and viscous resistance responses of the stress fibers. We then integrated novel data from microindentation force–displacement, stress fiber orientation, and α-SMA and F-actin expression level studies for different activation levels. Simulations of the quantified mechanical responses under different activation levels and loading rates provided us with unique insight on how α-SMA and F-actin expression levels influenced stress fiber passive elastic, active contractile, and viscous responses.
2. Materials and Methods
2.1. Experimental Methods.
Experimental groups. The experimental design focused on modifying VIC activation states biochemically to alter the biomechanical state of the stress fibers. We chose the following five experimental conditions: cytochalasin D pretreated group (CytoD), control groups with 5 mM and 90 mM KCl treatments (C5 and C90 groups, respectively), and Transforming growth factor-beta1 (TGF-β1) pretreated groups with 5 mM and 90 mM KCl treatments (T5 and T90 groups, respectively). The details of each group are provided in the following:
-
(1)
CytoD group. Cytochalasin D is a potent inhibitor of actin polymerization. By disassembling the actin network of the VICs, microindentation can be used to measure the baseline global stiffness of the nucleus and cytoplasm and serve as a negative control throughout the study. The resulting stiffness is hypothesized to be similar to that which has been measured using micropipette aspiration in previous studies (0.45 kPa) [9].
-
(2)
C5 and C90 groups. Testing in 5 mM KCl mimics a normal physiological environment, creating a passive stiffness in the VIC cytoskeleton. Addition of 90 mM KCl during microindentation testing initiates active contraction within the VIC cytoskeleton and mimics a hypertensive physiological condition. VICs cultured in standard low serum (LS) media also served as a second negative control for the TGF-β1 treated VICs in the following.
-
(3)
T5 and T90 groups. TGF-β1 is a prolific growth factor and has been shown to initiate calcification in vitro and accelerate valvular stenosis in vivo [30,31]. Immunohistochemical studies revealed the presence of high levels of TGF-β1 in calcified human aortic valves when compared to noncalcified [32]. It has been shown to mediate differentiation of VICs into active myofibroblasts in vitro, determined by a significant increase in α-SMA, a gold standard marker for identifying myofibroblasts, and augmentation of stress fiber formation and alignment, and increases VIC contractility [33]. Testing in 5 mM KCl represents a normal physiological environment, enabling the measurement of VIC biomechanical properties in myofibroblastlike VICs under normal state, and the addition of 90 mM KCl will allow the measurement in myofibroblastlike VICs under hyperactive state.
VIC pretreatment cell culture: Altering expression levels of α-SMA and F-actins. Glass bottom culture dishes (MatTek, Ashland, MA) were coated with collagen type 1 (BD Biosciences, San Jose, CA) in 0.02 N acetic acid at a concentration of 10 μg/mL. The solubilized collagen solution was incubated on the glass for 1 h at 37 °C. Excess solution was aspirated and coated dishes were left to dry under UV overnight and then rinsed with PBS. Aortic valve VICs were generously provided by Dr. Ferrari's group at University of Pennsylvania, where the isolation of VICs was performed using a modification of the method described by Branchetti et al. [34]. Primary VICs were thawed and cultured in Dulbecco's modified eagle medium (DMEM) with high glucose and 10% fetal bovine serum) at 37 °C and 5% CO2 until reaching 80% confluence in monolayer. VICs (P2–P4) were lifted from tissue culture-treated flasks and seeded on the collagen-coated coverslips at a concentration of 7000/cm2 and cultured in Dulbecco's modified eagle medium (DMEM) with high glucose and low-serum (LS) medium (1% FBS supplemented). VICs were treated for a period of 5 days with additional TGF-β1 (5 ng/mL) (Sigma-Aldrich, St. Louis, MO) and control cells were cultured in plain media (all conditions were LS). Cultures were replenished with TGF-β1 and fresh media every 48 h.
Microindentation studies. An atomic force microscope (MFP-3D, Asylum Research, Santa Barbara, CA) with cantilevers with a borosilicate glass sphere (5 μm diameter, Novascan Technologies, Ames, IA) was used for all testing (Fig. 1, top). The cantilever spring constant (typically 0.027 N/m) was determined from the spectral density of the thermal noise fluctuation prior to testing. Microindentation testing started by having the cantilever probe positioned over each VIC nuclei to maintain consistency of measurements due to varying cell shapes. Each VIC was indented at a constant velocity of either 2.0 μm/s (slow indentation) or 12.0 μm/s (fast indentation) until a trigger force (2.5 nN) was reached. At that point the cantilever stopped and immediately retracted at the same velocity as the approach. The resulting force throughout the indentation protocol as well as the indenter position was recorded. In order to calculate the actual indentation depth from the indenter position, the indenter-cell contact point was determined by method based on Guo and Akhremitchev [35]. The indenter position at which the force started rising was identified by fitting the modified Hertz model [36] to the indenter position versus force curve.
Fig. 1.
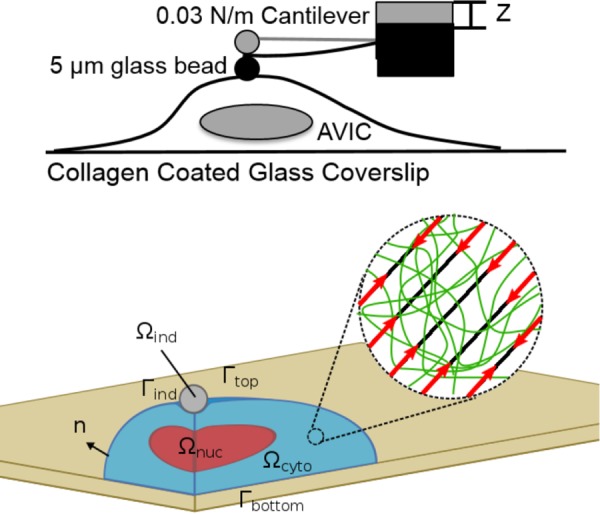
(Top) Schematic of the microindentation experimental configuration. (Bottom) the VIC model computational domains, which consisted of three subdomains, Ωcyto, Ωnuc, and Ωind, representing the cytoplasm, nucleus, and rigid spherical indenter, respectively. The cytoplasm was considered as a solid mixture of basal cytoplasm (green network in the inset) and oriented stress fibers (black oriented lines in the inset). The basal cytoplasm was modeled as a nearly incompressible neo-Hookean material. The stress fibers were modeled as the ensemble of oriented fibers with passive elastic and active contractile responses with their orientation described by a continuum orientation distribution function. The substrate was not explicitly modeled as the no-slip boundary condition was prescribed on Γbottom. The contact between the indenter and VIC was modeled by no-penetration, no-slip contact boundary condition.
After 5 days of incubation, the TGF-β1 and nontreated VICs were first tested under normal physiological levels of 5 mM KCl at 37 °C. The same VICs were then incubated at 37 °C for 10 min in hypertensive levels of KCl (90 mM) and retested. Finally, the same VICs were treated with 20 μM cytochalasin-D (Sigma-Aldrich, St. Louis, MO) for 10 min at 37 °C to cause complete depolymerization of the actin network and tested using microindentation a third time. To ensure CytoD concentration and incubation time was effective, samples were given CytoD supplemented with 90 mM KCl and measured using microindentation. There was no measured increase in stiffness between the 5 mM and 90 mM controls when delivered with CytoD (data not shown). Immediately after the indentation on a VIC, the substrate very next to the VIC was indented to determine the cell height from the difference in the contact points.
Fluorescent microscopy. Immediately following microindentation measurements, VICs were washed twice with PBS to remove excess media and then fixed in 4% paraformaldehyde (Electron Microscopy Sciences, Hatfield, PA) in PBS for 15 min. Following fixation, VICs were permeabilized using 0.1% Triton-X-100/PBS and nonspecific binding was blocked using 1% BSA for 30 min. VICs were incubated for 1 h with α-SMA monoclonal antibody (1:125, mouse antiporcine, ThermoFisher Scientific, Waltham, MA). The primary antibody was removed through PBS washes and VICs were incubated with a fluorescein isothiocyanate conjugated secondary antibody (1:125 goat antimouse, Millipore) and tetramethylrhodamine-conjugated Phalloidin (1:100, Millipore, Billerica, MA) to stain for filamentous actin (F-actin). VIC nuclei were counterstained with 4'6-diamidino-2-phenylindole (Life Technologies, Carlsbad, CA) for 5 min prior to mounting with ProLong Diamond Antifade mountant (ThermoFisher Scientific). Note that F-actin exists in the stress fibers [28] while α-SMA can exist inside the cytoplasm or within the stress fibers, collocalized with F-actin [15].
Fluorescent images were taken from each of the five experimental groups. A minimum of ten images was taken from each group (20 × objective, tetramethylrhodamine fluorescein isothiocyanate, 4'6-diamidino-2-phenylindole filters) with a fluorescent microscope (Zeiss Axiovert 200 M, Zeiss, Germany). Exposure time remained constant to allow for a relative quantitative analysis between groups. The average signal intensities of F-actin within VICs were determined from the florescent images using in-house Python script. The florescent images of the F-actin and α-SMA of the same VICs were overlaid to determine the collocalization of α-SMA with F-actin. Then, using the same Python script, the average signal intensities of α-SMA collocalized with F-actin were determined.
Confocal microscopy. Z-stacks were taken from all five experimental groups (minimum five cells each) using confocal microscopy to determine the appropriate VIC and nucleus geometries and stress fiber orientations for each activation state (Zeiss LSM 710, Zeiss, Germany). The length and width of each VIC were measured visually from the confocal images. The VICs on a flat substrate typically exhibited elongated morphology. Thus, we defined the length as a distance between cell tips in the elongated direction, and width as a maximum distance between cell edges in the direction parallel to the length direction. The nucleus within the VICs also exhibited an ellipsoidal morphology. Using the same length and width directions, we measured the length and width of the nucleus. We also measured the height of the nucleus from the cross section image produced by z-stacks. Stress fiber orientation was measured using top-view images, with F-actin visualized by florescence as previously described. We used the directionality plug-in of Fiji image processing package [37] to extract the orientation histogram for each VIC. Then, we set the preferred direction of the fibers to 0 deg, which corresponded to the VIC elongation direction. We averaged the orientation histogram from each VIC within the same experimental groups and used the constrained von-Mises distribution to fit these average histograms (described below).
2.2. VIC Computational Model.
In our initial VIC computational model [26], we incorporated the different subcellular components of VICs such as basal cytoskeleton, stress fibers with passive elastic and active contractile responses, and nucleus. Herein, we extend this model by explicitly incorporating the F-actin and a-SMA expression levels, stress fiber orientation, strain rate sensitivity, and fiber length–tension relations within the geometry of the microindentation experiment. It should be noted that we only consider changes in between states, and not the processes involved during state changes. Moreover, VICs are also assumed to be in quasi-static equilibrium in each state and also during the indentation test so that the indentation test does not affect the cell state. This latter assumption is supported by the very small displacements relative to the VIC dimensions.
VIC domains and boundaries. We simulated a representative VIC as being placed on a flat substrate with two subdomains Ωcyto and Ωnuc that represent the cytoplasm and nucleus, respectively (Fig. 1, bottom). The spherical indenter was considered as a rigid body with domain Ωind. We prescribed the no-slip boundary condition on the bottom of the VIC assuming that VICs developed strong adhesion with the substrate [38] as the VICs were cultured on thin-layered collagen substrates on a glass. Thus, the substrate was not explicitly modeled. A sliding frictionless contact boundary condition was applied between the top boundary of the VIC and the rigid indenter, assuming that the VICs do not produce any adhesion with the indenter because the indenter only touched the VICs for less than a second. The cytoplasm and nucleus were assumed tightly connected so that there is no displacement between their interfaces. We prescribed the zero displacement and zero residual stress as the initial conditions. In addition, we prescribed the stress fiber orientation distribution function (ODF) measured from experimental data to specify the initial fiber orientation.
Model components. The cytoplasm was considered as a solid mixture of two components, the basal cytoplasm (represented by superscript “cyto”) and the stress fibers (represented by superscript “sf”). The basal cytoplasm includes all major VIC components (tubulin, intermediate filaments, cytosol, and other organelles) except the stress fibers. The basal cytoplasm was modeled collectively as an isotropic, nearly incompressible neo-Hookean solid. Geometrically, the stress fibers were considered as homogenized in that the fiber orientations were represented by a local, continuous orientation distribution function (ODF). Stress fibers were further assumed to generate tension from the following three mechanisms: (1) passive elastic response, (2) active contractile response, and (3) strain rate-dependent viscous response. Finally, the basal cytoplasm and stress fibers were assumed tightly connected so that their displacements are equal with no momentum exchange.
Assuming that there are no inertial or body forces, the conservation of linear momentum equation states
| (1) |
where T is the Cauchy stress, is the divergence operator with respect to the current configuration, and Ωt represents the current domain of the VIC at time t. Within the cytoplasm Ωcyto, the total Cauchy stress T was decomposed into the following two parts:
| (2) |
where Tcyto and Tsf are the Cauchy stresses within the basal cytoplasm and stress fibers. The basal cytoplasm was modeled as a nearly incompressible neo-Hookean material with shear modulus μcyto and bulk modulus K
| (3) |
Here, F is the deformation gradient tensor, C is the right Cauchy–Green deformation tensor, J is the determinant of the deformation gradient tensor, and is the first invariant of the deviatoric part of the right Cauchy–Green tensor. We used 5 Pa for μcyto as determined from in our previous study [26]. Likewise, for the nucleus Ωnuc, the total Cauchy stress T was defined using the nearly incompressible neo-Hookean material model with the same equations as Eq. (3) with the shear modulus μnuc of 15 kPa.
Stress fiber ODF. Stress fibers were modeled as an ensemble of oriented fibers with their orientation described by a 2D orientation distribution function Γ. We utilized stress fiber visualized by staining F-actin to quantify the 2D images of the stress fiber orientations. Here, we used a constrained von-Mises distribution for the ODF [39], which is a weighed mixture of semicircular uniform distribution and semicircular von-Mises distribution
| (4) |
where m0 is the direction of a fiber along θ, θp is the preferred direction of the fiber population, kf is the fiber concentration factor, and I0 and I1 are the modified Bessel function of the first kind with order 0 and 1, respectively.
In order to extend this 2D distribution to describe the actual 3D stress fibers, we needed to define the local plane on which the 2D distribution lies. On the top VIC surface, the plane normal corresponded to the surface normal of the VIC. On the bottom surface, we defined “adhesion regions,” which span from the cell top to the 1/3 of the ellipsoid radius toward the center (Fig. 2). In the adhesion regions, the plane normal was assumed 45 deg from the bottom surface, which was the angle the stress fibers exert maximum 2D traction force on the substrates. In the nonadhesion regions, the plane normal on the bottom surface corresponded to the surface normal of the top surface directly above. Once we defined the plane normal for top and bottom surfaces, we linearly interpolated the normal inside the cell in z-direction. In addition, we defined that the x-direction is the preferred direction of the stress fiber orientation (θp) as visualized in (Fig. 2). Thus, θp is zero when the fibers are oriented in x-direction. This produced a 3D orientation system that agreed with experimental observations.
Fig. 2.
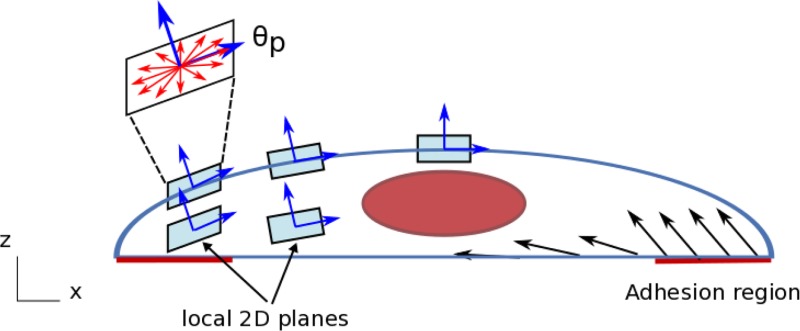
Three-dimensional orientation of the stress fibers and specification of adhesion regions. The stress fiber orientation distribution functions were defined on local 2D planes, whose normal vector depends on the position within the VIC. On the top surface, the plane normal corresponds to the surface normal of the VIC (without y-component). On the bottom surface, we defined adhesion regions, which span from the cell tip to the 1/6 of the cell length toward the center. In the adhesion regions, the plane normal is defined 45 deg from the bottom surface. In the nonadhesion region, the plane normal corresponds to the surface normal of the ellipsoid directly above (without y-component). Once we defined the plane normal for top and bottom surfaces, we calculated the plane normal inside the VIC by linearly interpolating the top and bottom normal vectors. Thus, moving from the bottom to top surfaces of the VIC, the plane normal transitions smoothly. The preferred orientation of the fibers (θp) corresponds to the x-direction.
The stress fiber model. Based on the above modeling considerations, the total stress fiber Cauchy stress was modeled using
| (5) |
where the integration is performed over ; m0 = m0(θ) specifies the initial direction of the fibers; and Tp, Ta, and Tv represent the 1D passive, active, and viscous fiber stresses in direction m0, respectively. Note that the integration was performed on the local plane on which the ODF is defined (Fig. 2). A Heaviside step function H was introduced to enforce that the passive stress arises only from fiber stretch, and I4 is the square of the fiber stretch along initial direction m0
| (6) |
The function Γ(m0) in Eq. (5) represents the referential orientation distribution function (ODF) of the fibers with respect to the direction m0. Note that Γ was defined on the local plane, which depends on the location within the VIC (Fig. 2).
The passive elastic response of the stress fibers was modeled by assuming that each stress fiber was as a 1D elastic rod
| (7) |
where μsf is the shear modulus of the stress fiber and is the expression level of the F-actin in the VIC. We assumed that 1D passive stress of the stress fibers should be proportional to the intrinsic shear modulus of the fiber (μsf) and the amount of the stress fibers ().
Next, we represented the stress fiber active contractile tension level (Ta in Eq. (5)) as a product of two components, the maximum contractile strength and length-tension relationship. As far as we know, there are currently no studies that describe how the stress fiber tension varies over different stretch level within a living cell. However, the classical muscle fiber length–tension relationship indicates that the stress fiber contraction peaks at some stretch level and decreases as the fibers lengthen or shorten [27]. We thus assumed that the stress fibers within the VICs follow this relationship. In addition, previous studies on contractile myofibroblasts indicated that incorporation of α-SMA into stress fibers enhanced their contractility [40]. Assuming that there exists a basal contractility associated with F-actin without α-SMA due to actomyosin motor activities, we modeled that maximum contractile strength depends on the expression levels of both F-actin and α-SMA, and that the shape of the length–tension relationship curve is scaled by the maximum contractile strength. We further modeled the maximum contractile strength f0, as the linear combination of the F-actin and α-SMA expression levels, based on the following observations and assumptions:
-
(1)
F-actin is the main component of the stress fibers. Thus, the F-actin expression level represents the amount of stress fibers within the cell. Assuming that each actin building block of the stress fibers contracts in the same manner, the higher the F-actin expression level, the stronger the VIC contracts.
-
(2)
A number of studies reported that the incorporation of α-SMA into the stress fibers enhanced the contractility of the myofibroblasts or fibroblasts [41–44], and the correlation between the α-SMA expression to the contraction strength seems linear [18].
Based on these assumptions, the stress fiber active contractile tension was defined as
| (8) |
where f0 represents the maximum contractile strength, which depends on the expression levels of F-actin and α-SMA ( and , respectively), and fl represents the length–tension relationship, which only depends on the stretch (λ). Our maximum contraction model is thus
| (9) |
Here, we introduced two constants, fF-actin and fα-SMA, which represent the contraction strength of the stress fibers per unit expression level of F-actin and α-SMA, respectively. These values were assumed constant over VICs for different activation states.
For the length–tension relationship model, we used the following length–tension relationship model, inspired by Vernerey and Farsad [29], is
| (10) |
where ε is the fiber strain, ε* represents the strain level at which the maximum contraction occurs, and ε0 represents how fast the contractile strength decays about ε*. We confirmed that the choice of ε* had little effect on the simulation result as long as |ε*| < ε0. Thus, we assumed that the maximum contraction occurs at ε* = 0, and that the representative value of ε0 was 0.1, which produced the length–tension relationship similar to the original muscle fiber tension study by Vernerey and Farsad [25] and Edman [45].
We noted in pilot studies that the microindentation force versus depth's relationship to slow and fast indentation speeds appeared to be proportional to the α-SMA levels. We thus assumed that fiber viscous stress should be proportional to the intrinsic viscosity of the α-SMA (ηα-SMA) and the amount of stress-fiber α-SMA (). We thus modeled the viscous response of the stress fibers assuming a simple linear proportion to the strain rate
| (11) |
where is the strain rate, ηα-SMA is the viscous constant, and is the expression level of α-SMA in the VIC.
In summary, the complete VIC biomechanical constitutive model is given by
| (12) |
where the first, second, and third terms in integral represent the passive elastic, active contractile, and viscous responses of the stress fibers.
2.3. Numerical Solution and Simulation Configuration.
The system of partial differential equations presented above was solved using the open source finite-element package FEBio [46]. The fiber passive, active, viscous stress models were implemented as a plug-in extension to FEBio. In particular, the 1D strain rate of the fibers in Eq. (11) was discretized in time using backward Euler method. At each integration point, in order to integrate the stresses from every direction in Eq. (5), numerical integration was carried out with ∼200 different directions on the local plane where the ODF was defined. The indentation depth of the rigid indenter was prescribed over time, and the solutions were calculated at each time step. The convergence of the algorithm has been numerically observed against the finest mesh (“overkill”) solution. Specifically, we checked whether the reaction force from the VIC to the indenter converged to some value for different indentation depth and model parameters. About 50,000 linear tetrahedron (TET4) elements were used for the typical computations, where we observed the sufficiently accurate results. Mesh was refined around the indenter–VIC contact region (Fig. 3) to ensure solutions that are more accurate.
Fig. 3.
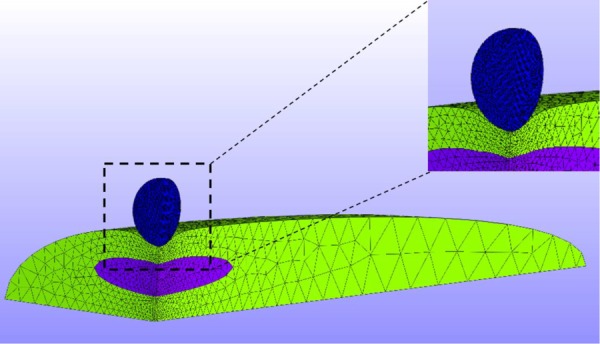
The actual simulation geometry and mesh. The simulation was carried out in the quarter-domain by utilizing symmetry. The mesh was refined around the indenter-VIC contact region.
The geometry used for the microindentation simulation was developed by idealizing the initial shape of the VIC as a half-ellipsoid and the shape of a nucleus as a full-ellipsoid with the actual simulation using a quarter domain via symmetry (Fig. 3). The length, width, and height of the VICs and nucleus used for the simulation were taken from the experimental measurements (see Sec. 3.1 and Table 1). The indenter was modeled as a rigid sphere with 5 μm diameter, and the average width, length, and height of the nucleus were obtained from confocal microscopy simulation consisting of two steps: (1) the VIC starts from the undeformed configuration and evolves to a fully contracted state, and (2) the indentation was applied. The reaction force to the indenter for each indentation depth was calculated.
Table 1.
VIC geometry quantification (average ± standard error in μm)
| Group | L | W | H |
|---|---|---|---|
| CytoD | 60.1 ± 5.2 | 20.8 ± 1.3 | 10.1 ± 0.4 |
| C5 | 111.9 ± 7.0 | 22.6 ± 0.9 | 6.9 ± 0.4 |
| C90 | 144.7 ± 9.2 | 28.2 ± 3.3 | 6.1 ± 0.1 |
| T5 | 91.5 ± 5.5 | 22.1 ± 1.8 | 6.9 ± 0.1 |
| T90 | 105.2 ± 6.2 | 28.5 ± 2.7 | 5.9 ± 0.2 |
| Nucleus | 20.1 ± 0.8 | 10.8 ± 0.71 | 2.71 ± 0.23 |
2.4. Parameter Estimation Strategy.
We estimated three parameters of our model: shear modulus of the stress fibers (μsf), contraction strength of the stress fibers (f0) for each group, and the viscous constant of α-SMA (ηα-SMA). We gathered the average indentation force versus depth curves for 5 different groups (CytoD, C5, C90, T5, and T90) for slow (2 μm/s) and fast (12 μm/s) indentations. For each parameter estimation step, from the indentation depth versus force relationship, we calibrated the model parameters using nonlinear least squares with the Levenberg–Marquardt algorithm. Because we did not have analytical form of the objective function, the numerical gradient was calculated for the optimization procedure with forward difference approximation.
As in our first study, we utilized a sequential approach to estimate to determine parameters (12). We used two parameter values from the previous study—basal cytoskeletal shear modulus (μcyto) and nucleus shear modulus (μnuc) [26]. We set μcyto and μnuc as 5 Pa and 15 kPa, respectively. The expression levels of α-SMA () and F-actin () as well as the stress fiber ODF (Γ) were measured from experiments. In summary, our parameter estimation strategy steps were as follows:
-
(1)
Determine μsf value from CytoD slow indentation data
-
(a)
Assume f0 = 0 and ηα-SMA = 0
-
(b)
Use μsf value obtained for the rest of steps
-
(a)
-
(2)
Determine f0 and and ηα-SMA values for the T90 group from slow and fast indentation data
-
(a)
Use ηα-SMA value obtained for the rest of steps
-
(a)
-
(3)
Determine f0 values for C5, C90, and T5 groups from slow and fast indentation data
-
(4)
Rerun the CytoD indentation simulation (step 1) for slow and fast speed with ηα-SMA obtained to ensure simulation results matched the experimental data.
3. Results
3.1. Cell and Nucleus Dimensions.
Generally, VICs flattened and elongated when activated by KCl and/or TGF-β, and underwent greater elongation when treated with 90 mM KCL (Table 1). In contrast, VICs exhibited increased heights when treated with CytoD. Since we only had a limited number of confocal images of the nucleus, coupled to the observation that the dimensions of nucleus were unaffected by the activation state, we only used the one dimensional measurement for the nucleus. The mean length, width, and height of the nucleus with standard errors are 20.1 ± 0.8 μm, 10.8 ± 0.71 μm, and 2.71 ± 0.23 μm, respectively (n = 27 each).
3.2. Fiber Expression Levels Quantification.
The resulting expression levels of F-actin and α-SMA within each VIC in different groups were normalized by CytoD group (Fig. 4). We found that the KCl treatment increased the expression levels of F-actin and α-SMA in a dose-dependent manner, with the C90 group having a higher expression level than C5 group, and T90 group having higher expression level than T5 group for both F-actin and αSMA. TGF-β1 influenced the expression levels in a similar manner. However, when TGF-β1 treatment and 90 mM KCl treatments were combined, no or little increase in the F-actin expression was observed (Fig. 4, left). Unlike F-actin, combination of TGF-β1 treatment and KCl 90 mM treatment significantly increased the expression level of α-SMA (Fig. 4, right).
Fig. 4.
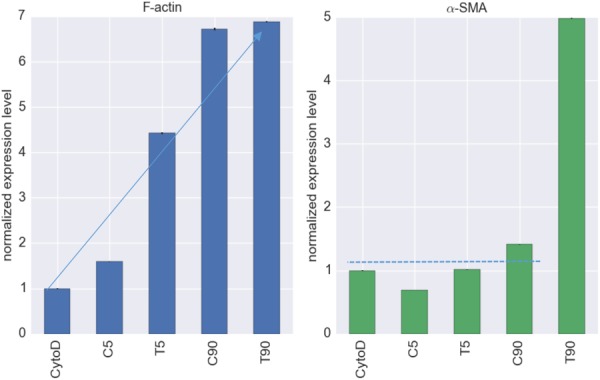
Normalized expression levels of F-actin (left) and α-SMA (right). The expression levels were normalized to the CytoD group. TGF-β and/or KCl treatments induced higher levels of F-actin, whereas only the T90 group exhibited an increase in α-SMA, but (∼5 fold).
3.3. Stress Fiber ODF Quantification.
The values of kf in Eq. (4) for different groups were determined using orientation histograms (Fig. 5). The kf value of the CytoD group was 1.59 while that of other groups was around 3.0 (Table 1). Thus, VICs in CytoD group had less directionality than other groups. We observed some remaining fiber structure even after CytoD treatment. The R2 values of the fit are mostly above 0.95 (Table 2), and the constrained von-Misses distribution qualitatively captured the stress fiber orientation distribution (Fig. 5).
Fig. 5.
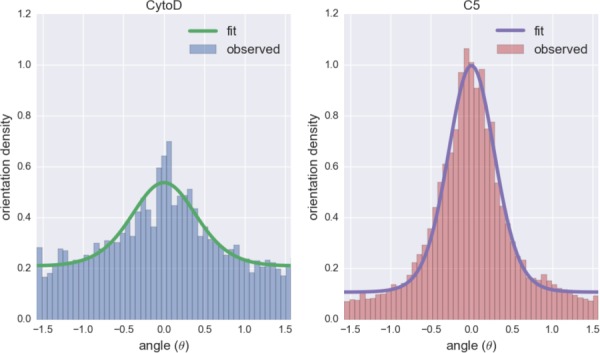
The stress fiber orientation histograms and corresponding fits of the constrained von-Mises distribution for CytoD (left) and C5 (right) groups. The angle θ = 0 represents the preferred direction of the fiber (θp).
Table 2.
Stress fiber ODF quantification
| Group | kf | n | r2 |
|---|---|---|---|
| CytoD | 1.59 | 18 | 0.97 |
| C5 | 3.22 | 17 | 0.99 |
| C90 | 3.07 | 11 | 0.97 |
| T5 | 3.00 | 12 | 0.88 |
| T90 | 2.95 | 28 | 0.99 |
3.4. Force-Depth Curves for Slow and Fast Loading Rates.
The C5, C90, and T5 groups exhibited no strain rate sensitivity under microindentation experiments (Fig. 6). Using the indentation depths at 2.2 nN indentation force, we calculated whether the difference in the indentation depths between slow and fast indentations was statistically significant. For C5, C90, and T5 groups, the p-values were above 0.5, indicating there were no statistically significant differences in the indentation depths. T90 group exhibited strain rate sensitivity with p < 0.01 (Fig. 7), where the VIC model successfully captured the strain rate sensitivity of T90 group. CytoD group exhibited some degree of strain rate sensitivity with p < 0.05, and the VIC model captured the strain rate sensitivity in reasonable range (Fig. 6). While the VIC model predicted that C5, C90, and T5 groups should exhibit strain rate sensitivity because of the presence of α-SMA, the effect is small compared to variations within the data that it was not captured by microindentation experiment.
Fig. 6.
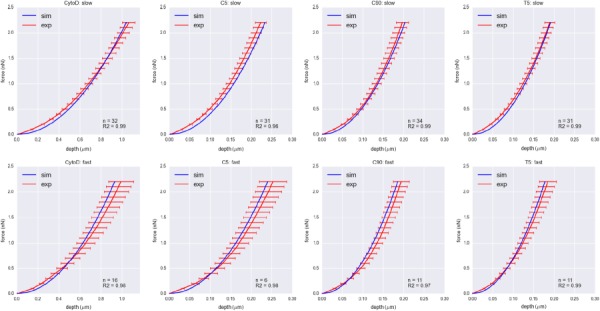
Indentation force versus depth curves for CytoD, C5, C90, and T5 groups for slow (2 μm/s) and fast (12 μm/s) indentation speeds. Red curves represent the indentation depth averaged over the same force with error bars representing one standard error. Blue curves represent the indentation depth versus force obtained from the simulations with best fit parameters. None of these groups exhibited strain rate sensitivity.
Fig. 7.

Indentation force versus depth curves for T90 group for slow (left, 2 μm/s) and fast (center, 12 μm/s) indentation speeds. Red curves represent the indentation depth averaged over the same force with error bars representing one standard error. Blue curves represent the indentation depth versus force obtained from the simulations with best fit parameters. Only T90 group exhibited significant strain rate sensitivity, which was captured by our model, as more easily in the model results (right).
3.5. Final Parameters Set.
We estimated three key parameters from microindentation data: shear modulus of the stress fibers (μsf), contraction strength of the stress fibers (f0) for each group, and the viscous constant of α-SMA (ηα-SMA). Using the shear modulus of the stress fibers (μsf), we calculated the total shear modulus of the fibers (), and using the viscous constant of α-SMA (ηα-SMA), we calculated the total viscosity of the stress fibers () for each group (Fig. 8). It is clear that the more the VIC was activated, the stronger it contracted. The large value in T90 group clearly indicated the source of strain rate sensitivity in T90 group. CytoD, C5, C90, and T5 groups exhibited no observable strain-rate sensitivity.
Fig. 8.
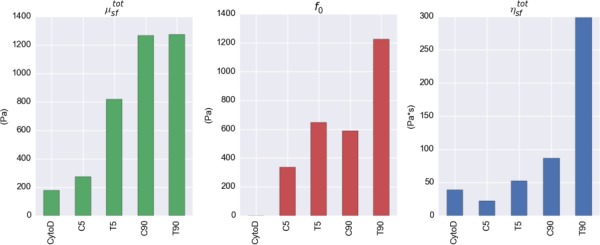
Total shear modulus of the stress fibers (), contraction strength of the stress fibers (f0), and total viscosity of the stress fibers () obtained from the parameter estimations. The expression levels of α-SMA contribute significantly to the contraction strength (f0) as well as strain sensitivity () of the stress fibers within VICs.
3.6. Quantification of fF-actin and fα-SMA Values.
Using the maximum contraction strength (f0) and the expression levels of F-actin and α-SMA for each group, we derived the contribution of the F-actin and α-SMA to the contraction strength of the stress fibers. The data from these four groups combined with Eq. (9) yielded the four linear equations with two unknowns. Thus, we used multilinear regression to estimate the values of fF-actin and fα-SMA, which were 76.7 Pa and 96.8 Pa, respectively, with r2 values of 0.7. The positive fα-SMA value means that the incorporation of α-SMA into the stress fibers indeed enhance the contraction of the stress fibers, as reported previously [18,41,42,44]. Once the values of fF-actin and fα-SMA were established, we calculated the contributions of the F-actin and α-SMA to the overall contractile strength using:
| (13) |
where the values for and values estimated and expression levels of F-actin () and α-SMA () in each group (Fig. 9). While the increase in F-actin expression levels explained the increase in the contraction strength of VICs for T5 and C90 groups from C5 group, incorporation of α-SMA into the stress fibers had clearly the dominant effect in T90 group (Fig. 9)
Fig. 9.
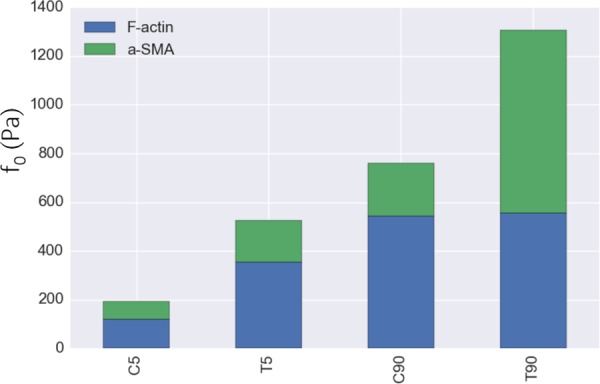
Computed contributions of the F-actin and α-SMA to the maximum contraction strength for each group. The stacked green/blue columns represent the estimated maximum contraction strength values (f0,estimated) calculated by fitting Eq. (13) to the f0 values. F-actin contributed to the contraction strength up to a certain point when the VICs were activated in T5 and C90 groups. However, almost all of the increase in contraction strength in T90 group to C90 group was due to α-SMA contribution.
3.7. Parametric Study—Effect of ε0: Contraction Length-Tension Parameter to f0 Values.
As stated above, we used ε0 = 0.1 for all simulations; yet the larger the value of ε0, the less sensitive (or more constant) the contraction strength gets for different stretch levels. We thus carried out a parametric study to investigate how ε0 values affect the f0 values, using values for ε0 ∈ [0.01, 0.1, 1.0, 10.0] (Fig. 10). Note that for extremely small values of ε0, the length–tension relationship became a “spike,” where the stress fiber generated tension in a very narrow range, and it made the simulation unstable due to discontinuity of the stress. Thus, we limited the value of ε0 to be equal or greater than 0.01. The results indicated that the maximum contraction strengths of the VICs (f0 values) estimated were relatively unaffected by the length–tension behavior of the stress fibers controlled by ε0 values. The trends stayed the same, and there were some increase in the estimated f0 values as ε0 value decreased, meaning that stress fibers only generated tension in a narrower range. Thus, in order to compensate the fact that the stress fibers can only generate tension in a narrow range, its maximum contraction strength needed to be larger. However, this effect was minimal.
Fig. 10.
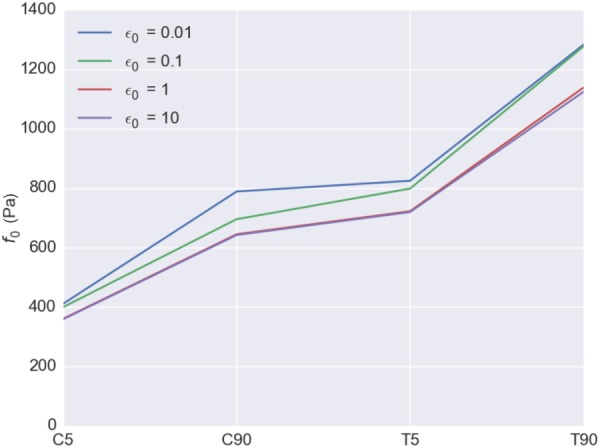
Parametric study: effect of the length-tension parameter values (ε0) to the estimated maximum contraction strength (f0) values. The ε0 values used were 0.01, 0.1, 1.0, and 10.0. Slight increase in the estimated f0 values was observed as ε0 value decrease. However, the f0 values are relatively unaffected by ε0 values.
4. Discussion
4.1. Primary Findings.
In this study, we investigated how the two major mechanical components of VIC stress fibers, F-actin and α-SMA, contributed to the VIC cell-level mechanical responses. We extended the existing VIC solid mixture model [26] by incorporating the length–tension relationship and contributions of the F-actin and α-SMA components of the stress fibers. Novel to this study and largely to the area of cell mechanics in general, we also incorporated a viscous term. By combining the experimental data of the VICs under different activation states and under different loading speeds, we investigated how the incorporation of α-SMA into the stress fibers contributed to the increase in the contraction strength as well as strain rate sensitivity. To the best of our knowledge, this is the first study to quantify how the different components of the stress fibers contribute to the overall contraction strength and strain rate sensitivity in a myofibroblast.
Previously, the intrinsic contractility of the stress fibers within VICs and PVICs was from our initial model that incorporated experimental data from micropipette aspiration and AFM studies [26]. However, how the different major components of the VIC stress fibers influenced the contractility was largely unknown. In the present study, we refined this approach by splitting the contraction responses into two parts: F-actin and α-SMA. We assumed that there existed a basal contractile force within F-actin bundles due to actomyosin motor activities, and incorporation of α-SMA into the stress fibers enhanced the contractility. The fact that α-SMA contribution is positive means that the addition of the α-SMA into stress fibers indeed enhanced its “intrinsic” contractility, or the contractility of the stress fibers per its unit volume. We demonstrated that the contribution of α-SMA to total contraction strength of the stress fibers was substantial (Fig. 9), which is consistent with the previous study of myofibroblasts [14–19]. In other words, the increase in F-actin content alone could not explain the increase in the contraction strength of the VICs in activated states.
In our previous study, we only used the α-SMA expression levels of the entire VICs [26], assuming that the VIC α-SMA expression levels were proportional to the expression levels of α-SMA within the stress fibers. While an initially useful approach, it is likely somewhat inaccurate as the α-SMA can dynamically associate and dissociate from the stress fibers [15,47]. Also, in our previous study, we considered the expression levels of α-SMA as the measure for the relative expression level of the stress fibers. Again, this is not the most accurate representation of the expression level of stress fibers because (i) stress fibers can exist without α-SMA content and (ii) α-SMA can exist outside of the stress fibers [15]. We also used the relative expression level of F-actin to represent the expression level of stress fibers. We believe that this approach is a more accurate representation, as stress fibers are merely contractile actin bundles cross-linked by α-actinin with double-headed myosin II motor protein [28].
It is notable that we utilized a length–tension relationship to the stress fiber contraction model based on the assumption that the contraction strength should be maximal at the undeformed state and diminish when the fiber lengthens or shortens. We speculated that this was more biophysically realistic. Yet, the length–tension relationship yielded little difference in the estimated maximum contraction value (f0), largely due to the fact that the current experimental data remains inadequate. Moreover, we derived the mechanical properties of the stress fibers from VIC's response to the indentation loading. Thus, in order to study the mechanical properties of individual fibers, one may need to use AFM nanoindentation to directly indent an individual fiber just beneath the cell membrane [35], extract an individual fiber and test its properties [48,49], or use laser nanoscissors to sever an individual fiber and study its recoil behavior [50]. Nevertheless, we included the length–tension relationship in our model because it can dominate the mechanical response of the VICs under certain conditions, especially within physiological environment, where rapid loading and unloading occurs during valve opening and closure.
4.2. Validation: Comparisons With Traction Force Microscopy.
As an additional means to validate our approach and better understand the interaction between the VIC and the substrate, we calculated the 2D tangential traction on the bottom of the VICs. Note that we used the tangential traction here because typically, TFM only measures the 2D traction. We used the VIC with f0 = 1200 Pa (similar contraction strength to T90 group) and visualized the traction field (Fig. 11). Clearly, the traction force was localized at the very edge of the VIC, near adhesion region (Fig. 2). The VIC pulled the substrate one-dimensionally in the length–direction toward the center. A very similar localization and direction of the traction force was observed in the TFM experiments on elongated fibroblasts [19,43,51,52].
Fig. 11.

Traction field on the bottom of the VIC with f0 = 1200 Pa calculated from the simulation. Tractions are concentrated around the adhesion region. The VIC pulls the substrate one-dimensionally toward the center.
4.3. Total Force Calculation.
In order to obtain additional insights into the overall computed contractility of the VIC, we calculated the total force that a VIC exerted on the substrates using the following equation:
| (14) |
where Tbottom is the 2D traction vector on the substrate and Γbottom is the boundary on the bottom of the VIC (Fig. 1), and Ftot represents the total cell contractile force. We determined Ftot at 0 nN (i.e., f0 = 0), 71.8 nN, 86.6 nN, 142.6 nN, and 158.5 nN for CytoD, C5, C90, T5, and T90 groups, respectively (Fig. 12). The treatment with TGF-β1 and 90 mM KCl increased the total force as expected, directly corresponding with the maximum contraction strength (f0) of the stress fibers (Fig. 8).
Fig. 12.
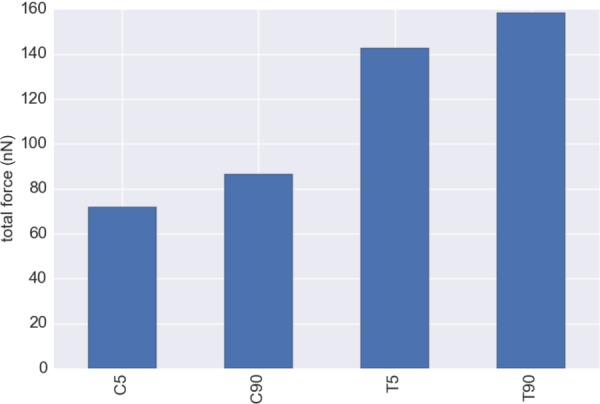
Total force exerted by a VIC calculated from the tangential traction on the bottom of the VIC by Eq. (14). The total forces are 71.8 nN, 86.6 nN, 142.6 nN, and 158.5 nN for C5, C90, T5, and T90 groups, respectively. Relative increase of the total force from the C5 to T5 group was ∼2.0 fold.
It is interesting to note that Cirka et al. [52] used Ftot to assess the contractility of AVICs on different activation states using traction force microscopy (TFM). TFM studies were carried out using AVICs by modulating the activation states using blebbistatin and TGF-β, with blebbistatin disrupting the stress fiber structure similar to CytoD. The total computed forces from TFM experiments were 41 ± 8.1 ± nN (n = 21), 519 ± 86.3 nN (n = 20), and 1130 ± 482.52 nN (n = 6), respectively, for blebbistatin treated, control, and TGF-β treated groups [52]. Although the total forces were smaller than the TFM data, the trends between both studies were very consistent. Specifically, the relative increase of the total force from the C5 to T5 group in this study was ∼2.0 fold, while the relative increase of the total force measured by TFM from the control to TGF-β treated group was ∼2.2 fold. The total force that we calculated from our simulations was about ∼1/4 from actual TFM experiments. It is also possible that the stress fibers exhibited stronger contractile force near the ends of the VIC, as observed for fibroblasts [28,53]. Moreover, because we determined the contraction strength of the stress fibers from the indentation at the center of the VICs, we did not consider other local variations in the stress fiber contraction levels. Regardless, the general agreement found suggests the present modeling approach accurately captured the key phenomena.
4.4. One-Dimensional Simulation of Stress Fiber Loading Rate Sensitivity.
As stated above, valvular tissues stretch and contract rapidly during each cardiac cycle [54]. An open question in VIC mechanobiology is if there are any effects of this loading rate in health or disease. Lacerda et al. observed that cyclic tensile strain induced the activation of VICs in mitral valve leaflet in the peak strain-dependent manner [7]. Although they only used the fixed cycle frequency (0.5 Hz) and connected the peak strain to the activation levels of VICs, it is possible that strain rate too can play a role in the activation of VICs. We also note that in a previous study we estimated the changes in VIC nuclear aspect ratio (NAR) during systolic closure of mitral valve [55]. In fibrosa layer, the NAR changed from 2.6 before the valve closure to 4.9 after the valve closure within ∼50 ms. However, to this date, how the stress fibers within VICs respond to these mechanical stimuli has never been studied, as it is impossible to assess the internal mechanics of VICs when they are within the native environments.
Using the present computational model, we simulated the one-dimensional stretch of the stress fibers using newly available experimental data of VIC stretch within the native environment estimated by Lee et al. [55]. Assuming that the NAR corresponded to the cell aspect ratio as well as the representative fiber stretch within the VIC (Fig. 13(a)), we calculated the 1D stretch and stretch rate of the fibers during systolic valve closure (Fig. 13(b)). From the stretch and stretch rate, we then computed the 1D stress within the stress fibers during valve closing using the following:
Fig. 13.
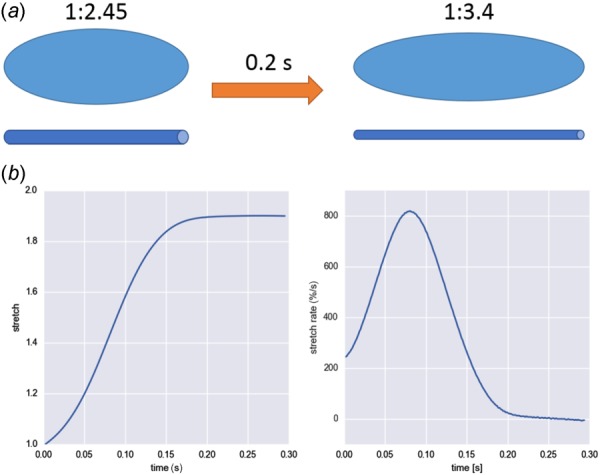
(a) Schematic of the stretch of a VIC inside mitral valve and corresponding fiber stretch during valve closing. Assuming that NAR corresponds to the cell aspect ratio as well as representative fiber length, we simulated the 1D fiber stretch and calculated the stress. (b) Stretch and stretch rate of the 1D fiber computed from the NAR of VICs within mitral valve during systolic valve closure [55].
| (15) |
In Eq. (15), we used and values obtained from experimental measurements (Fig. 4), and μsf, ηα-SMA, and f0 values obtained from this study. Note that Eq. (15) is simply the sum of integrands in Eq. (12). The simulation predicted that stress fibers generated greatly different 1D stress, depending on the activation states of the VICs (Fig. 14). Only the T90 group exhibited noticeable viscous effect, which peaked around 0.12 s. In order to understand the effect of different mechanical responses of stress fibers, we computed the passive elastic, active contractile, and viscous stresses at peak stretch rate at t = 0.08 (Fig. 15). The passive elastic response accounted for the most of the increase in the 1D stress from normal state (C5 group) to activated states (C90 and T5 groups). The increase in active contractile and viscous responses accounted for the further increase in the stress in hypertensive state (T90 group). Viscous response generated minimal stresses for CytoD, C5, C90, and T5 group while it generated substantial stress in T90 group, which was consistent with the mechanical response of VICs under microindentation.
Fig. 14.
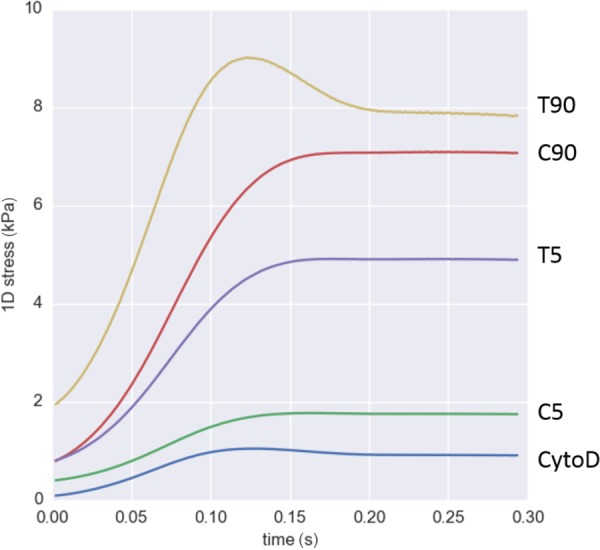
One-dimensional stress within stress fibers during systolic closure of mitral valve. The stress generated within stress fibers was greatly different due to different passive elastic, active contractile, and viscous stresses within the fibers. Only T90 group exhibited significant effect of viscous effect, which peaked around 0.12 s.
Fig. 15.
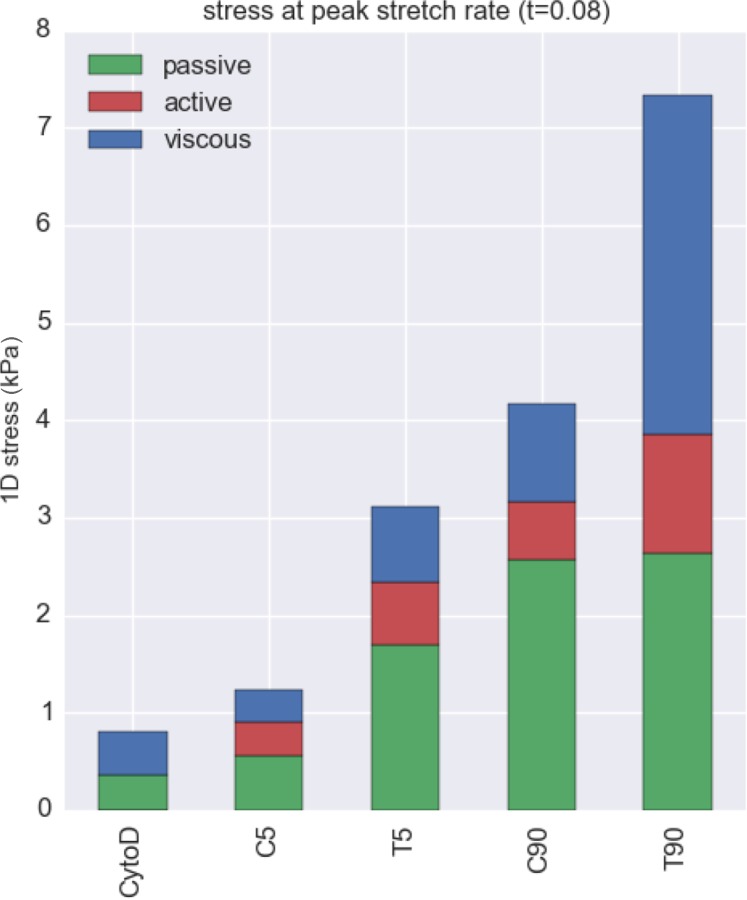
Stress calculated from the simulation of 1D fiber stretch at its peak strain rate (Fig. 13(b)), with the stress from each component determined at the point of peak strain rate (t = 0.08). Passive elastic response explains the most of increase in the stress from normal state (C5 group) and it activated states (T5 and C90 groups). The enhancement in active contractile and especially the viscous responses explain the further increase in the stress in highest activation state (T90 group). Collectively, these results suggest that incorporated αSMA is intrinsically viscoelastic.
Results indicated that active contractile and viscous responses were significantly upregulated under hypertensive states (T90 group) compared to normal or activated states (C5, C90, and T5 groups). The enhanced strain rate sensitivity of the hypertensive state could be the key for the positive feedback loop of the VICs. For example, it is known that the cyclic stretch caused the higher activation states within VICs [7]. If VICs can sense stress within the cell, not only the stretch dependent elastic stress but also the stretch-rate-dependent viscous stress could enhance the activation level of the VICs. In other words, it is possible that recruitment of α-SMA into stress fibers depends on the internal stress of the stress fibers.
4.5. Limitations.
We found that the incorporation of α-SMA into the stress fibers correlated well with the strain rate sensitivity of the VIC; yet the source of the strain rate sensitivity remains an open question. A possible explanation is that the α-SMA binding induced structural changes of the stress fibers, causing the viscous resistance within the fibers. Also, we found that the incorporation of α-SMA into stress fibers enhanced the contraction strength. Thus, it is possible that α-SMA influenced not only the “static” contraction but also the “dynamic” contraction, which depends on the stretch rate of the stress fibers. In fact, Kumar et al. used nanolaser to scissor the stress fibers within a living endothelial cell and observed their retraction over time [50]. Stress fibers retracted like a viscoelastic cable after they were severed, exhibiting creep responses, and inhibiting the active contraction slowed down the retraction speed as well as decreased the maximum retraction distance. Thus, contraction strength of the stress fibers seemed to affect their viscoelastic properties. It is also possible that α-SMA expression levels correlate with some other mechanisms that enhanced the viscosity of cytoplasm in general. For example, fluid movement inside the VIC could be the source of strain rate sensitivity, either due to increase in intrinsic viscosity of the fluid or the more interaction between fluid and solid material phases. However, we speculate that the stress fibers are the main structural components of the VICs. Thus, it is likely that the stress fiber re-organization was the source of strain rate sensitivity from normal state to hypertensive state. While provocative, clearly much work remains to determine the implications of these findings.
We also note that we did not simulate stress fiber remodeling as the time scale of the fiber re-organization, or the association and dissociation rates of the cross-linker proteins of the cytoskeletal network were reported to be 1 s or longer [56]. We further assumed that there were negligible structural changes within the stress fiber network during the microindentation experiments. This is based on our working modeling approach that examined changes that occurred between homeostatic and quasi-static states, and not the processes that occur during the transitions or during the small perturbations.
In the future, we will need to study the mechanical responses of VICs under more native-like conditions. We utilized VICs on 2D flat substrates coated by collagen gel, which is not equivalent to the actual physiological environment. Especially, it is known that tissue/substrate stiffness [57–59] and tissue deposition [60] affect the biological state of the VICs in both 2D and 3D environments while we only used one mode of the substrate stiffness on 2D environment. However, we also observed that the application of CytoD, KCl, and TGF-β1 influenced the biological states of the VICs nevertheless. Thus, we concluded that the difference in the biomechanical properties of the VICs under different conditions could be used to analyze the internal biomechanical properties of the VICs, namely stress fibers. In order to study the effects of surrounding tissue to the biomechanical states of the VICs, further studies are necessary for both 2D and 3D environments. Moreover, VICs in the physiological environments are within 3D ECM with dynamic unloading/loading conditions. VICs in the 3D environment can develop focal adhesion complexes all around their surfaces, unlike the ones seeded on the 2D flat surface. Thus, it is possible that VICs within the physiological environment exhibit greatly different biomechanical properties than the ones in experiments. It is also known that the extracellular matrix rigidity or substrate stiffness affects the activation states of the VICs or myofibroblasts [47]. Although the microindentation experiment coupled with computational modeling gave us insight in the internal biomechanics of the VICs, our ultimate goal is to study how the VICs function in the physiological tissue and how they are related to pathophysiology. Finally, as with any continuum approach to cell modeling, we remain limited by more detailed understandings and the subcellular and molecular levels. Yet, continuum approaches attempted here help to provide insight into how VICs function as a system, and guide future investigations.
4.6. Conclusions.
In conclusion, we have developed an improved VIC computational model that consisted of the primary mechanical constituents: stress fiber passive elastic, active contractile, and viscous. We found that while both F-actin and α-SMA contributed to stress fiber force generation, increased α-SMA levels appeared to be the dominant contributors to the associated increase in stress fiber force generation and VIC total traction force. We also noted, for the first time, the enhanced VIC strain rate sensitivity in hypertensive state (T90 group) that appeared to be due solely to the substantially greater incorporation of α-SMA into the stress fibers in this group. Our 1D stress fiber simulations further predicted that under the physiological stretch and stretch rate, the internal stress within the stress fibers was greatly different for different activation states, including substantial increases in the viscous stress. Collectively, we can speculate that highly activated VICs may exhibit strain rate sensitivity in vivo by generating higher internal forces within their stress fibers, which in turn may alter ECM synthesis and move the valve down associated with pathological pathways. Clearly, our VIC model will have to be part of the foundation of a larger, multiscale model of the entire valve to uncover the detailed mechanics of the pathophysiology of the heart valves.
Acknowledgment
We would like to thank Dr. Ferrari at the University of Pennsylvania for donating VICs used in this study. We gratefully acknowledge the support by NIH Grant Nos. R01 HL-68816-01 and R01 HL119299 to MSS.
Contributor Information
Yusuke Sakamoto, Center for Cardiovascular Simulation, , Institute for Computational , Engineering and Sciences, , Department of Biomedical Engineering, , The University of Texas at Austin, , Austin, TX 78712.
Rachel M. Buchanan, Center for Cardiovascular Simulation, , Institute for Computational , Engineering and Sciences, , Department of Biomedical Engineering, , The University of Texas at Austin, , Austin, TX 78712
Johannah Sanchez-Adams, Departments of Orthopaedic Surgery, , Duke University Medical Center, , Durham, NC 27710;; Departments of Biomedical Engineering, , Duke University Medical Center, , Durham, NC 27710
Farshid Guilak, Departments of Orthopaedic Surgery, , Washington University, , St. Louis, MO 63110;; Departments of Biomedical Engineering, , Washington University, , St. Louis, MO 63110; Departments of Developmental Biology, , Washington University, , St. Louis, MO 63110
Michael S. Sacks, W. A. “Tex” Moncrief, Jr. Simulation-Based , Engineering Science Chair I , Center for Cardiovascular Simulation, , Institute for Computational , Engineering and Sciences, , Department of Biomedical Engineering, , The University of Texas at Austin, , Austin, TX 78712 , e-mail: msacks@ices.utexas.edu.
Nomenclature
- f0 =
maximum contraction strength
- K =
bulk modulus for incompressibility constraint
- kf =
fiber concentration factor
- ηα-SMA =
viscous constant of α-SMA
- μcyto =
shear modulus of the cytoskeleton phase
- μnuc =
shear modulus of the nucleus
- μsf =
shear modulus of the stress fibers
- =
expression level of F-actin
- =
expression level of α-SMA
References
- [1]. Schoen, F. J. , 2008, “ Evolving Concepts of Cardiac Valve Dynamics: The Continuum of Development, Functional Structure, Pathobiology, and Tissue Engineering,” Circulation, 118(18), pp. 1864–1880. 10.1161/CIRCULATIONAHA.108.805911 [DOI] [PubMed] [Google Scholar]
- [2]. Sacks, M. S. , Merryman, W. D. , and Schmidt, D. E. , 2009, “ On the Biomechanics of Heart Valve Function,” J. Biomech., 42(12), pp. 1804–1824. 10.1016/j.jbiomech.2009.05.015 [DOI] [PMC free article] [PubMed] [Google Scholar]
- [3]. Butcher, J. T. , Simmons, C. A. , and Warnock, J. N. , 2008, “ Mechanobiology of the Aortic Heart Valve,” J. Heart Valve Dis., 17(1), pp. 62–73.https://www.researchgate.net/publication/5486021_Review_Mechanobiology_of_the_aortic_heart_valve [PubMed] [Google Scholar]
- [4]. Rabkin-Aikawa, E. , Farber, M. , Aikawa, M. , and Schoen, F. J. , 2004, “ Dynamic and Reversible Changes of Interstitial Cell Phenotype During Remodeling of Cardiac Valves,” J. Heart Valve Dis., 13(5), pp. 841–847.https://www.researchgate.net/publication/8243286_Dynamic_and_reversible_changes_of_interstitial_cell_phenotype_during_remodeling_of_cardiac_valves [PubMed] [Google Scholar]
- [5]. Liu, A. C. , Joag, V. R. , and Gotlieb, A. I. , 2007, “ The Emerging Role of Valve Interstitial Cell Phenotypes in Regulating Heart Valve Pathobiology,” Am. J. Pathol., 171(5), pp. 1407–1418. 10.2353/ajpath.2007.070251 [DOI] [PMC free article] [PubMed] [Google Scholar]
- [6]. Schroer, A. K. , and Merryman, W. D. , 2015, “ Mechanobiology of Myofibroblast Adhesion in Fibrotic Cardiac Disease,” J. Cell Sci., 128(10), pp. 1865–1875. 10.1242/jcs.162891 [DOI] [PMC free article] [PubMed] [Google Scholar]
- [7]. Lacerda, C. M. , Kisiday, J. , Johnson, B. , and Orton, E. C. , 2012, “ Local Serotonin Mediates Cyclic Strain-Induced Phenotype Transformation, Matrix Degradation, and Glycosaminoglycan Synthesis in Cultured Sheep Mitral Valves,” Am. J. Physiol.: Heart Circ. Physiol., 302(10), pp. H1983–1990. 10.1152/ajpheart.00987.2011 [DOI] [PubMed] [Google Scholar]
- [8]. Sacks, M. S. , Enomoto, Y. , Graybill, J. R. , Merryman, W. D. , Zeeshan, A. , Yoganathan, A. P. , Levy, R. J. , Gorman, R. C. , and Gorman, J. H., 3rd , 2006, “ In-Vivo Dynamic Deformation of the Mitral Valve Anterior Leaflet,” Ann. Thorac. Surg., 82(4), pp. 1369–1377. 10.1016/j.athoracsur.2006.03.117 [DOI] [PubMed] [Google Scholar]
- [9]. Merryman, W. D. , Youn, I. , Lukoff, H. D. , Krueger, P. M. , Guilak, F. , Hopkins, R. A. , and Sacks, M. S. , 2006, “ Correlation Between Heart Valve Interstitial Cell Stiffness and Transvalvular Pressure: Implications for Collagen Biosynthesis,” Am. J. Physiol.: Heart Circ. Physiol., 290(1), pp. H224–231. 10.1152/ajpheart.00521.2005 [DOI] [PubMed] [Google Scholar]
- [10]. Merryman, W. D. , Bieniek, P. D. , Guilak, F. , and Sacks, M. S. , 2009, “ Viscoelastic Properties of the Aortic Valve Interstitial Cell,” ASME J. Biomech. Eng., 131(4), p. 041005. 10.1115/1.3049821 [DOI] [PMC free article] [PubMed] [Google Scholar]
- [11]. Wyss, K. , Yip, C. Y. , Mirzaei, Z. , Jin, X. , Chen, J.-H. , and Simmons, C. A. , 2012, “ The Elastic Properties of Valve Interstitial Cells Undergoing Pathological Differentiation,” J. Biomech., 45(5), pp. 882–887. 10.1016/j.jbiomech.2011.11.030 [DOI] [PubMed] [Google Scholar]
- [12]. Merryman, W. D. , Liao, J. , Parekh, A. , Candiello, J. E. , Lin, H. , and Sacks, M. S. , 2007, “ Differences in Tissue-Remodeling Potential of Aortic and Pulmonary Heart Valve Interstitial Cells,” Tissue Eng., 13(9), pp. 2281–2289. 10.1089/ten.2006.0324 [DOI] [PubMed] [Google Scholar]
- [13]. Merryman, W. D. , Lukoff, H. D. , Long, R. A. , Engelmayr, G. C., Jr. , Hopkins, R. A. , and Sacks, M. S. , 2007, “ Synergistic Effects of Cyclic Tension and Transforming Growth Factor-Beta1 on the Aortic Valve Myofibroblast,” Cardiovasc. Pathol., 16(5), pp. 268–276. 10.1016/j.carpath.2007.03.006 [DOI] [PMC free article] [PubMed] [Google Scholar]
- [14]. Hinz, B. , Gabbiani, G. , and Chaponnier, C. , 2002, “ The NH2-Terminal Peptide of Alpha-Smooth Muscle Actin Inhibits Force Generation by the Myofibroblast In Vitro and In Vivo,” J. Cell Biol., 157(4), pp. 657–663. 10.1002/jcp.1041590120 [DOI] [PMC free article] [PubMed] [Google Scholar]
- [15]. Clement, S. , Hinz, B. , Dugina, V. , Gabbiani, G. , and Chaponnier, C. , 2005, “ The N-Terminal Ac-EEED Sequence Plays a Role in Alpha-Smooth-Muscle Actin Incorporation Into Stress Fibers,” J. Cell Sci., 118(Pt 7), pp. 1395–1404. 10.1242/jcs.01732 [DOI] [PubMed] [Google Scholar]
- [16]. Hinz, B. , Celetta, G. , Tomasek, J. J. , Gabbiani, G. , and Chaponnier, C. , 2001, “ Alpha-Smooth Muscle Actin Expression Upregulates Fibroblast Contractile Activity,” Mol. Biol. Cell, 12(9), pp. 2730–2741. 10.1091/mbc.12.9.2730 [DOI] [PMC free article] [PubMed] [Google Scholar]
- [17]. Castella, L. F. , Gabbiani, G. , Mcculloch, C. A. , and Hinz, B. , 2010, “ Regulation of Myofibroblast Activities: Calcium Pulls Some Strings Behind the Scene,” Exp. Cell Res., 316(15), pp. 2390–2401. 10.1016/j.yexcr.2010.04.033 [DOI] [PubMed] [Google Scholar]
- [18]. Chen, J. , Li, H. , Sundarraj, N. , and Wang, J. H. , 2007, “ Alpha-Smooth Muscle Actin Expression Enhances Cell Traction Force,” Cell Motil. Cytoskeleton, 64(4), pp. 248–257. 10.1002/cm.20178 [DOI] [PubMed] [Google Scholar]
- [19]. Wang, J. H. C. , and Lin, J. S. , 2007, “ Cell Traction Force and Measurement Methods,” Biomech. Model. Mechanobiol., 6(6), pp. 361–371. 10.1007/s10237-006-0068-4 [DOI] [PubMed] [Google Scholar]
- [20]. Deshpande, V. S. , Mcmeeking, R. M. , and Evans, A. G. , 2006, “ A Bio-Chemo-Mechanical Model for Cell Contractility,” Proc. Natl. Acad. Sci. U.S.A., 103(38), pp. 14015–14020. 10.1073/pnas.0605837103 [DOI] [PMC free article] [PubMed] [Google Scholar]
- [21]. Mcgarry, J. P. , 2009, “ Characterization of Cell Mechanical Properties by Computational Modeling of Parallel Plate Compression,” Ann. Biomed. Eng., 37(11), pp. 2317–2325. 10.1007/s10439-009-9772-4 [DOI] [PubMed] [Google Scholar]
- [22]. Dowling, E. P. , Ronan, W. , and Mcgarry, J. P. , 2013, “ Computational Investigation of In Situ Chondrocyte Deformation and Actin Cytoskeleton Remodelling Under Physiological Loading,” Acta Biomater., 9(4), pp. 5943–5955. 10.1016/j.actbio.2012.12.021 [DOI] [PubMed] [Google Scholar]
- [23]. Reynolds, N. H. , and Mcgarry, J. P. , 2015, “ Single Cell Active Force Generation Under Dynamic Loading—Part II: Active Modelling Insights,” Acta Biomater., 27, pp. 251–263. 10.1016/j.actbio.2015.09.004 [DOI] [PubMed] [Google Scholar]
- [24]. Reynolds, N. H. , Ronan, W. , Dowling, E. P. , Owens, P. , Mcmeeking, R. M. , and Mcgarry, J. P. , 2014, “ On the Role of the Actin Cytoskeleton and Nucleus in the Biomechanical Response of Spread Cells,” Biomaterials, 35(13), pp. 4015–4025. 10.1016/j.biomaterials.2014.01.056 [DOI] [PubMed] [Google Scholar]
- [25]. Vernerey, F. J. , and Farsad, M. , 2011, “ An Eulerian/XFEM Formulation for the Large Deformation of Cortical Cell Membrane,” Comput. Methods Biomech. Biomed. Eng., 14(5), pp. 433–445. 10.1080/10255842.2010.531273 [DOI] [PubMed] [Google Scholar]
- [26]. Sakamoto, Y. , Buchanan, R. M. , and Sacks, M. S. , 2016, “ On Intrinsic Stress Fiber Contractile Forces in Semilunar Heart Valve Interstitial Cells Using a Continuum Mixture Model,” J. Mech. Behav. Biomed. Mater., 54, pp. 244–258. 10.1016/j.jmbbm.2015.09.027 [DOI] [PMC free article] [PubMed] [Google Scholar]
- [27]. Carlson, F. D. , and Wilkie, D. R. , 1974, Muscle Physiology (Prentice-Hall Biological Science Series), Prentice-Hall, Englewood Cliffs, NJ. [Google Scholar]
- [28]. Deguchi, S. , and Sato, M. , 2009, “ Biomechanical Properties of Actin Stress Fibers of Non-Motile Cells,” Biorheology, 46(2), pp. 93–105. 10.3233/BIR-2009-0528 [DOI] [PubMed] [Google Scholar]
- [29]. Vernerey, F. J. , and Farsad, M. , 2011, “ A Constrained Mixture Approach to Mechano-Sensing and Force Generation in Contractile Cells,” J. Mech. Behav. Biomed. Mater., 4(8), pp. 1683–1699. 10.1016/j.jmbbm.2011.05.022 [DOI] [PubMed] [Google Scholar]
- [30]. Clark-Greuel, J. N. , Connolly, J. M. , Sorichillo, E. , Narula, N. R. , Rapoport, H. S. , Mohler, E. R. , 3rd, Gorman, J. H., 3rd , Gorman, R. C. , and Levy, R. J. , 2007, “ Transforming Growth Factor-Beta1 Mechanisms in Aortic Valve Calcification: Increased Alkaline Phosphatase and Related Events,” Ann. Thorac. Surg., 83(3), pp. 946–953. 10.1016/j.athoracsur.2006.10.026 [DOI] [PubMed] [Google Scholar]
- [31]. Osman, L. , Yacoub, M. H. , Latif, N. , Amrani, M. , and Chester, A. H. , 2006, “ Role of Human Valve Interstitial Cells in Valve Calcification and Their Response to Atorvastatin,” Circulation, 114(1 Suppl.), pp. I547–I552. 10.1161/CIRCULATIONAHA.105.001115 [DOI] [PubMed] [Google Scholar]
- [32]. Jian, B. , Narula, N. , Li, Q. Y. , Mohler, E. R., 3rd , and Levy, R. J. , 2003, “ Progression of Aortic Valve Stenosis: TGF-Beta1 Is Present in Calcified Aortic Valve Cusps and Promotes Aortic Valve Interstitial Cell Calcification Via Apoptosis,” Ann. Thorac. Surg., 75(2), pp. 457–465; discussion 465–466. 10.1016/S0003-4975(02)04312-6 [DOI] [PubMed] [Google Scholar]
- [33]. Walker, G. A. , Masters, K. S. , Shah, D. N. , Anseth, K. S. , and Leinwand, L. A. , 2004, “ Valvular Myofibroblast Activation by Transforming Growth Factor-Beta: Implications for Pathological Extracellular Matrix Remodeling in Heart Valve Disease,” Circ. Res., 95(3), pp. 253–260. 10.1161/01.RES.0000136520.07995.aa [DOI] [PubMed] [Google Scholar]
- [34]. Branchetti, E. , Sainger, R. , Poggio, P. , Grau, J. B. , Patterson-Fortin, J. , Bavaria, J. E. , Chorny, M. , Lai, E. , Gorman, R. C. , Levy, R. J. , and Ferrari, G. , 2013, “ Antioxidant Enzymes Reduce DNA Damage and Early Activation of Valvular Interstitial Cells in Aortic Valve Sclerosis,” Arterioscler., Thromb., Vasc. Biol., 33(2), pp. e66–74. 10.1161/ATVBAHA.112.300177 [DOI] [PMC free article] [PubMed] [Google Scholar]
- [35]. Guo, S. , and Akhremitchev, B. B. , 2006, “ Packing Density and Structural Heterogeneity of Insulin Amyloid Fibrils Measured by AFM Nanoindentation,” Biomacromolecules, 7(5), pp. 1630–1636. 10.1021/bm0600724 [DOI] [PubMed] [Google Scholar]
- [36]. Dimitriadis, E. K. , Horkay, F. , Maresca, J. , Kachar, B. , and Chadwick, R. S. , 2002, “ Determination of Elastic Moduli of Thin Layers of Soft Material Using the Atomic Force Microscope,” Biophys. J., 82(5), pp. 2798–2810. 10.1016/S0006-3495(02)75620-8 [DOI] [PMC free article] [PubMed] [Google Scholar]
- [37]. Schindelin, J. , Arganda-Carreras, I. , Frise, E. , Kaynig, V. , Longair, M. , Pietzsch, T. , Preibisch, S. , Rueden, C. , Saalfeld, S. , Schmid, B. , Tinevez, J. Y. , White, D. J. , Hartenstein, V. , Eliceiri, K. , Tomancak, P. , and Cardona, A. , 2012, “ Fiji: An Open-Source Platform for Biological-Image Analysis,” Nat. Methods, 9(7), pp. 676–682. 10.1038/nmeth.2019 [DOI] [PMC free article] [PubMed] [Google Scholar]
- [38]. Hinz, B. , 2010, “ The Myofibroblast: Paradigm for a Mechanically Active Cell,” J. Biomech., 43(1), pp. 146–155. 10.1016/j.jbiomech.2009.09.020 [DOI] [PubMed] [Google Scholar]
- [39]. Gouget, C. L. , Girard, M. J. , and Ethier, C. R. , 2012, “ A Constrained Von Mises Distribution to Describe Fiber Organization in Thin Soft Tissues,” Biomech. Model. Mechanobiol., 11(3–4), pp. 475–482. 10.1007/s10237-011-0326-y [DOI] [PubMed] [Google Scholar]
- [40]. Hinz, B. , and Gabbiani, G. , 2003, “ Mechanisms of Force Generation and Transmission by Myofibroblasts,” Curr. Opin. Biotechnol., 14(5), pp. 538–546. 10.1016/j.copbio.2003.08.006 [DOI] [PubMed] [Google Scholar]
- [41]. Hinz, B. , Phan, S. H. , Thannickal, V. J. , Prunotto, M. , Desmouliere, A. , Varga, J. , De Wever, O. , Mareel, M. , and Gabbian, G. , 2012, “ Recent Developments in Myofibroblast Biology Paradigms for Connective Tissue Remodeling,” Am. J. Pathol., 180(4), pp. 1340–1355. 10.1016/j.ajpath.2012.02.004 [DOI] [PMC free article] [PubMed] [Google Scholar]
- [42]. Merryman, W. D. , 2007, “ Mechanobiology of the Aortic Valve Interstitial Cell,” Doctoral dissertation, University of Pittsburgh, Pittsburgh, PA.http://d-scholarship.pitt.edu/8153/1/MerrymanETDv3.pdf
- [43]. Chen, M. , Patra, P. K. , Warner, S. B. , and Bhowmick, S. , 2007, “ Role of Fiber Diameter in Adhesion and Proliferation of NIH 3T3 Fibroblast on Electrospun Polycaprolactone Scaffolds,” Tissue Eng., 13(3), pp. 579–587. 10.1089/ten.2006.0205 [DOI] [PubMed] [Google Scholar]
- [44]. Wang, J. , Zohar, R. , and Mcculloch, C. A. , 2006, “ Multiple Roles of Alpha-Smooth Muscle Actin in Mechanotransduction,” Exp. Cell Res., 312(3), pp. 205–214. 10.1016/j.yexcr.2005.11.004 [DOI] [PubMed] [Google Scholar]
- [45]. Edman, K. A. , 1966, “ The Relation Between Sarcomere Length and Active Tension in Isolated Semitendinosus Fibres of the Frog,” J. Physiol., 183(2), pp. 407–417. 10.1113/jphysiol.1966.sp007873 [DOI] [PMC free article] [PubMed] [Google Scholar]
- [46]. Maas, S. A. , Ellis, B. J. , Ateshian, G. A. , and Weiss, J. A. , 2012, “ FEBio: Finite Elements for Biomechanics,” ASME J. Biomech. Eng., 134(1), p. 011005. 10.1115/1.4005694 [DOI] [PMC free article] [PubMed] [Google Scholar]
- [47]. Goffin, J. M. , Pittet, P. , Csucs, G. , Lussi, J. W. , Meister, J. J. , and Hinz, B. , 2006, “ Focal Adhesion Size Controls Tension-Dependent Recruitment of Alpha-Smooth Muscle Actin to Stress Fibers,” J. Cell Biol., 172(2), pp. 259–268. 10.1016/S0002-9440(10)65334-5 [DOI] [PMC free article] [PubMed] [Google Scholar]
- [48]. Katoh, K. , Kano, Y. , Amano, M. , Onishi, H. , Kaibuchi, K. , and Fujiwara, K. , 2001, “ Rho-Kinase–Mediated Contraction of Isolated Stress Fibers,” J. Cell Biol., 153(3), pp. 569–584. 10.1074/jbc.271.34.20246 [DOI] [PMC free article] [PubMed] [Google Scholar]
- [49]. Deguchi, S. , Ohashi, T. , and Sato, M. , 2006, “ Tensile Properties of Single Stress Fibers Isolated From Cultured Vascular Smooth Muscle Cells,” J. Biomech., 39(14), pp. 2603–2610. 10.1016/j.jbiomech.2005.08.026 [DOI] [PubMed] [Google Scholar]
- [50]. Kumar, S. , Maxwell, I. Z. , Heisterkamp, A. , Polte, T. R. , Lele, T. P. , Salanga, M. , Mazur, E. , and Ingber, D. E. , 2006, “ Viscoelastic Retraction of Single Living Stress Fibers and Its Impact on Cell Shape, Cytoskeletal Organization, and Extracellular Matrix Mechanics,” Biophys. J., 90(10), pp. 3762–3773. 10.1529/biophysj.105.071506 [DOI] [PMC free article] [PubMed] [Google Scholar]
- [51]. Li, B. , and Wang, J. H. , 2011, “ Fibroblasts and Myofibroblasts in Wound Healing: Force Generation and Measurement,” J. Tissue Viability, 20(4), pp. 108–120. 10.1016/j.jtv.2009.11.004 [DOI] [PMC free article] [PubMed] [Google Scholar]
- [52]. Cirka, H. , Monterosso, M. , Diamantides, N. , Favreau, J. , Wen, Q. , and Billiar, K. , 2016, “ Active Traction Force Response to Long-Term Cyclic Stretch Is Dependent on Cell Pre-Stress,” Biophys. J., 110(8), pp. 1845–1857. 10.1016/j.bpj.2016.02.036 [DOI] [PMC free article] [PubMed] [Google Scholar]
- [53]. Peterson, L. J. , Rajfur, Z. , Maddox, A. S. , Freel, C. D. , Chen, Y. , Edlund, M. , Otey, C. , and Burridge, K. , 2004, “ Simultaneous Stretching and Contraction of Stress Fibers in vivo,” Mol. Biol. Cell, 15(7), pp. 3497–3508. 10.1091/mbc.E03-09-0696 [DOI] [PMC free article] [PubMed] [Google Scholar]
- [54]. Sacks, M. S. , He, Z. , Baijens, L. , Wanant, S. , Shah, P. , Sugimoto, H. , and Yoganathan, A. P. , 2002, “ Surface Strains in the Anterior Leaflet of the Functioning Mitral Valve,” Ann. Biomed. Eng., 30(10), pp. 1281–1290. 10.1114/1.1529194 [DOI] [PubMed] [Google Scholar]
- [55]. Lee, C.-H. , Feaver, K. , Zhang, W. , Gorman, R. C. , Gorman, J. H. , and Sacks, M. S. , 2016, “ Inverse Modeling Based Estimation of in vivo Stresses and Their Relation to Simulated Layer-Specific Interstitial Cell Deformations in the Mitral Valve,” Proceedings of the SB3C, National Harbor, MD.
- [56]. Lieleg, O. , Claessens, M. M. , Luan, Y. , and Bausch, A. R. , 2008, “ Transient Binding and Dissipation in Cross-Linked Actin Networks,” Phys. Rev. Lett., 101(10), p. 108101. 10.1103/PhysRevLett.101.108101 [DOI] [PubMed] [Google Scholar]
- [57]. Kloxin, A. M. , Benton, J. A. , and Anseth, K. S. , 2010, “ In Situ Elasticity Modulation With Dynamic Substrates to Direct Cell Phenotype,” Biomaterials, 31(1), pp. 1–8. 10.1016/j.biomaterials.2009.09.025 [DOI] [PMC free article] [PubMed] [Google Scholar]
- [58]. Duan, B. , Yin, Z. , Kang, L. H. , Magin, R. L. , and Butcher, J. T. , 2016, “ Active Tissue Stiffness Modulation Controls Valve Interstitial Cell Phenotype and Osteogenic Potential in 3d Culture,” Acta Biomater., 36, pp. 42–54. 10.1016/j.actbio.2016.03.007 [DOI] [PMC free article] [PubMed] [Google Scholar]
- [59]. Liu, H. , Sun, Y. , and Simmons, C. A. , 2013, “ Determination of Local and Global Elastic Moduli of Valve Interstitial Cells Cultured on Soft Substrates,” J. Biomech., 46(11), pp. 1967–1971. 10.1016/j.jbiomech.2013.05.001 [DOI] [PubMed] [Google Scholar]
- [60]. Gould, S. T. , and Anseth, K. S. , 2013, “ Role of Cell-Matrix Interactions on VIC Phenotype and Tissue Deposition in 3D PEG Hydrogels,” J. Tissue Eng. Regener. Med., 10(10), pp. E443–E453. 10.1002/term.1836 [DOI] [PMC free article] [PubMed] [Google Scholar]


