

Abstract
Autophagy is a lysosomal-mediated catabolic process, which through degradation of different cytoplasmic components aids in maintaining cellular homeostasis and survival during exposure to extra- or intracellular stresses. Ammonia is a potential toxic and stress-inducing byproduct of glutamine catabolism, which has recently been found to induce autophagy in an MTOR independent way and support cancer cell survival. In this study, quantitative phosphoproteomics was applied to investigate the initial signaling events linking ammonia to the induction of autophagy. The MTOR inhibitor rapamycin was used as a reference treatment to emphasize the differences between an MTOR-dependent and -independent autophagy-induction. By this means 5901 phosphosites were identified of which 626 were treatment-specific regulated and 175 were coregulated. Investigation of the ammonia-specific regulated sites supported that MTOR activity was not affected, but indicated increased MAPK3 activity, regulation of proteins involved in Rho signal transduction, and a novel phosphorylation motif, serine-proline-threonine (SPT), which could be linked to cytoskeleton-associated proteins. MAPK3 could not be identified as the primary driver of ammonia-induced autophagy but instead the data suggested an upregulation of AMPK and the unfolded protein response (UPR), which might link ammonia to autophagy induction. Support of UPR induction was further obtained from the finding of increased protein levels of the ER stress markers DDIT3/CHOP and HSPA5 during ammonia treatment. The large-scale data set presented here comprises extensive high-quality quantitative information on phosphoprotein regulation in response to 2 very different autophagy inducers and should therefore be considered a general resource for the community.
Keywords: autophagy, phosphoproteomics, ammonia, rapamycin, MTOR, unfolded protein response
Introduction
Macroautophagy, (hereafter referred to as autophagy) is a conserved catabolic process involved in the turnover of long-lived proteins, protein aggregates, and organelles. 1 Autophagy has gained increasing attention because of its implication in important cellular processes and diseases including aging, neurodegeneration, and cancer. 2 Autophagy occurs constitutively at a low basal level but is upregulated in response to cellular stresses including nutrient starvation, growth factor deprivation, hypoxia, oxidative stress, and mitochondrial damage. 3 A central regulator of autophagy is the kinase mechanistic target of rapamycin (MTOR), which stimulates protein translation and proliferation and represses autophagy when conditions are optimal for growth. 4 Inhibition of this kinase potently upregulates autophagy even in the presence of sufficient nutrients and growth hormones as observed during the cellular response to the specific MTOR inhibitor rapamycin. 5
Ammonia is a potentially toxic byproduct of glutamine catabolism, a process which is often upregulated in cancer cells. 6 Recently, low millimolar concentrations of ammonia, produced by glutaminolysis, have been identified as a novel stimulator of autophagy in cultured cells. The physiological relevance of this finding is underscored by the detection of similar millimolar concentrations of ammonia in human tumor zenografts. Moreover, glutaminolysis and ammonia-induced autophagy confer a cytoprotective effect on cultured cancer cells treated with tumor necrosis factor α (TNF/TNFα). Interestingly, it was found that ammonia decreased cell growth and proliferation, but without affecting MTOR kinase activity. This excluded MTOR repression as the signaling mechanism linking ammonia to autophagy induction. 7 Further, the observed autophagy cannot be linked to other of the tested autophagy-regulating pathways and the reported dependency on ULK1/2, has been recently challenged. 7 , 8 Altogether, this complicates the picture and underlines that the cellular signaling governing ammonia-induced autophagy is still an open question.
Changes in protein phosphorylation represent a common response to cellular stimuli, and quantitative assessment of these changes may reveal important clues to the underlying molecular signaling mechanisms. The aim of this study was to gain insight into the initial phosphorylation events induced by ammonia stimulation to investigate how the autophagy response is induced. In this context the MTOR inhibitor rapamycin 9 was used as a reference treatment, to investigate the way in which ammonia stimulation differs from a relatively well-described autophagy response. The changes in protein phosphorylation of untreated, rapamycin-treated and ammonia-treated cells, were quantitatively evaluated using stable isotope labeling of amino acids in cell culture (SILAC) 10 in combination with mass spectrometric analysis of enriched phosphopeptides (Fig. 1A–C). By this approach we identified 5901 phosphosites of which 626 could be assigned to treatment-specific regulated sites and 175 to coregulated sites (Fig. 1D; Table S1). As expected, rapamycin induced more phosphorylation downregulations while, surprisingly, the opposite was true for the ammonia treatment. Many regulated phosphosites were identified on components of the immediate MTOR signaling network giving a detailed picture of the regulation differences resulting from the rapamycin and ammonia treatment. These sites supported the previous finding that ammonia does not inhibit MTOR activity. 7 Instead, we found strong indications of ammonia-mediated MAPK3 activation and showed by bioinformatic analyses, combined with follow-up wound-healing assays, a potential role for ammonia in MAPK3-dependent regulation of cell motility. Also, a number of regulated phosphosites suggested increased AMPK activity and an induction of the unfolded protein response (UPR), which could represent the missing link between ammonia and the induction of autophagy.

Figure 1. Overview of the experimental and analytical strategy. (A) Flow-scheme of the experimental approach for comparing ammonia- and rapamycin-induced autophagy at the phosphorylation level. Harvested and lysed cells were fractionated into cytosol and nuclei, to facilitate higher resolution in identifications. Proteins were digested and the resulting peptides were subjected to several cycles of phosphopeptide enrichment by TiO2. The fractions were analyzed by LC-MS/MS followed by calculation of peptide ratios and determination of phosphosite localization. (B) MS spectra of phosphopeptides assigned to AKT1S1 or MTOR and specifically regulated by rapamycin or ammonia respectively. Each spectrum displays the isotope pattern of a SILAC triplet with the light, medium, and heavy isotopes marked by the gray, red, and green squares, indicating reference, rapamycin, or ammonia-treated cells, respectively. The differences in intensities between light, medium, and heavy peaks form the basis of calculating phosphopeptide ratios. (C) MS/MS spectrum of the AKT1S1 peptide SLPVSVPVWGFK. Almost the complete sequence can be read from the annotated y- and b-ions series indicated by red and blue font respectively. The mass difference between the b3- and b3*-ion of 98 Da indicating a neutral loss of phosphoric acid from the peptide fragment “SLP” specifically localizes the phosphogroup to the first serine in the peptide sequence. (D) Overview of the total number of phosphosite identifications; 5901 unique phosphosites were identified on 1931 different proteins of which 1550 sites were considered regulated. These were filtered to 626 treatment-specific regulated and 175 coregulated phosphosites, which were finally sorted into groups according to phosphosite up- or downregulation. In the present study, a special emphasis was put on the 2 groups representing rapamycin-specific dephosphorylated- and ammonia-specific phosphorylated sites (the 2 groups encircled by a bold line).
Results
Ammonia induces autophagosome accumulation in MCF-7 cells
The potency of ammonia in inducing autophagy in our model system, enhanced green fluorescent protein (eGFP)-LC3-expressing MCF-7 cancer cells, was examined by fluorescence microscopy. Treating the MCF-7 cells with ammonia or rapamycin resulted in, for both treatments, increased numbers of eGFP-LC3 puncta relative to the untreated reference cells as shown in Figure 2A. This suggested that ammonia has the same autophagy-inducing effect on our model system as described by Eng and coworkers. 7 To support that the ammonia-induced increase in eGFP-LC3 puncta also in this study was a result of increased rather than impaired autophagy flux, the number of eGFP-LC3 puncta was quantified for each treatment with or without the presence of the lysosomal inhibitor concanamycinA (ConA). As shown in Figure 2B, the number of eGFP-puncta increased significantly (P < 0.01) for the combination of rapamycin and ConA (dark red bar) or ammonia and ConA (dark green bar) relative to rapamycin or ammonia alone (red and green bars respectively).

Figure 2. Testing the autophagy-inducing properties of ammonia and rapamycin. (A) Fluorescence microscopy of MCF-7 eGFP-LC3 cells being either untreated (Ref), treated for 3 h with 0.55 µM rapamycin (Rm) or treated for 3 h with 4mM ammonia (NH3). (B) Quantification of eGFP-puncta in MCF-7 eGFP-LC3 cells 3h after treatment with rapamycin (Rm) or ammonia (NH3) alone or in combination with ConA or untreated (ref). The quantification was performed using the Metamorph software and bar heights are plotted as mean number of eGFP-LC3 puncta per cell including ± one standard deviation. **P value < 0.01 according to the Student t test.
Identification of regulated phosphopetides by high-resolution mass spectrometry
To investigate the signaling mechanism of ammonia-induced autophagy, the initial protein phosphorylation changes induced by ammonia treatment was compared with changes associated with the well-known autophagy inducer and MTOR inhibitor, rapamycin. Information on quantitative changes in protein phosphorylation was enabled by differential labeling of 3 separate pools of cells with SILAC, keeping the light cell pool untreated and stimulating the medium and heavy cell pools with rapamycin and ammonia for 15 min, respectively. Cells were harvested and mixed in a ratio of 1:1:1 before cell lysis and fractionated into cytosol and nuclei to improve the coverage of phosphosite identifications. Proteins were digested using trypsin and the resulting peptides were subjected to several cycles of phosphopeptide enrichment by titanium dioxide (TiO2) micro-columns. The fractions were analyzed by high-resolution liquid-chromatography tandem mass spectrometry (LC-MS/MS) and the resulting raw data were processed to quantitate phosphopeptide ratios and determine phosphogroup site localization (Fig. 1A–C). Two technical replicates were performed, resulting in the identification of a total of 5901 unique phosphosites situated on 1931 proteins (Fig. 1D; Table S1). All sites were based on at least 2 quantification measurements and ~91% of the sites could be localized to a specific site with a probability of > 0.75. The overlap in phosphosite identifications between the 2 technical replicates was 80.5% indicating high reproducibility of the identifications. Approximately 76% of the phosphosites have been reported previously in the PhosphoSitePlus and Swiss-Prot databases, which supports the validity of the identifications. In addition, for the remaining new identified sites, approximately 74% could be either reidentified in a new phosphoproteomic data set generated using other autophagy-stimulating agents (unpublished data) or were predicted as phosphosites by the NetPhos algorithm (see Fig. S1). 11 Further, the distribution of serine, threonine, and tyrosine phosphorylation was found to be 85.7%, 13.6%, and 0.7% respectively, which corresponds well to previous observations. 10 From the 5901 identified phosphosites, 1550 were considered regulated as having ratios located in the extreme 5% tails of the distribution of peptide ratios (see Materials and Methods section). Among these regulated phosphosites, 175 sites were coregulated and 626 sites were specifically regulated by ammonia or rapamycin (exemplified in Fig. 1B) and grouped according to up- or downregulation for the further analysis as shown in Figure 1D. For a phosphosite to be considered specifically regulated as a result of ammonia or rapamycin we required the site to be significantly altered, both when compared with the reference and the other treatment based on significance B values as described in the experimental section. We did not perform a bioinformatic follow-up on the 749 sites with mixed responses, but focused the further analysis primarily on the specific effects of ammonia and rapamycin.
Rapamycin regulated phosphoproteins display a general dephosphorylation and MTOR signaling repression
By repressing the MTOR kinase with rapamycin, we expected to identify a number of especially downregulated phosphosites related to the MTOR signaling network. This was confirmed by applying several different bioinformatic analyses on the phosphoproteins and sites regulated specifically by rapamycin. First, more than half (64%) of rapamycin-specific regulated sites were dephosphorylated (Fig. 1D), which conforms well to the expected effect of a kinase inhibition. Next, the different regulated sites on proteins related directly to MTORC1 regulation or its downstream substrate RPS6KB1 were inspected and displayed in the overview of Figure 3A. From this overview it is clear that rapamycin caused a major dephosphorylation of proteins in close connection to MTOR, including already known MTORC1 and RPS6KB1 target sites and additional sites not previously associated with MTORC1 or RPS6KB1. In addition to Figure 3A, Table 1 lists all identified rapamycin regulated phosphoproteins, which have a confirmed or very likely relation to the MTOR repression response. Note the identified sites on substrates of RPS6KB1 and on 4E binding protein 1 (EIF4EBP1), which are both common marker proteins of MTOR activity. 30 The group of rapamycin-specific dephosphorylated proteins was further inspected by a sequence motif enrichment analysis using the MotifX algorithm, 12 (Fig. 3B) which revealed the RxRxxS motif to be most significantly enriched (34 motifs; 17-fold increase). This motif has previously been associated with RPS6KB1 but also AKT1 and ribosomal S6 kinase (RPS6KA1/2/3, formerly RSK). 31 , 32 Therefore, to associate the RxRxxS motif to RPS6KB1 with more certainty, we applied the NetworKIN algorithm, which besides sequence information also takes context information into account to predict kinase substrate relationships. 33 This analysis found only substrates of RPS6KB1 to be significantly enriched, predicting this kinase to be associated with the rapamycin-specific dephosphorylated proteins (localization probability threshold for phosphopeptides of 0.9 and a Benjamini-Hochberg corrected significance threshold of 0.001). In addition, a GO-term enrichment analysis on rapamycin-specific dephosphorylated proteins found the MTOR signaling cascade and regulation of translation initiation to be the most significantly enriched GO-terms (Fig. 4A). This result also fits with the expected rapamycin-mediated effect on MTOR and the signaling cascade downstream of MTOR known to regulate translation initiation. 45 The reproducibility of our data was supported by a comparison with Rigbolt KTG. et al., Hsu et al. and Yu et al. who all performed phosphoprotemics on rapamycin-treated cells (a figure summarizing the result of the comparison can be found in Rigbolt KTG, et al.). 15 , 46 , 47 The use of the same cell line and an intersecting stimulation time point, made the study of Rigbolt KTG, et al. particularly suitable for comparison and we found a very good ratio correlation between overlapping parts of our 2 studies, which included phosphosites on well-known MTOR substrates like RPS6KB1, EIF4EBP1, EIF4EBP2 and AKT1S1. Despite the use of different cell lines and experimental conditions in Hsu et al. and Yu et al., these studies also showed a good correspondence with our data, which demonstrates the robustness of our results. Overall, we find that the reproducibility of our data and the consistency between the expected effects of the rapamycin treatment and the results from the data analysis underlines the validity of the data and the chosen regulation thresholds.

Figure 3. The MTOR response to ammonia and rapamycin at the phosphorylation level. (A) Overview of specifically ammonia- or rapamycin-regulated sites on phosphoproteins immediately downstream of MTOR. The colored symbol above each phosphosite indicates if the site is regulated by ammonia or rapamycin and if it is up- or downregulated. All sites have been identified previously and underscored sites have been reported in the literature as regulated by the indicated kinases (for references see Table 1). (B) Result output from the sequence motif enrichment analysis on the group of rapamycin-specific dephosphorylated proteins using the MotifX algorithm. 12 Significantly enriched motifs is shown (P < 1E-06; binomial test), which are found using a sequence width of 13 and an occurrence threshold of 20 (default parameters in MotifX).
Table 1. List of rapamycin-regulated phosphosites with confirmed or likely relevance to the MTOR inhibition response.
| Gene namea | Phosphosite | Ratio | Evaluation on phosphoprotein or site regulation |
|---|---|---|---|
| AKT1S1 | S183 | 0.14 | MTOR regulated site 13 |
| AKT1S1 | T246 | 0.23 | AKT1 regulated site 14 |
| AKT1S1 | S88 T90 S92 S247 |
0.69 0.52 0.68 1.54 |
AKT1S1 is a component of the MTORC1 complex 13 |
| CCT2 | S260 | 0.20 | RPS6KB1 regulated site 15 |
| EIF2S2 | T111 | 0.76 | Translation initiation factor important for protein synthesis (Uniprot) |
| EIF3J | S11 | 0.73 | Association of eIF3j with eIF3 and the ribosome is blocked by rapamycin and it is likely that phosphorylation plays a role in these events 16 |
| EIF4B | S422 | 0.51 | RPS6KB1 regulated site 17 |
| EIF4B | S93 S406 T420 S447; S450 S503 |
1.34 0.72 0.53 0.55 0.69 |
Activated MTOR promotes phosphorylation of eIF4B, which contributes to its association with the translation pre-initiation complex 18 |
| EIF4EBP1 |
Y34
T45 T70 |
0.34
0.48 0.23 |
MTORC1 regulated site 15 |
| EIF4EBP1 |
T37
T46 S65 |
0.48
0.45 0.40 |
MTORC1 regulated site 19 |
| EIF4EBP2 |
T37
T41 T64 |
0.31
0.28 0.13 |
MTORC1 regulated site 15 |
| EIF4G1 | T209 T214 S1192 S1194 S1201 s1216 |
0.47 0.47 1.66 0.74 0.52 1.58 |
Role of phosphorylation in translation is not established, it may be required for efficient eIF4F formation in some tissues 20 |
| IRS1 | S3 | 0.52 | IRS1 can be phosphorylated by RPS6KB1 at several sites 21 |
| PDCD4 | S457 | 0.16 |
AKT1 regulated site. PDCD4 interacts with eukaryotic initiation factor 4A and inhibits protein synthesis
22
Phosphorylated on Ser67 by RPS6KB1 in response to mitogens and subsequently degraded 23 |
| PIK3C2A | S259 | 1.50 | Mitotic or stress-induced phosphorylation site signaling proteasome-dependent degradation of the protein 24 |
| RPS6 |
S235
S236 S240 S244 |
0.65
0.67 0.37 0.29 |
RPS6KB1 regulated sites 25 |
| RPS6 | S246 | 0.52 | RPS6 is involved in protein translation initiation and regulated by RPS6KB1 26 |
| RPS6KB1 | S427 S452 |
0.09 0.26 |
RPS6KB1 activation is initiated by MTOR/raptor-mediated phosphorylation of T389
27
Activation of RPS6KB1 appears to be first mediated by multiple phosphorylation in the autoinhibitory domain 424–525 (Uniprot). Rapamycin causes dephosphorylation of all RPS6KB1 sites 28 |
| RPTOR | S863 | 0.64 | MTOR regulated site 29 |
a The gene name of the phosphoproteins, the position of the phosphosites in the protein sequence, and their experimentally measured ratios are listed in the first, second, and third columns respectively. The fourth column indicates if any reports on relevant kinase regulation exist for the sites (rows in italic) or if the phosphoproteins are relevant to the rapamycin response in some other way.

Figure 4. GO-term enrichment analysis and identification of ammonia-specific phosphorylated MAPK1/3 targets. (A) Heatmap comparing the results of GO-term enrichment analyses on the groups of rapamycin-specific dephosphorylated proteins and the ammonia-specific phosphorylated proteins. The color code represent −log10 (P value) with the significance threshold set to a P value of 0.05. For the heatmap, the GO-terms have been filtered to include only the most specific terms for a more clear and meaningful output. The GO-terms in the boxes represent particularly interesting terms, which are discussed in the main text. (B) Overview of ammonia-specific regulated phosphoproteins with sites linked directly or indirectly to MAPK1/3 regulation in the literature. The colored symbol above each phosphosite indicates if the site is regulated by ammonia or rapamycin and if it is up- or downregulated. Proteins not identified in this study but representing central parts of the MAPK1/3 signaling cascade is shown in white with dotted outlines. Sites in yellow indicate that phosphorylation of the site enhances the activity of the protein. Sites with an underscore have been noted previously in the literature as regulated by MAPK1/3. 34 - 44
Ammonia does not induce major dephosphorylation of the MTOR signaling network
In the study by Eng and coworkers, ammonia-induced autophagy was found not to be mediated through MTORC1 repression, as investigated by western blot analysis on 3 MTORC1 target sites residing on AKT1, RPS6KB1, and EIF4EBP1. 7 Using quantitative phosphoproteomics, we aimed at obtaining a more detailed quantitative view of the effect of ammonia on the MTOR signaling network and its overlap with rapamycin. This was facilitated by the identification of many phosphosites regulated by rapamycin and/or ammonia on proteins closely connected to MTOR signaling as presented in Figure 3A. This overview clearly shows the differential effect of rapamycin and ammonia, with the most conspicuous difference being ammonia only downregulating very few sites, of which most were in fact significantly less downregulated as compared with rapamycin (Significance B ratio < 0.05). So even though a few of these sites are known MTOR target sites, this does not convincingly argue for MTOR repression. Another intriguing difference visible from Figure 3A is that ammonia, in contrast to rapamycin, was found to upregulate phosphosites on central players in the MTOR network including RPS6KB1, 40S ribosomal protein S6 (RPS6) and MTOR itself. Phosphorylation at Ser447 on RPS6KB1 is associated with its activated form 34 , 48 , 49 and phosphorylation on RPS6 at Ser235 and Ser240 is mediated by RPS6KB1, where Ser235 (and Ser236) phosphorylation is important for the function of RPS6 in translation initiation. 50 This indicates that ammonia does not lead to an inhibition of RPS6KB1 as seen with rapamycin, but perhaps even a slight upregulation. The 2 phosphosites on MTOR, which were upregulated by ammonia have been identified previously in large-scale mass spectrometry studies, 51 , 52 but no functional characterization has been performed. The sites are positioned in the Huntingtin, elongation factor 3 (EF3), protein phosphatase 2A (PP2A), and the yeast kinase TOR1 (HEAT) repeat domain of MTOR and they are predicted to be substrates of MAPK14 and GSK3B by NetworKIN (NetworKIN score of 8.5 and 5.9, respectively). This is in line with the GSK3B site being positioned in the preferred phosphorylation motif of GSK3B, S/TxxxS/T(p), where the fourth serine often is phosphorylated by another kinase, priming the phosphorylation of the first serine by GSK3B. 53 Interestingly, GSK3 has previously been involved in mediating proteasomal degradation of MTOR and other components in the cascade, resulting in induced autophagy. 54 In relation to this, studies have indicated that GSK3 often phosphorylates substrates of FBXW7 (an F-Box protein that constitutes the substrate specificity factor of cullin RING ubiquitin ligases), which binds the HEAT domain of MTOR. 54 , 55 Although highly hypothetical, it is tempting to speculate that a stress kinase like MAPK14 primes the phosphorylation of a GSK3 site in the HEAT domain of MTOR, leading to binding of FBXW7 and subsequent ubiquitylation and proteasomal degradation of MTOR. In any case, it would be interesting to further investigate the role of these regulated phosphosites located on one of the most central metabolic nodes.
Ammonia specifically induces MAPK3 activation
In contrast to rapamycin, the majority (67%) of ammonia-specific regulated sites were phosphorylated (Fig. 1D), which is interesting, as this does not mimic a typical starvation-like response or the repression of a kinase. It also suggests that the difference between the rapamycin and ammonia response could be found by focusing on the ammonia-specific phosphorylated proteins. GO-term enrichment analysis was performed in the same way as for proteins with rapamycin-specific downregulated phosphosites and the results compared in Figure 4A. Two out of the 3 common significant GO-terms were “TOR signaling cascade” and “regulation of translation initiation.” These terms were associated with opposite regulated groups of phosphosites (downregulated and upregulated) for rapamycin and ammonia, respectively, and highlight the difference between the rapamycin and ammonia response, regarding MTOR signaling. For the ammonia-specific GO-terms we found a special interest in the terms related to RHO protein signal transduction (as explained in the next section) and RAS signaling; the latter because we identified both MAP2K2/MEK2 and MAPK3, which are key components of the Ras signaling cascade. MAPK3 was identified with 2 ammonia-specific upregulated phosphosites on Thr202 and Tyr204, known to be phosphorylated by MAP2K1/2, causing activation of the protein. 35 This strongly indicates that MAPK3 is activated in response to ammonia treatment, which would be in line with the cells not completely shutting down their growth program during ammonia-induced autophagy as suggested by Mariño G, et al. 56 In further support of ammonia-mediated MAPK3 activation we found many previously described MAPK3 substrates among the ammonia-specific phosphorylated proteins (Fig. 4B). Moreover, studies in rat astrocytes have revealed increased phosphorylation of MAPK1/3 during treatments of low millimolar concentrations of ammonia. 57 , 58
As the production of ammonia is often upregulated in cancer cells it is interesting that we find strong indications of increased MAPK1/3 activity, as MAPK1/3 has been linked to many cancer-related processes such as proliferation, cell survival, migration, and oncogenic transformation. 59 , 60 In line with this, the possible ammonia-induced MAPK1/3 regulated substrates (Fig. 4B) include the transcription factors JUN and ELK1, which are important for regulating cell proliferation and oncogenic transformation. 61 Interestingly, the previously mentioned Ser447 on RPS6KB1, which is phosphorylated during its activation, has also been described as an MAPK3 target, indicating that MAPK3 could be involved in the upregulation of this site and the activation of RPS6KB1. Besides growth responses, JUN, ELK1, and the third possible MAPK1/3 regulated transcription factor STAT1, can be linked to stress signaling, 36 , 62 , 63 which could support cancer cell survival. Related to the effect of MAPK1/3 on proliferation and migration, phosphorylation of Ser16 and the ammonia-specific upregulated sites Ser25, Ser38 and Ser63 on STMN1 has been found to suppress the proteins inhibitory effect on microtubule polymerization and stimulate cell proliferation. 64 The ammonia-specific upregulated Ser418 phosphosite on CTTN regulates actin nucleation and has together with Ser405 been found to be important for cancer cell motility and adhesion. 37 This is also true for the ammonia-specific phosphorylation at Ser2152 on FLNA, which is necessary for membrane ruffling and has been linked to cancer cell migration. 38 In summary, these findings suggest a link between the metabolic byproduct ammonia and the activation of a signaling cascade and downstream substrates, which supports oncogenic transformation and the implication of glutamine metabolism in cancer. 7
Beside the relation to cancer, MAPK1/3 has been assigned a dual effect on autophagy as this kinase has been shown to work both as an inhibitor and an inducer of autophagy. 65 , 66 To test if MAPK3 could be responsible for the ammonia-induced autophagy, we performed fluorescence microscopy on MCF-7 eGFP-LC3 cells treated with both 4 mM ammonia and the MAP2K1/2 inhibitor U0126 (Fig. 5). A control blot of U0126 was further performed as shown in Figure S2A. No visible effect of the inhibitor was observed when compared with ammonia-treated cells without inhibitor (Fig. 5A), even though quantifications revealed a small but significant decrease of eGFP-LC3 puncta as a response to MAP2K1/2 inhibition (Fig. 5B). However, no significant change was found when the treatments were combined with ConA, indicating that MAPK1/3 is not influencing autophagic flux. Also, ammonia in combination with U0126 still induced a relatively large number of autophagosomes as compared with the reference, which increased significantly when adding ConA. Altogether this does not point toward a role of the MAP2K-MAPK1/3 pathway as the primary mediator of ammonia-induced autophagy. Studies investigating the effect of ammonia on rat astrocytes have, besides increased MAPK1/3 phosphorylation, also shown that MAPK14 phosphorylation is increased. As MAPK14 previously has been associated with autophagy regulation, we investigated if MAPK14 could play a role during ammonia-induced autophagy. Stimulating MCF-7 eGFP-LC3 cells with ammonia in combination with MAPK14 inhibitor SB203580 resulted in a significant increase in autophagosome accumulation as compared with ammonia alone and a phenotype characterized by very large circular structures (Fig. 5A and B). A control blot of SB203580 was performed as shown in Figure S2B. This result is in agreement with recent work showing that MAPK14 negatively regulates autophagy at the level of autophagosome formation by competitively binding SUPT20H/FAM48A; a protein found to be required for ATG9A trafficking and autophagosome formation during starvation. 67 In addition, inhibition of MAPK14 by SB203580 has previously been associated with autophagic cell death as characterized by the accumulation of large cytosolic vacuoles. 68 With this in mind, it is tempting to speculate that MAPK14 play a role in dampening the ammonia-induced autophagic response by decreasing ATG9A activity.

Figure 5. Testing the effect of MAPK1/3 and MAPK14 on ammonia-induced autophagy. (A) Fluorescence microscopy of MCF-7 eGFP-LC3 cells during ammonia-induced autophagy combined with MAPK1/3 or MAPK14 inhibition. As indicated on each picture, cells were kept either unstimulated (Ref) or treated with 4 mM ammonia (NH3) or 10 µM of the MAP2K1/2 and MAPK1/3 inhibitor U0126 alone or in combination with 4 mM ammonia or 10 µM of the MAPK14 inhibitor SB203580 alone or in combination with 4 mM ammonia. (B) Quantification of eGFP-puncta in MCF-7 eGFP-LC3 cells kept either untreated (Ref) or treated for 3 h with ammonia (NH3) alone or in combination with ConA and/or kinase inhibitors U0126 and SB203580 as indicated. The quantification was performed using the Metamorph software and bar heights are plotted as mean number of eGFP-LC3 puncta per cell including ± one standard deviation. **P value < 0.01 according to the Student t test.
Implications of ammonia in the regulation of cell structure and motility
To extract more features from the group of proteins with ammonia-specific upregulated phosphosites, we performed a MotifX analysis on this group, which revealed a number of significant motifs (Fig. 6A). The most significantly enriched motif was SPT, which to our knowledge has not been described previously. To investigate if any particular features could be linked to this motif, a GO-term enrichment analysis was performed on all proteins with ammonia-specific phosphorylations situated in this motif. A heat-map was used to compare the significant GO-terms for proteins with the SPT motif and those with only an SP motif (not including the SPT motif) to reveal any specific terms associated with “SPT”-proteins (Fig. 6B). Interestingly, Cellular Component (CC) GO-terms showed that the “SPT”-proteins were associated with the ULK1-ATG13-RB1CC1/FIP200 complex but also cytoskeleton and cell projection terms. To investigate if the same result would appear on a more global scale and in a more distant related organism, we performed a similar analysis, extracting all human or yeast proteins with at least one SPT or SP (not including SPT) motif from the Swiss-Prot database. Surprisingly, for both human and yeast globally, a high number of terms recurred, which were identical or related to the cytoskeleton and cell projection terms above (Figs. S3 and S4). It should be noted that cytoskeleton and cell projection terms was found significant for SP proteins if not excluding “SPT”-proteins (data not shown), however as obvious from Figure 6B and Figures S3 and S4, this feature disappeared from “SP”-proteins when excluding the subgroup of “SPT”-proteins. This may suggest that SPT is a general motif specifically associated with cytoskeleton- or otherwise cell structure-related proteins and it is tempting to speculate that the SPT motif may allow or direct a certain type of regulation, although this hypothesis would need further investigation.

Figure 6. Morif enrichment analysis of ammonia-specific phosphorylated proteins. (A) Result output from the sequence motif enrichment analysis on the group of ammonia-specific phosphorylated proteins using the MotifX algorithm. 12 Significantly enriched motifs is shown (P < 1E-06; binomial test) with either serine (S) or threonine (T) as central character, a sequence width of 13 and an occurrence threshold of 20 (default parameters in MotifX). (B) Heatmap comparing the results of Cellular Component GO-term enrichment analyses on the 2 groups of ammonia-specific phosphorylated proteins containing either a phosphorylated SPT-motif or a SP-motif (not including SPT). The color code represent –log10(P value) with the significance threshold set to a P value of 0.05. The GO-terms in the red box indicates the group of significant enriched terms, which are specific for the proteins with the SPT-motif.
With the finding of a novel phosphorylation motif, associated specifically with proteins enriched in CC-GO terms for cell structure and motility, it was interesting also to find Rho protein signal transduction among the ammonia-specific enriched GO-terms in Figure 3A. The Rho family of GTPases constitutes around 20 members in mammals, which regulates the actin cytoskeleton and participates in various cellular processes including cell proliferation, apoptosis, cell shape, and motility. 69 Table 2 lists identified proteins with ammonia-specific upregulated phosphosites, which could be linked to Rho protein signal transduction. No functional characterization of the regulated phosphosites has been reported, which complicates an interpretation of their influence on the proteins in question. However, the majority are guanine nucleotide exchange factors (GEFs), which promote the activity of Rho GTPases. 69 In the section above, possible MAPK1/3 substrates with relation to cell motility were identified and in this context it is interesting that MAPK1/3 signaling, through coordinated regulation of RAC1 and RHOA activity, has been found previously to mediate increased cell motility and enhance the metastatic properties of cancer cells. 59 , 71 Further, the RxxS motif, which is significantly enriched for proteins with ammonia-specific upregulated phosphosites (Fig. 6A), has among others been described to direct Rho-associated protein kinase (ROCK); the major effector of RHOA. 72 Also, it is interesting that the RxxS motif is found significantly enriched for both proteins with ammonia-specific upregulated phosphosites and rapamycin-specific downregulated sites, suggesting a differential kinase/phosphatase regulation.
Table 2. List of proteins with ammonia-specific upregulated phosphosites, which can be linked to Rho protein signal transduction.
| Gene namea | Phosphosite | Ratio | Protein function related to Rho protein signal transduction |
|---|---|---|---|
| AKAP13 | S2709 | 1.62 | Exerts guanine nucleotide exchange factor (GEF) activity on the Rho/Rac family of small GTP binding proteins, to exchange GDP with GTP and activate the GTPase (Uniprot) |
| ARHGAP29 | S913 | 2.77 | Exerts GTPase activity on RHOA and to a less extent on Rac1 and CDC42, resulting in a conversion to the inactive GDP-bound form (Uniprot) |
| ARHGEF35 | S450; S452 | 1.59; 1.50 | GEF (Uniprot) |
| ARHGEF5 | S450 | 1.64 | GEF (Uniprot) |
| ARRB1 | T412 | 1.56 | Involved in the activation of RhoA 70 |
| CDC42EP4 | S174 | 1.74 | Interacts with CDC42 and RHOQ and possibly act as a downstream effector of CDC42, regulating cell shape through actin filament assembly (Uniprot) |
| MTOR | T1162; S1166 | 2.37; 2.21 | The MTORC2 complex seemingly acts upstream of Rho GTPases by activating GEFs, leading to regulation of the actin cytoskeleton (Uniprot) |
| TRIO | S2455; S2455 | 1.53 | GEF for RAC1 and RHOA, possibly involved in induction of cell migration and growth (Uniprot) |
| VAV2 | S781 | 1.42 | GEF for the Rho family of Ras-related GTPases, is involved in vascular endothelial cell migration and assembly (Uniprot) |
a The gene name of the phosphoproteins, the position of the phosphosites in the protein sequence, and their experimentally measured ratios are listed in the first, second, and third columns respectively. The fourth column summarizes shortly the function of the protein in respect to Rho protein signal transduction.
From the results presented above, we hypothesized that ammonia could mediate an effect of the regulation of the cytoskeleton and perhaps induce changes in cell motility. The identification of an ammonia-specific, upregulated phosphosite on the solute carrier family 9, subfamily A (NHE1, cation proton antiporter 1), member 1 (SLC9A1) reported to be regulated by the MAP2K gene family (also termed MEK)-MAPK1/3-RPS6KA gene family pathway and cause increased cell motility in many cell lines including human breast carcinoma cells, further pointed in this direction. 39 , 73 To investigate this hypothesis and support the validity of our phosphoproteomic data and bioinformatic analysis, we performed a number of wound-healing experiments on cells treated with ammonia or preincubated for 1 h with ammonia. While a continuous presence of ammonia were found to significantly slow down wound closure after 25 h, the incubation of cells in ammonia for 1 h followed by a change to normal medium was found to have the opposite effect and increase wound closure significantly after 12 h (Fig. S5A and S5B). While the former result conforms to reports of alkaline environments inhibiting cell migration, the latter result is consistent with a short pre-pulse of ammonia increasing cell motility through the activation of SLC9A1. 73 , 74 Because the ammonia-specific upregulated site on SLC9A1 implied an involvement of MAPK1/3 in cell motility, we tested the effect of ammonia preincubation in the presence of the MAP2K and MAPK1/3 inhibitor U0126. As hypothesized, we found U0126 to abolish the increased wound closure found when preincubating with ammonia alone (Fig. S5B), which demonstrates the applicability of our data to generate useful hypotheses. In summary, our results suggest that ammonia induces phosphorylation of a novel motif linked to cytoskeleton-associated proteins and affect cytoskeleton regulation and cell motility, which could represent a novel response to ammonia with consequences for tumor progression.
Evaluation of the possible molecular mechanisms of ammonia-induced autophagy points at ER stress as the primary driver of the process
The previous sections provided new information on signaling during the ammonia response, but with no apparent link to autophagy-induction. However, the data did contain several findings of interest with respect to autophagy. One was the finding of sequestosome-1 (SQSTM1) in the group of coregulated phosphorylated proteins (Fig. 1D), which is interesting as this protein is involved in mediating autophagosomal cargo selectivity. 75 The identified regulated site on Ser272 has not been functionally characterized but it is tempting to speculate that its phosphorylation plays a fundamental role in autophagy due to its coregulation by 2 very different autophagy-inducers. Also, our data contained findings that could form the basis of new hypothesis about the signaling mechanism responsible for ammonia-induced autophagy as summarized in Figure 7. The first was established as we found that ammonia was reported to disturb the cellular energy homeostasis in several ways, e.g., by inducing a futile cycle by competition of the ammonium ion with K+ for binding the Na+K+-ATPase in the cell membrane. 76 In line with this, we identified an ammonia-specific upregulated phosphosite at Ser108 on the β subunit of AMPK. Phosphorylation of this site has previously been described as important for the activity of this kinase, 77 which suggests that ammonia could lead to increased activation of AMPK. This could be one route to autophagy as AMPK recently has been linked to autophagy induction through regulation of ULK1. 78

Figure 7. Schematic illustration of the hypotheses for the connection between ammonia and the induction of autophagy. The first route from ammonia to autophagy could be mediated by a disturbance in the energy homeostasis as ammonia was found to upregulate a phosphosite on AMPK, which has been described to be involved in activating AMPK. The disturbance in energy homeostasis could be established as the ammonium ion competes with K+ for entry into the cell via the Na+K+-ATPase. Finally, increased activity of AMPK could ultimately lead to autophagy induction. The second route to autophagy was hypothesized to go through an ammonia-mediated induction of ER stress. The strongest indication of this was the identification of an ammonia-specific upregulated phosphosite (Ser715) on the central UPR protein EIF2AK3, which could indicate EIF2AK3 activation. Activation of the EIF2AK3 branch in particular makes sense during a response to increased levels of ammonia as it leads to upregulation of the transcription of asparagine synthase, which aids in lowering ammonia levels. Further, the asparagine synthase catalyzes a reaction which produces AMP, representing a hypothetical link to AMPK activation.
The second hypothesis was derived from the thought that alterations in pH and osmotic strength caused by ammonia could have the potential to induce ER stress and the unfolded protein response (UPR), which in turn could lead to autophagy. In connection to this, we found that ammonia has been reported to increase the production of activated sugars, which is suggested to disturb protein secretion and glycosylation. 76 Further support of ER stress was gained as we identified a number of proteins related to the UPR in the group of proteins with ammonia-specific upregulated phosphosites. The heat shock protein 27 (HSPB1) was identified with 4 ammonia treatment-specific upregulated phosphosites at Ser15, Ser65, Ser82, and Ser83 of which Ser15 and Ser82 has been shown previously to be phosphorylated during ER stress. 79 Furthermore, the vesicle-associated membrane protein-associated protein B/C (VAPB), which has been linked to the induction of UPR, 80 was identified with a strongly upregulated ammonia treatment-specific phosphosite. Also, the EIF2AK3/PRKR-like endoplasmic reticulum kinase, which represents one of the 3 branches mediating the UPR in mammalian cells, was identified with an ammonia-specific upregulated phosphorylation at Ser715. Even though the site has not been functionally characterized, it is located in the kinase domain, which is known to be autophosphorylated upon activation of the kinase and induction of the UPR. 81 Further, the site has been used previously as a marker of EIF2AK3 activation and ER stress. 82 It is therefore likely that EIF2AK3 is activated in response to ammonia and it is tempting to speculate that this further leads to an induction of autophagy. Interestingly, the specific activation of the EIF2AK3 branch of the UPR is known to increase the expression of asparagine synthetase. 83 This enzyme catalyzes the synthesis of asparagine from aspartate and glutamine in a process that functions to regulate the intracellular level of ammonia by incorporation into asparagine. As the reaction requires ATP, which is converted to AMP + PPi, an upregulation of this process creates a possible link to the proposed activation of AMPK. Further, the hypothesis of ER stress could be linked to the upregulation of MAPK3 phosphorylation as it has been shown previously that EIF2AK3, through EIF2S1 phosphorylation, induces MAPK1/3 phosphorylation and activation. 84 Also, MAP2K-MAPK1/3 has been found previously to inhibit ER stress mediated apoptosis, which in such case makes an upregulation of this pathway beneficial for cell survival during a likely ammonia-induced ER stress response. 85 To further build up support of UPR induction during ammonia stimulation, we performed western blots against the common ER stress markers DDIT3 and HSPA5 at different time points in lysates of ammonia-treated MCF-7 eGFP-LC3 cells (Fig. 8). We found that the expression of both markers increased after 30min of ammonia stimulation, which supports the results from the phosphoproteomic data and indicates a relatively fast induction of ER stress. As ER stress previously has been linked to the induction of autophagy 86 , 87 this is a strong candidate for being the primary driver of ammonia-induced autophagy. Still, identifying the causal link between ER stress and ammonia-induced autophagy remains an open point for further investigation.
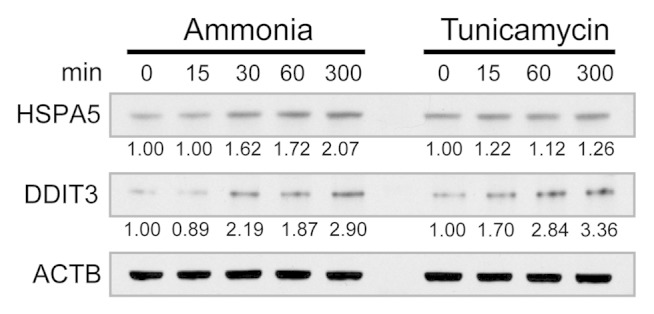
Figure 8. Expression levels of the ER stress markers HSPA and DDIT3 during ammonia treatment. MCF-7 eGFP-LC3 cells were treated with 4 mM ammonia or 5 µg/mL tunicamycin (positive control) for the indicated time intervals and cell lysates were investigated by western blotting with antibodies for HSPA5, DDIT3, and ACTB. The protein expression levels were quantified densitometrically, normalized to reference protein level (ACTB) and renormalized to HSPA5 or DDIT3 protein level at time 0 for each treatment.
Discussion
Ammonia is not just a chemical substance with potential toxic properties, but also a compound of physiological relevance due to its formation during amino acid catabolism. Even though ammonia mostly has been classified as a simple metabolic by-product, the recent discovery of its role in cancer and autophagy induction underscores the relevance of a further investigation of its cellular effects in this context. In the present study a quantitative phosphoproteomics approach was applied to investigate the cellular response during ammonia-induced autophagy. Due to ammonia’s suggested MTOR-independent induction of autophagy, the MTOR inhibitor rapamycin was used as a reference treatment to reveal specific differences between the 2 treatments. A number of rapamycin-specific downregulated phosphosites on MTOR or RPS6KB1 target proteins, clearly indicated a repression of MTOR activity, while most of the same sites were not affected by ammonia. Instead, ammonia seemed to induce more protein phosphorylation than dephosphorylation and the upregulation of 2 activating phosphorylations on MAPK3 (Thr202, Tyr204) strongly suggested increased activity of the MAP2K-MAPK3 part of the Ras signaling cascade. This was further supported by the presence of several possible MAPK1/3 substrates containing ammonia-specific upregulated phosphosites. Activation of MAPK1/3 is an interesting effect of ammonia which could be relevant to both cancer and autophagy. With respect to the former we identified several ammonia-specific phosphorylated proteins related to Rho protein signal transduction and possible MAPK1/3 targets linked to cytoskeleton regulation and cell motility. Further, the ammonia-specific phosphorylated proteins where significantly enriched in a novel phosphorylation motif SPT, which GO term analysis suggested could be linked specifically to cytoskeleton associated proteins in both human and yeast. These results suggested an implication of ammonia in cell motility with a possible dependency of MAPK1/3, which we were able to support through a number of wound-healing assays. With respect to the role of MAPK1/3 in autophagy, previous studies have assigned both positive and negative regulatory roles of this kinase in the process. We therefore tested the effect of MAPK1/3 on autophagy and found a small but significant impact, which however did not suffice to qualify it as the primary driver of ammonia-induced autophagy. Instead we looked through our other phosphorylation sites which were specifically regulated by ammonia and found a number of upregulated phosphosites on proteins associated to the UPR, including Thr715 in the kinase domain of EIF2AK3. We speculated that ER stress would be a sensible cellular response to an increase in a potential toxic and alkaline substance as ammonia and further it is a process which has previously been linked to autophagy induction. Therefore, we tried to confirm the activation of the UPR by western blots against the ER stress markers DDIT3 and HSPA5 and found increased expressions for both proteins already after 30 min of stimulation with ammonia, which fits to the timeframe in which ammonia induces autophagy. We find that these results points out ER stress as a very likely candidate as the primary driver of ammonia-induced autophagy. Further, an additional contribution to autophagy induction could involve activation of the energy-sensing kinase AMPK as we also identified an ammonia-specific upregulated phosphorylation (Ser108) on the PRKAB1 subunit, which has previously been associated with increased AMPK activity. In summary this study is a resource measuring the phosphoproteomic response to ammonia and rapamycin. Although a simple metabolic byproduct; ammonia seems to have unanticipated effects, not only by the induction of autophagy but also on cellular signaling with relevance to cancer cell biology. How metabolites affect the interplay between autophagy, metabolism, and cancer by modulating the regulatory pathways is a complex problem, and the identification of which proteins are regulated in response to the different stimuli can improve our understanding of how the cell is wired for survival.
Materials and Methods
Cell cultivation and SILAC-labeling
Three populations of MCF-7 eGFP-LC3 cells (expressing functional BECN1) were SILAC-labeled by cultivation in arginine-, lysine- and methionine-free RPMI medium (Gibco, 041-95671) supplemented with either L-Lys and L-Arg (Light), L-Arg-13C6 and L-Lys-2H4 (Medium) or L-Arg-13C6- 15N4 and Lys-13C6-15N2 (Heavy) in the concentration 1:1500. Further, the medium was supplemented with methionine 1:1000, 10% dialysed fetal bovine serum (Gibco, 26400-044), 1% L-glutamine (BioWhittaker, Lonza, BE17-605E) and 1% penicillin/streptomycin (RPS6KB110,000 U/mL and 20 µg/mL respectively) (BioWhittaker, Lonza, DE17-602E). Full labeling was obtained by cultivating the cells for at least six generations in SILAC-RPMI before use. 88 For the phosphoproteomics experiment, 8 15 cm dishes of confluent MCF-7 cells were used for each of the 3 SILAC-labeled populations and stimulations where performed for 15 min with 0.55 µM rapamycin (Sigma Aldrich, R0395) for the medium-labeled and 4 mM ammonia (JT Baker, JT-9726-5) for the heavy-labeled cells. The concentration of rapamycin used here was higher than the 0.1 to 0.2 µM used in other studies to ensure a fast induction of the cellular response within the short stimulation time. 15 , 47
Cell harvesting, protein extraction, and digestion
Cells from the 3 differentially treated populations were harvested on ice and pooled 1:1:1 in lysis buffer [0.25 M sucrose, 1 mM EDTA, 20 mM 4-(2-hydroxyethyl)-1-piperazineethanesulfonic acid (HEPES), pH 7.4] supplemented with 1× complete protease inhibitor cocktail tablet (Roche, 11697498001) and phosphatase inhibitors (1 mM sodium orthovanadate, 5 mM β-glycerophosphate and 5 mM NaF). Cells were pelleted by a 10 min centrifugation at 300 g at 4 °C before resuspension in lysis buffer and lysed by a hand-held dounce homogenizer using 100 strokes. The nuclear and cytoplasmic fractions of the cell lysate were separated in the pellet and supernatant fractions, respectively by a 600 g centrifugation for 10 min at 4 °C. The pelleted nuclei were sonicated 3 × 10 s with 20 s rest on ice in between sonication and both nuclear and cytoplasmic fractions were filtrated through a 45 µM filter. Proteins were extracted by acetone precipitation by adding 4 volumes of ice-cold acetone to the nuclear and cytoplasmic fractions, pelleting the precipitate by 12,000 g centrifugation and washing with ice-cold acetone/water 4:1 twice before drying the protein pellets in a benchtop SpeedVac centrifuge. Protein pellets were prepared for digestion by dissolving in trifluoroethanol (Sigma Aldrich, T63002) and water 1:1 supplemented with 0.1% deoxycholate, followed by dilution in 50 mM ammonium bicarbonate. Proteins were reduced and alkylated using 5 mM dithiothreitol and 1 mM iodoacetamide, respectively. Proteins were digested ON at 37 °C with trypsin (Promega, V5111) 1:100 (w/w) and the resulting peptides were desalted and concentrated on C18 SepPak cartridge (Waters, WAT051910) using a published procedure. 89
Phosphopeptide enrichment and sample preparation for mass spectrometry
The enrichment of phosphopeptides was performed by 12 sequential rounds of TiO2 micro-chromatography, each round using a modified method from. 90 Briefly peptides were dissolved in 30% acetonitrile (ACN) (Fisher Chemicals, A/0626/17X)/ 1% trifluoroacetic acid (TFA) (Sigma Aldrich, T6508) and incubated 15 to 30 min with Titansphere beads (GL Sciences, 5020-75010) suspended 1:1 (w/w) in equilibration buffer (50 mg/ml 2,5-dihydroxybenzoic acid, 80% ACN, 1% TFA) with beads:protein being approximately 5 mg:10 mg in the first round, while decreasing the amount of beads added in the next rounds (a minimum of 0.5 mg beads were used). The flow-through was saved and used for the next round of TiO2 enrichment, while beads were washed with washing buffer (60%ACN, 1%TFA) and the phosphopeptides eluted with elution buffer (40%ACN, 15%NH4OH). The 12 phosphopeptide fractions were dried at 30 °C and dissolved in A* (2% ACN, 0.3% TFA) before the mass spectrometric analysis.
Mass spectrometry
Mass spectrometric analysis was performed on a linear trap quadropole (LTQ) Orbitrap XL or an LTQ Orbitrap Velos (Thermo Fisher Scientific). Both equipped with a nano-electrospray ion source (Thermo) coupled to an Agilent 1100 or 1200 Nanoflow system (Agilent Technologies). An autosampler loaded peptides onto the LC-system with a nanoscale reversed phase high performance liquid chromatography column packed in a fused silica capillary (ReproSil-Pur® 3 µm, r13.aq, (Dr Maisch, Ammerbuch, Germany) with 75-µm inner diameter and a length of 15 cm. Peptides were eluted during a 140 min linear gradient of solvent A (0.5% acetic acid in milliQ-water) and B (80% ACN and 0.5% acetic acid in milliQ-water) with a flow of 250 nl/min. Upon elution of the peptides into the mass spectrometer, the peptides were ionized using a voltage of 2.3 kV and no sheath and auxiliary gas flow. Spectra were recorded in positive ion mode with data-dependent acquisition automatically switching between recording an MS survey scan of the precursor ions in the Orbitrap and carrying out MS/MS on the 5 (LTQ) or 15 (Velos) most intense ions in the LTQ/Velos by collision-induced dissociation. The mass range was set to 300 to 2000 m/z at a resolution of 60000 at 400 m/z and a target value of 1 × 10⁶ ions for survey scans in the Orbitrap and 7000/5000 for collision-induced dissociation in the LTQ/Velos. Singly charged ions or ions with unassigned charge state were excluded from MS/MS. For phosphopeptide detection, multistage activation was enabled with a neutral loss mass list of m/z 32.33, 48.99, and 97.97.
Data processing using MaxQuant and Mascot
The raw data from the mass spectrometric analysis was processed using the MaxQuant software v. 1.0.13.13 91 and Mascot (Matrix Science). In the Quant module of MaxQuant, parameters were set as follows: Triple SILAC with Arg6/Lys4 and Arg10/Lys4 as labels, a maximum of 2 missed cleavages, filtering of MS/MS spectra to retain only the 6 most intense peaks per 100 Da, MS/MS mass tolerance of 0.5 Da, methionine oxidation, protein N-term acetylation and serine, threonine, and tyrosine phosphorylation as variable modifications and cysteine carbamidomethylation as fixed modification. The generated peak lists were searched against a forward and reversed human IPI database v. 3.69 supplemented with known contaminants using the Mascot search engine v. 2.3.02. Protein identifications from Mascot were submitted to the MaxQuant Identify module using the following parameters: Protein and peptide false discovery rate of 0.01, posterior error probability based on Mascot score, minimum peptide length of 6, minimum score of 7, minimum unique sequence of 1, minimum peptides of 1, use of both unmodified and modified peptides (except phosphorylated peptides) for protein quantification, use of both Razor and unique peptides for quantification, a minimum ratio count of 2 and site quantification using least modified peptide.
Filtering phosphopeptide identifications
Due to the short stimulation time it was assumed that only a limited level of protein synthesis and degradation would take place and therefore phosphopeptide ratios were not normalized to protein levels. The validity of this assumption was tested as shown in Figure S6, which indicates that phosphopeptide ratios in general were not affected by normalization to protein levels. Still, some extreme ratios were present to the left of the medium/light and heavy/light ratio distributions, suggesting either a degradation of a limited number of proteins or more likely the presence of unlabelled contaminants introduced during sample preparation (Fig. S7). The latter was consistent with the absence of left-skewed tailing for the heavy/medium ratio distribution but as limited protein degradation could not be completely excluded, the phosphopeptides of outliers was not included in any further analysis. To define which proteins were likely outliers, a robust standard deviation was calculated for the main distributions of nonphosphopeptide ratios as described in reference 91 to get an estimate of the effect of the technical variability on the peptide ratios. The obtained standard deviations from the three treatment types of ratios were all close to the estimate of 20% quantification error reported previously. 10 Proteins with ratios more than 2 standard deviations away from the center of the distribution were considered to be possibly affected by degradation or synthesis and therefore excluded. Only 10 phosphoproteins did not meet these criteria, which in addition did not include proteins of any apparent interest to this study.
Setting thresholds for phosphopeptide regulation
Phosphopeptides were generally considered regulated below a MaxQuant calculated Significance B threshold of 0.05. Using Significance B for evaluation of regulation has the advantage that this measure takes the peptide ratio dependency on ion intensity into account. 91 A Significance B threshold of 0.05 regards ratios as regulated if located beyond the extreme 5% tails in intensity binned distributions of unregulated phosphopeptide ratios. These ratios are assumed normally distributed 91 and the validity of this assumption was tested as shown in Figure S8. To extract the phosphosites that were regulated uniquely in response either to rapamycin or ammonia, a phosphopeptide ratio was required to have a Significance B of < 0.05 with respect to both the untreated reference and the alternative treatment. This resulted in 4 groups of phosphosites being specifically up- or downregulated in response to either the rapamycin or ammonia treatment, giving a total of 626 treatment-specific regulated phosphosites (Fig. 1D). In the same way, coregulated sites were required to have a Significance B < 0.05 for both treatments resulting in 175 coregulated sites, which could be grouped as either down- or upregulated. In this study, the regulation thresholds described above was used for all bioinformatic analysis, which should be relatively robust to the presence of false positives. However, whenever reporting specific regulated phosphosites a localization probability > 0.75 was required and an additional regulation threshold was applied, as described below, to ensure high confidence in the reported regulations. Since some phosphopeptides with Significance B < 0.05 can display ratios which are close to the 20% quantification error estimate, an additional regulation threshold was required for the subset of phosphopeptides with ratios within 2 times this estimated quantification error.
To limit the possibility that these ratios were a result of quantification error, rather than biological regulation, at least 7 quantifications for this subset of phosphopeptides were required. This number of quantifications was based on the evaluation of ratio correlation between the 2 technical replicates as a function of ratio quantifications (Fig. S9). The plot shows that 7 or more quantifications gives an R2 of approximately 0.87 for the three treatment ratios, while increasing the threshold to e.g., 12 quantifications only gives limited further improvement with R2 increasing to approximately 0.9.
Western immunoblotting
Confluent MCF7-eGFPLC3 cells were stimulated with 4 mM ammonia for 0, 15, 30, 60, 300 min; with 5 ug/mL tunicamycin (Sigma, T7765) for 0, 15, 60, 360 min; 120 min incubation with or without 10 uM U0126 (Sigma-Aldrich, U120); 30 min incubation with 400 mM D-sorbitol (Fluka, 85532) after 60 min preincubation with or without 10 uM SB203580 (Sigma-Aldrich, S8307). The cells were lysed with RIPA buffer supplemented with Complete protease inhibitors (Roche, 05 056 489 001) and Phosstop phosphatase inhibitors (Roche, 04 906 845 001). The proteins were separated on Nupage 4–12% Bis-Tris gels (Invitrogen, NP0332BOX) and transferred onto Hybond-ECL nitrocellulose membrane (GE Healthcare, RPN303D). After 1 h incubation in BSA-TBST blocking buffer (5% w/v bovine serum albumin in 50 mM Tris-buffered saline (pH 7.4), 0.1% Tween-20), the membranes were incubated with antibodies, followed by a horseradish peroxidase (HRP)-conjugated donkey anti-rabbit IgG (GE Healthcare, NA934) or sheep anti-mouse IgG (GE Healthcare, NA931V). The bands were visualized by using chemiluminescence detection reagents (GE Healthcare, RPN2106). Antibodies used: ACTB (mouse, Santa Cruz Biotechnology, clone C4, sc-47778), DDIT3 (mouse, Cell Signaling, 2895), HSPA5 (rabbit, Cell Signaling, 3177), phospho-MAPK1/3 (Thr202/Tyr204) (rabbit, Cell Signaling, 9101), MAPK1/3 (rabbit, Cell Signaling, 9102), phospho-MAPKAPK2 (Thr222) (rabbit, Cell Signaling, 3316), and MAPKAPK2 (rabbit, Cell Signaling, 3042). The levels were normalized by densitometry to the reference protein levels (ACTB or the protein itself for the phospho-specific antibodies) using ImageJ.
Fluorescence microscopy
Cells were cultured in Lab-Tek 8-chambered coverglass (Nunc, Thermo Scientific, 155411) and treated with either 0.55 µM rapamycin, 4mM ammonia alone or in combination with 10 µM MAP2K1/2 inhibitor U0126 (Sigma-Aldrich, U120) or 10 µM MAPK14 inhibitor SB203580 (Sigma-Aldrich, S8307). Twenty nanometers ConA was further added to the treatment with rapamycin, ammonia alone or in the combinations of ammonia with the kinase inhibitors. Fluorescence microscopy was performed on a Zeiss Observer.Z1 microscope (Zeiss) using a total magnification of 320×.
Wound-healing assay
MCF-7 eGFP-LC3 cells were cultured in light SILAC medium until reaching confluence. Ten micrometers U0126 and 4 mM ammonia were added 2 and 1 h before wound creation, respectively, and after wound creation U0126 was reintroduced. Twenty wounds were created in each dish using a p10 pipette tip and phase contrast microscopy pictures were recorded immediately after (representing time point zero) using a Zeiss Observer.Z1 microscope and a total magnification of 100×. Wound pictures were quantified using the ImageJ software and 10 wounds from each dish were selected for further analysis so to ensure similar starting area ranges between treatments. Phase contrast microscopy pictures of the selected wounds were recorded again after 12 and 25 h using reference lines cut into the bottom of the dishes to ensure recording at the same positions each time.
Supplementary Material
Acknowledgments
This work was supported by The Danish Council for Independent Research | Natural Sciences (FNU), The Lundbeck Foundation (LMH, JSA) and by the European Community’s Seventh Framework Program (FP7/2007-2013) under grant agreement n° HEALTH-F4-2007-200767 and HEALTH-F4-2008-201648 for the collaborative project APO-SYS and PROSPECTS, respectively (JSA). We thank CEBI members for help and discussion in particular Vyacheslav Akimov for technical assistance.
Glossary
Abbreviations:
- ConA
concanamycin A
- eGFP
enhanced green fluorescent protein
- GEF
guanine exchange factor
- HEAT
Huntingtin, elongation factor 3 (EF3), protein phosphatase 2A (PP2A), and the yeast kinase TOR1
- LC-MS/MS
liquid chromatography tandem mass spectrometry
- LTQ
linear trap quadropole
- SILAC
stable isotope labeling of amino acids in cell culture
- SPT
serine-proline-threonine
- TFA
trifluoroacetic acid
- TiO2
titanium dioxide
- UPR
unfolded protein response
Disclosure of Potential Conflicts of Interest
There are no commercial or financial relationships related to this work that could pose a potential conflict of interest.
References
- 1. He C, Klionsky DJ. . Regulation mechanisms and signaling pathways of autophagy. Annu Rev Genet 2009; 43:67 - 93; http://dx.doi.org/ 10.1146/annurev-genet-102808-114910; PMID: 19653858 [DOI] [PMC free article] [PubMed] [Google Scholar]
- 2. Levine B, Kroemer G. . Autophagy in the pathogenesis of disease. Cell 2008; 132:27 - 42; http://dx.doi.org/ 10.1016/j.cell.2007.12.018; PMID: 18191218 [DOI] [PMC free article] [PubMed] [Google Scholar]
- 3. Kroemer G, Mariño G, Levine B. . Autophagy and the integrated stress response. Mol Cell 2010; 40:280 - 93; http://dx.doi.org/ 10.1016/j.molcel.2010.09.023; PMID: 20965422 [DOI] [PMC free article] [PubMed] [Google Scholar]
- 4. Neufeld TP. . TOR-dependent control of autophagy: biting the hand that feeds. Curr Opin Cell Biol 2010; 22:157 - 68; http://dx.doi.org/ 10.1016/j.ceb.2009.11.005; PMID: 20006481 [DOI] [PMC free article] [PubMed] [Google Scholar]
- 5. Blommaart EF, Luiken JJ, Blommaart PJ, van Woerkom GM, Meijer AJ. . Phosphorylation of ribosomal protein S6 is inhibitory for autophagy in isolated rat hepatocytes. J Biol Chem 1995; 270:2320 - 6; http://dx.doi.org/ 10.1074/jbc.270.5.2320; PMID: 7836465 [DOI] [PubMed] [Google Scholar]
- 6. Szeliga M, Obara-Michlewska M. . Glutamine in neoplastic cells: focus on the expression and roles of glutaminases. Neurochem Int 2009; 55:71 - 5; http://dx.doi.org/ 10.1016/j.neuint.2009.01.008; PMID: 19428809 [DOI] [PubMed] [Google Scholar]
- 7. Eng CH, Yu K, Lucas J, White E, Abraham RT. . Ammonia derived from glutaminolysis is a diffusible regulator of autophagy. Sci Signal 2010; 3:ra31; http://dx.doi.org/ 10.1126/scisignal.2000911; PMID: 20424262 [DOI] [PubMed] [Google Scholar]
- 8. Cheong H, Lindsten T, Wu J, Lu C, Thompson CB. . Ammonia-induced autophagy is independent of ULK1/ULK2 kinases. Proc Natl Acad Sci U S A 2011; 108:11121 - 6; http://dx.doi.org/ 10.1073/pnas.1107969108; PMID: 21690395 [DOI] [PMC free article] [PubMed] [Google Scholar]
- 9. Sabatini DM, Erdjument-Bromage H, Lui M, Tempst P, Snyder SH. . RAFT1: a mammalian protein that binds to FKBP12 in a rapamycin-dependent fashion and is homologous to yeast TORs. Cell 1994; 78:35 - 43; http://dx.doi.org/ 10.1016/0092-8674(94)90570-3; PMID: 7518356 [DOI] [PubMed] [Google Scholar]
- 10. Olsen JV, Blagoev B, Gnad F, Macek B, Kumar C, Mortensen P, Mann M. . Global, in vivo, and site-specific phosphorylation dynamics in signaling networks. Cell 2006; 127:635 - 48; http://dx.doi.org/ 10.1016/j.cell.2006.09.026; PMID: 17081983 [DOI] [PubMed] [Google Scholar]
- 11. Blom N, Gammeltoft S, Brunak S. . Sequence and structure-based prediction of eukaryotic protein phosphorylation sites. J Mol Biol 1999; 294:1351 - 62; http://dx.doi.org/ 10.1006/jmbi.1999.3310; PMID: 10600390 [DOI] [PubMed] [Google Scholar]
- 12. Schwartz D, Gygi SP. . An iterative statistical approach to the identification of protein phosphorylation motifs from large-scale data sets. Nat Biotechnol 2005; 23:1391 - 8; http://dx.doi.org/ 10.1038/nbt1146; PMID: 16273072 [DOI] [PubMed] [Google Scholar]
- 13. Oshiro N, Takahashi R, Yoshino K, Tanimura K, Nakashima A, Eguchi S, Miyamoto T, Hara K, Takehana K, Avruch J, et al. . The proline-rich Akt substrate of 40 kDa (PRAS40) is a physiological substrate of mammalian target of rapamycin complex 1. J Biol Chem 2007; 282:20329 - 39; http://dx.doi.org/ 10.1074/jbc.M702636200; PMID: 17517883 [DOI] [PMC free article] [PubMed] [Google Scholar]
- 14. Kovacina KS, Park GY, Bae SS, Guzzetta AW, Schaefer E, Birnbaum MJ, Roth RA. . Identification of a proline-rich Akt substrate as a 14-3-3 binding partner. J Biol Chem 2003; 278:10189 - 94; http://dx.doi.org/ 10.1074/jbc.M210837200; PMID: 12524439 [DOI] [PubMed] [Google Scholar]
- 15. Hsu PP, Kang SA, Rameseder J, Zhang Y, Ottina KA, Lim D, Peterson TR, Choi Y, Gray NS, Yaffe MB, et al. . The mTOR-regulated phosphoproteome reveals a mechanism of mTORC1-mediated inhibition of growth factor signaling. Science 2011; 332:1317 - 22; http://dx.doi.org/ 10.1126/science.1199498; PMID: 21659604 [DOI] [PMC free article] [PubMed] [Google Scholar]
- 16. Damoc E, Fraser CS, Zhou M, Videler H, Mayeur GL, Hershey JW, Doudna JA, Robinson CV, Leary JA. . Structural characterization of the human eukaryotic initiation factor 3 protein complex by mass spectrometry. Mol Cell Proteomics 2007; 6:1135 - 46; http://dx.doi.org/ 10.1074/mcp.M600399-MCP200; PMID: 17322308 [DOI] [PubMed] [Google Scholar]
- 17. Raught B, Peiretti F, Gingras AC, Livingstone M, Shahbazian D, Mayeur GL, Polakiewicz RD, Sonenberg N, Hershey JW. . Phosphorylation of eucaryotic translation initiation factor 4B Ser422 is modulated by S6 kinases. EMBO J 2004; 23:1761 - 9; http://dx.doi.org/ 10.1038/sj.emboj.7600193; PMID: 15071500 [DOI] [PMC free article] [PubMed] [Google Scholar]
- 18. Holz MK, Ballif BA, Gygi SP, Blenis J. . mTOR and S6K1 mediate assembly of the translation preinitiation complex through dynamic protein interchange and ordered phosphorylation events. Cell 2005; 123:569 - 80; http://dx.doi.org/ 10.1016/j.cell.2005.10.024; PMID: 16286006 [DOI] [PubMed] [Google Scholar]
- 19. Gingras AC, Raught B, Sonenberg N. . Regulation of translation initiation by FRAP/mTOR. Genes Dev 2001; 15:807 - 26; http://dx.doi.org/ 10.1101/gad.887201; PMID: 11297505 [DOI] [PubMed] [Google Scholar]
- 20. Vary TC, Deiter G, Lynch CJ. . Rapamycin limits formation of active eukaryotic initiation factor 4F complex following meal feeding in rat hearts. J Nutr 2007; 137:1857 - 62; PMID: 17634255 [DOI] [PubMed] [Google Scholar]
- 21. Harrington LS, Findlay GM, Gray A, Tolkacheva T, Wigfield S, Rebholz H, Barnett J, Leslie NR, Cheng S, Shepherd PR, et al. . The TSC1-2 tumor suppressor controls insulin-PI3K signaling via regulation of IRS proteins. J Cell Biol 2004; 166:213 - 23; http://dx.doi.org/ 10.1083/jcb.200403069; PMID: 15249583 [DOI] [PMC free article] [PubMed] [Google Scholar]
- 22. Palamarchuk A, Efanov A, Maximov V, Aqeilan RI, Croce CM, Pekarsky Y. . Akt phosphorylates and regulates Pdcd4 tumor suppressor protein. Cancer Res 2005; 65:11282 - 6; http://dx.doi.org/ 10.1158/0008-5472.CAN-05-3469; PMID: 16357133 [DOI] [PubMed] [Google Scholar]
- 23. Dorrello NV, Peschiaroli A, Guardavaccaro D, Colburn NH, Sherman NE, Pagano M. . S6K1- and betaTRCP-mediated degradation of PDCD4 promotes protein translation and cell growth. Science 2006; 314:467 - 71; http://dx.doi.org/ 10.1126/science.1130276; PMID: 17053147 [DOI] [PubMed] [Google Scholar]
- 24. Didichenko SA, Fragoso CM, Thelen M. . Mitotic and stress-induced phosphorylation of HsPI3K-C2alpha targets the protein for degradation. J Biol Chem 2003; 278:26055 - 64; http://dx.doi.org/ 10.1074/jbc.M301657200; PMID: 12719431 [DOI] [PubMed] [Google Scholar]
- 25. Krieg J, Hofsteenge J, Thomas G. . Identification of the 40 S ribosomal protein S6 phosphorylation sites induced by cycloheximide. J Biol Chem 1988; 263:11473 - 7; PMID: 3403539 [PubMed] [Google Scholar]
- 26. Jastrzebski K, Hannan KM, Tchoubrieva EB, Hannan RD, Pearson RB. . Coordinate regulation of ribosome biogenesis and function by the ribosomal protein S6 kinase, a key mediator of mTOR function. Growth Factors 2007; 25:209 - 26; http://dx.doi.org/ 10.1080/08977190701779101; PMID: 18092230 [DOI] [PubMed] [Google Scholar]
- 27. Kim DH, Sarbassov DD, Ali SM, King JE, Latek RR, Erdjument-Bromage H, Tempst P, Sabatini DM. . mTOR interacts with raptor to form a nutrient-sensitive complex that signals to the cell growth machinery. Cell 2002; 110:163 - 75; http://dx.doi.org/ 10.1016/S0092-8674(02)00808-5; PMID: 12150925 [DOI] [PubMed] [Google Scholar]
- 28. Peterson RT, Desai BN, Hardwick JS, Schreiber SL. . Protein phosphatase 2A interacts with the 70-kDa S6 kinase and is activated by inhibition of FKBP12-rapamycinassociated protein. Proc Natl Acad Sci U S A 1999; 96:4438 - 42; http://dx.doi.org/ 10.1073/pnas.96.8.4438; PMID: 10200280 [DOI] [PMC free article] [PubMed] [Google Scholar]
- 29. Wang L, Lawrence JC Jr., Sturgill TW, Harris TE. . Mammalian target of rapamycin complex 1 (mTORC1) activity is associated with phosphorylation of raptor by mTOR. J Biol Chem 2009; 284:14693 - 7; http://dx.doi.org/ 10.1074/jbc.C109.002907; PMID: 19346248 [DOI] [PMC free article] [PubMed] [Google Scholar]
- 30. Abraham RT, Eng CH. . Mammalian target of rapamycin as a therapeutic target in oncology. Expert Opin Ther Targets 2008; 12:209 - 22; http://dx.doi.org/ 10.1517/14728222.12.2.209; PMID: 18208369 [DOI] [PubMed] [Google Scholar]
- 31. Moritz A, Li Y, Guo A, Villén J, Wang Y, MacNeill J, Kornhauser J, Sprott K, Zhou J, Possemato A, et al. . Akt-RSK-S6 kinase signaling networks activated by oncogenic receptor tyrosine kinases. Sci Signal 2010; 3:ra64; http://dx.doi.org/ 10.1126/scisignal.2000998; PMID: 20736484 [DOI] [PMC free article] [PubMed] [Google Scholar]
- 32. Hara K, Maruki Y, Long X, Yoshino K, Oshiro N, Hidayat S, Tokunaga C, Avruch J, Yonezawa K. . Raptor, a binding partner of target of rapamycin (TOR), mediates TOR action. Cell 2002; 110:177 - 89; http://dx.doi.org/ 10.1016/S0092-8674(02)00833-4; PMID: 12150926 [DOI] [PubMed] [Google Scholar]
- 33. Linding R, Jensen LJ, Ostheimer GJ, van Vugt MA, Jørgensen C, Miron IM, Diella F, Colwill K, Taylor L, Elder K, et al. . Systematic discovery of in vivo phosphorylation networks. Cell 2007; 129:1415 - 26; http://dx.doi.org/ 10.1016/j.cell.2007.05.052; PMID: 17570479 [DOI] [PMC free article] [PubMed] [Google Scholar]
- 34. Lekmine F, Uddin S, Sassano A, Parmar S, Brachmann SM, Majchrzak B, Sonenberg N, Hay N, Fish EN, Platanias LC. . Activation of the p70 S6 kinase and phosphorylation of the 4E-BP1 repressor of mRNA translation by type I interferons. J Biol Chem 2003; 278:27772 - 80; http://dx.doi.org/ 10.1074/jbc.M301364200; PMID: 12759354 [DOI] [PubMed] [Google Scholar]
- 35. Anderson NG, Maller JL, Tonks NK, Sturgill TW. . Requirement for integration of signals from two distinct phosphorylation pathways for activation of MAP kinase. Nature 1990; 343:651 - 3; http://dx.doi.org/ 10.1038/343651a0; PMID: 2154696 [DOI] [PubMed] [Google Scholar]
- 36. Vanhatupa S, Ungureanu D, Paakkunainen M, Silvennoinen O. . MAPK-induced Ser727 phosphorylation promotes SUMOylation of STAT1. Biochem J 2008; 409:179 - 85; http://dx.doi.org/ 10.1042/BJ20070620; PMID: 17897103 [DOI] [PubMed] [Google Scholar]
- 37. Kelley LC, Hayes KE, Ammer AG, Martin KH, Weed SA. . Cortactin phosphorylated by ERK1/2 localizes to sites of dynamic actin regulation and is required for carcinoma lamellipodia persistence. PLoS One 2010; 5:e13847; http://dx.doi.org/ 10.1371/journal.pone.0013847; PMID: 21079800 [DOI] [PMC free article] [PubMed] [Google Scholar]
- 38. Woo MS, Ohta Y, Rabinovitz I, Stossel TP, Blenis J. . Ribosomal S6 kinase (RSK) regulates phosphorylation of filamin A on an important regulatory site. Mol Cell Biol 2004; 24:3025 - 35; http://dx.doi.org/ 10.1128/MCB.24.7.3025-3035.2004; PMID: 15024089 [DOI] [PMC free article] [PubMed] [Google Scholar]
- 39. Takahashi E, Abe J, Gallis B, Aebersold R, Spring DJ, Krebs EG, Berk BC. . p90(RSK) is a serum-stimulated Na+/H+ exchanger isoform-1 kinase. Regulatory phosphorylation of serine 703 of Na+/H+ exchanger isoform-1. J Biol Chem 1999; 274:20206 - 14; http://dx.doi.org/ 10.1074/jbc.274.29.20206; PMID: 10400637 [DOI] [PubMed] [Google Scholar]
- 40. Gille H, Kortenjann M, Thomae O, Moomaw C, Slaughter C, Cobb MH, Shaw PE. . ERK phosphorylation potentiates Elk-1-mediated ternary complex formation and transactivation. EMBO J 1995; 14:951 - 62; PMID: 7889942 [DOI] [PMC free article] [PubMed] [Google Scholar]
- 41. Lin FT, Miller WE, Luttrell LM, Lefkowitz RJ. . Feedback regulation of beta-arrestin1 function by extracellular signal-regulated kinases. J Biol Chem 1999; 274:15971 - 4; http://dx.doi.org/ 10.1074/jbc.274.23.15971; PMID: 10347142 [DOI] [PubMed] [Google Scholar]
- 42. Lovrić J, Dammeier S, Kieser A, Mischak H, Kolch W. . Activated raf induces the hyperphosphorylation of stathmin and the reorganization of the microtubule network. J Biol Chem 1998; 273:22848 - 55; PMID: 9712920 [PubMed] [Google Scholar]
- 43. Fabbro M, Zhou BB, Takahashi M, Sarcevic B, Lal P, Graham ME, Gabrielli BG, Robinson PJ, Nigg EA, Ono Y, et al. . Cdk1/Erk2- and Plk1-dependent phosphorylation of a centrosome protein, Cep55, is required for its recruitment to midbody and cytokinesis. Dev Cell 2005; 9:477 - 88; http://dx.doi.org/ 10.1016/j.devcel.2005.09.003; PMID: 16198290 [DOI] [PubMed] [Google Scholar]
- 44. Morton S, Davis RJ, McLaren A, Cohen P. . A reinvestigation of the multisite phosphorylation of the transcription factor c-Jun. EMBO J 2003; 22:3876 - 86; http://dx.doi.org/ 10.1093/emboj/cdg388; PMID: 12881422 [DOI] [PMC free article] [PubMed] [Google Scholar]
- 45. Hay N, Sonenberg N. . Upstream and downstream of mTOR. Genes Dev 2004; 18:1926 - 45; http://dx.doi.org/ 10.1101/gad.1212704; PMID: 15314020 [DOI] [PubMed] [Google Scholar]
- 46. Rigbolt KT, Zarei M, Sprenger A, Becker AC, Diedrich B, Huang X, Eiselein S, Kristensen AR, Gretzmeier C, Andersen JS, et al. . Characterization of early autophagy signaling by quantitative phosphoproteomics. Autophagy 2013; 10; PMID: 24275748 [DOI] [PMC free article] [PubMed] [Google Scholar]
- 47. Yu Y, Yoon SO, Poulogiannis G, Yang Q, Ma XM, Villén J, Kubica N, Hoffman GR, Cantley LC, Gygi SP, et al. . Phosphoproteomic analysis identifies Grb10 as an mTORC1 substrate that negatively regulates insulin signaling. Science 2011; 332:1322 - 6; http://dx.doi.org/ 10.1126/science.1199484; PMID: 21659605 [DOI] [PMC free article] [PubMed] [Google Scholar]
- 48. Lekmine F, Sassano A, Uddin S, Smith J, Majchrzak B, Brachmann SM, Hay N, Fish EN, Platanias LC. . Interferon-gamma engages the p70 S6 kinase to regulate phosphorylation of the 40S S6 ribosomal protein. Exp Cell Res 2004; 295:173 - 82; http://dx.doi.org/ 10.1016/j.yexcr.2003.12.021; PMID: 15051500 [DOI] [PubMed] [Google Scholar]
- 49. Matsuoka Y, Nagahara Y, Ikekita M, Shinomiya T. . A novel immunosuppressive agent FTY720 induced Akt dephosphorylation in leukemia cells. Br J Pharmacol 2003; 138:1303 - 12; http://dx.doi.org/ 10.1038/sj.bjp.0705182; PMID: 12711631 [DOI] [PMC free article] [PubMed] [Google Scholar]
- 50. Roux PP, Shahbazian D, Vu H, Holz MK, Cohen MS, Taunton J, Sonenberg N, Blenis J. . RAS/ERK signaling promotes site-specific ribosomal protein S6 phosphorylation via RSK and stimulates cap-dependent translation. J Biol Chem 2007; 282:14056 - 64; http://dx.doi.org/ 10.1074/jbc.M700906200; PMID: 17360704 [DOI] [PMC free article] [PubMed] [Google Scholar]
- 51. Rigbolt KT, Prokhorova TA, Akimov V, Henningsen J, Johansen PT, Kratchmarova I, Kassem M, Mann M, Olsen JV, Blagoev B. . System-wide temporal characterization of the proteome and phosphoproteome of human embryonic stem cell differentiation. Sci Signal 2011; 4:rs3; http://dx.doi.org/ 10.1126/scisignal.2001570; PMID: 21406692 [DOI] [PubMed] [Google Scholar]
- 52. Olsen JV, Vermeulen M, Santamaria A, Kumar C, Miller ML, Jensen LJ, Gnad F, Cox J, Jensen TS, Nigg EA, et al. . Quantitative phosphoproteomics reveals widespread full phosphorylation site occupancy during mitosis. Sci Signal 2010; 3:ra3; http://dx.doi.org/ 10.1126/scisignal.2000475; PMID: 20068231 [DOI] [PubMed] [Google Scholar]
- 53. Doble BW, Woodgett JR. . GSK-3: tricks of the trade for a multi-tasking kinase. J Cell Sci 2003; 116:1175 - 86; http://dx.doi.org/ 10.1242/jcs.00384; PMID: 12615961 [DOI] [PMC free article] [PubMed] [Google Scholar]
- 54. Fu L, Kim YA, Wang X, Wu X, Yue P, Lonial S, Khuri FR, Sun SY. . Perifosine inhibits mammalian target of rapamycin signaling through facilitating degradation of major components in the mTOR axis and induces autophagy. Cancer Res 2009; 69:8967 - 76; http://dx.doi.org/ 10.1158/0008-5472.CAN-09-2190; PMID: 19920197 [DOI] [PMC free article] [PubMed] [Google Scholar]
- 55. Mao JH, Kim IJ, Wu D, Climent J, Kang HC, DelRosario R, Balmain A. . FBXW7 targets mTOR for degradation and cooperates with PTEN in tumor suppression. Science 2008; 321:1499 - 502; http://dx.doi.org/ 10.1126/science.1162981; PMID: 18787170 [DOI] [PMC free article] [PubMed] [Google Scholar]
- 56. Mariño G, Kroemer G. . Ammonia: a diffusible factor released by proliferating cells that induces autophagy. Sci Signal 2010; 3:pe19; http://dx.doi.org/ 10.1126/scisignal.3124pe19; PMID: 20516476 [DOI] [PubMed] [Google Scholar]
- 57. Schliess F, Görg B, Fischer R, Desjardins P, Bidmon HJ, Herrmann A, Butterworth RF, Zilles K, Häussinger D. . Ammonia induces MK-801-sensitive nitration and phosphorylation of protein tyrosine residues in rat astrocytes. FASEB J 2002; 16:739 - 41; PMID: 11923223 [DOI] [PubMed] [Google Scholar]
- 58. Jayakumar AR, Panickar KS, Murthy ChR, Norenberg MD. . Oxidative stress and mitogen-activated protein kinase phosphorylation mediate ammonia-induced cell swelling and glutamate uptake inhibition in cultured astrocytes. J Neurosci 2006; 26:4774 - 84; http://dx.doi.org/ 10.1523/JNEUROSCI.0120-06.2006; PMID: 16672650 [DOI] [PMC free article] [PubMed] [Google Scholar]
- 59. Vial E, Sahai E, Marshall CJ. . ERK-MAPK signaling coordinately regulates activity of Rac1 and RhoA for tumor cell motility. Cancer Cell 2003; 4:67 - 79; http://dx.doi.org/ 10.1016/S1535-6108(03)00162-4; PMID: 12892714 [DOI] [PubMed] [Google Scholar]
- 60. Torii S, Nakayama K, Yamamoto T, Nishida E. . Regulatory mechanisms and function of ERK MAP kinases. J Biochem 2004; 136:557 - 61; http://dx.doi.org/ 10.1093/jb/mvh159; PMID: 15632293 [DOI] [PubMed] [Google Scholar]
- 61. Shaul YD, Seger R. . The MEK/ERK cascade: from signaling specificity to diverse functions. Biochim Biophys Acta 2007; 1773:1213 - 26; http://dx.doi.org/ 10.1016/j.bbamcr.2006.10.005; PMID: 17112607 [DOI] [PubMed] [Google Scholar]
- 62. Shaulian E, Karin M. . AP-1 as a regulator of cell life and death. Nat Cell Biol 2002; 4:E131 - 6; http://dx.doi.org/ 10.1038/ncb0502-e131; PMID: 11988758 [DOI] [PubMed] [Google Scholar]
- 63. Janknecht R, Ernst WH, Pingoud V, Nordheim A. . Activation of ternary complex factor Elk-1 by MAP kinases. EMBO J 1993; 12:5097 - 104; PMID: 8262053 [DOI] [PMC free article] [PubMed] [Google Scholar]
- 64. Cassimeris L. . The oncoprotein 18/stathmin family of microtubule destabilizers. Curr Opin Cell Biol 2002; 14:18 - 24; http://dx.doi.org/ 10.1016/S0955-0674(01)00289-7; PMID: 11792540 [DOI] [PubMed] [Google Scholar]
- 65. Ma L, Chen Z, Erdjument-Bromage H, Tempst P, Pandolfi PP. . Phosphorylation and functional inactivation of TSC2 by Erk implications for tuberous sclerosis and cancer pathogenesis. Cell 2005; 121:179 - 93; http://dx.doi.org/ 10.1016/j.cell.2005.02.031; PMID: 15851026 [DOI] [PubMed] [Google Scholar]
- 66. Pattingre S, Bauvy C, Codogno P. . Amino acids interfere with the ERK1/2-dependent control of macroautophagy by controlling the activation of Raf-1 in human colon cancer HT-29 cells. J Biol Chem 2003; 278:16667 - 74; http://dx.doi.org/ 10.1074/jbc.M210998200; PMID: 12609989 [DOI] [PubMed] [Google Scholar]
- 67. Webber JL, Tooze SA. . Coordinated regulation of autophagy by p38alpha MAPK through mAtg9 and p38IP. EMBO J 2010; 29:27 - 40; http://dx.doi.org/ 10.1038/emboj.2009.321; PMID: 19893488 [DOI] [PMC free article] [PubMed] [Google Scholar]
- 68. Comes F, Matrone A, Lastella P, Nico B, Susca FC, Bagnulo R, Ingravallo G, Modica S, Lo Sasso G, Moschetta A, et al. . A novel cell type-specific role of p38alpha in the control of autophagy and cell death in colorectal cancer cells. Cell Death Differ 2007; 14:693 - 702; http://dx.doi.org/ 10.1038/sj.cdd.4402076; PMID: 17159917 [DOI] [PubMed] [Google Scholar]
- 69. Bustelo XR, Sauzeau V, Berenjeno IM. . GTP-binding proteins of the Rho/Rac family: regulation, effectors and functions in vivo. Bioessays 2007; 29:356 - 70; http://dx.doi.org/ 10.1002/bies.20558; PMID: 17373658 [DOI] [PMC free article] [PubMed] [Google Scholar]
- 70. Barnes WG, Reiter E, Violin JD, Ren XR, Milligan G, Lefkowitz RJ. . beta-Arrestin 1 and Galphaq/11 coordinately activate RhoA and stress fiber formation following receptor stimulation. J Biol Chem 2005; 280:8041 - 50; http://dx.doi.org/ 10.1074/jbc.M412924200; PMID: 15611106 [DOI] [PubMed] [Google Scholar]
- 71. Sebolt-Leopold JS, Dudley DT, Herrera R, Van Becelaere K, Wiland A, Gowan RC, Tecle H, Barrett SD, Bridges A, Przybranowski S, et al. . Blockade of the MAP kinase pathway suppresses growth of colon tumors in vivo. Nat Med 1999; 5:810 - 6; http://dx.doi.org/ 10.1038/10533; PMID: 10395327 [DOI] [PubMed] [Google Scholar]
- 72. Kang JH, Jiang Y, Toita R, Oishi J, Kawamura K, Han A, Mori T, Niidome T, Ishida M, Tatematsu K, et al. . Phosphorylation of Rho-associated kinase (Rho-kinase/ROCK/ROK) substrates by protein kinases A and C. Biochimie 2007; 89:39 - 47; http://dx.doi.org/ 10.1016/j.biochi.2006.08.003; PMID: 16996192 [DOI] [PubMed] [Google Scholar]
- 73. Reshkin SJ, Bellizzi A, Albarani V, Guerra L, Tommasino M, Paradiso A, Casavola V. . Phosphoinositide 3-kinase is involved in the tumor-specific activation of human breast cancer cell Na(+)/H(+) exchange, motility, and invasion induced by serum deprivation. J Biol Chem 2000; 275:5361 - 9; http://dx.doi.org/ 10.1074/jbc.275.8.5361; PMID: 10681510 [DOI] [PubMed] [Google Scholar]
- 74. Stock C, Gassner B, Hauck CR, Arnold H, Mally S, Eble JA, Dieterich P, Schwab A. . Migration of human melanoma cells depends on extracellular pH and Na+/H+ exchange. J Physiol 2005; 567:225 - 38; http://dx.doi.org/ 10.1113/jphysiol.2005.088344; PMID: 15946960 [DOI] [PMC free article] [PubMed] [Google Scholar]
- 75. Kirkin V, McEwan DG, Novak I, Dikic I. . A role for ubiquitin in selective autophagy. Mol Cell 2009; 34:259 - 69; http://dx.doi.org/ 10.1016/j.molcel.2009.04.026; PMID: 19450525 [DOI] [PubMed] [Google Scholar]
- 76. Schneider M, Marison IW, von Stockar U. . The importance of ammonia in mammalian cell culture. J Biotechnol 1996; 46:161 - 85; http://dx.doi.org/ 10.1016/0168-1656(95)00196-4; PMID: 8672289 [DOI] [PubMed] [Google Scholar]
- 77. Warden SM, Richardson C, O’Donnell J Jr., Stapleton D, Kemp BE, Witters LA. . Post-translational modifications of the beta-1 subunit of AMP-activated protein kinase affect enzyme activity and cellular localization. Biochem J 2001; 354:275 - 83; http://dx.doi.org/ 10.1042/0264-6021:3540275; PMID: 11171104 [DOI] [PMC free article] [PubMed] [Google Scholar]
- 78. Kim J, Kundu M, Viollet B, Guan KL. . AMPK and mTOR regulate autophagy through direct phosphorylation of Ulk1. Nat Cell Biol 2011; 13:132 - 41; http://dx.doi.org/ 10.1038/ncb2152; PMID: 21258367 [DOI] [PMC free article] [PubMed] [Google Scholar]
- 79. Ito H, Iwamoto I, Inaguma Y, Takizawa T, Nagata K, Asano T, Kato K. . Endoplasmic reticulum stress induces the phosphorylation of small heat shock protein, Hsp27. J Cell Biochem 2005; 95:932 - 41; http://dx.doi.org/ 10.1002/jcb.20445; PMID: 15864808 [DOI] [PubMed] [Google Scholar]
- 80. Kanekura K, Nishimoto I, Aiso S, Matsuoka M. . Characterization of amyotrophic lateral sclerosis-linked P56S mutation of vesicle-associated membrane protein-associated protein B (VAPB/ALS8). J Biol Chem 2006; 281:30223 - 33; http://dx.doi.org/ 10.1074/jbc.M605049200; PMID: 16891305 [DOI] [PubMed] [Google Scholar]
- 81. Bertolotti A, Zhang Y, Hendershot LM, Harding HP, Ron D. . Dynamic interaction of BiP and ER stress transducers in the unfolded-protein response. Nat Cell Biol 2000; 2:326 - 32; http://dx.doi.org/ 10.1038/35014014; PMID: 10854322 [DOI] [PubMed] [Google Scholar]
- 82. Devi L, Alldred MJ, Ginsberg SD, Ohno M. . Mechanisms underlying insulin deficiency-induced acceleration of β-amyloidosis in a mouse model of Alzheimer’s disease. PLoS One 2012; 7:e32792; http://dx.doi.org/ 10.1371/journal.pone.0032792; PMID: 22403710 [DOI] [PMC free article] [PubMed] [Google Scholar]
- 83. Gjymishka A, Su N, Kilberg MS. . Transcriptional induction of the human asparagine synthetase gene during the unfolded protein response does not require the ATF6 and IRE1/XBP1 arms of the pathway. Biochem J 2009; 417:695 - 703; http://dx.doi.org/ 10.1042/BJ20081706; PMID: 18840095 [DOI] [PMC free article] [PubMed] [Google Scholar]
- 84. Tian T, Zhao Y, Nakajima S, Huang T, Yao J, Paton AW, Paton JC, Kitamura M. . Cytoprotective roles of ERK and Akt in endoplasmic reticulum stress triggered by subtilase cytotoxin. Biochem Biophys Res Commun 2011; 410:852 - 8; http://dx.doi.org/ 10.1016/j.bbrc.2011.06.078; PMID: 21703246 [DOI] [PubMed] [Google Scholar]
- 85. Hu P, Han Z, Couvillon AD, Exton JH. . Critical role of endogenous Akt/IAPs and MEK1/ERK pathways in counteracting endoplasmic reticulum stress-induced cell death. J Biol Chem 2004; 279:49420 - 9; http://dx.doi.org/ 10.1074/jbc.M407700200; PMID: 15339911 [DOI] [PubMed] [Google Scholar]
- 86. Kouroku Y, Fujita E, Tanida I, Ueno T, Isoai A, Kumagai H, Ogawa S, Kaufman RJ, Kominami E, Momoi T. . ER stress (PERK/eIF2alpha phosphorylation) mediates the polyglutamine-induced LC3 conversion, an essential step for autophagy formation. Cell Death Differ 2007; 14:230 - 9; http://dx.doi.org/ 10.1038/sj.cdd.4401984; PMID: 16794605 [DOI] [PubMed] [Google Scholar]
- 87. Ogata M, Hino S, Saito A, Morikawa K, Kondo S, Kanemoto S, Murakami T, Taniguchi M, Tanii I, Yoshinaga K, et al. . Autophagy is activated for cell survival after endoplasmic reticulum stress. Mol Cell Biol 2006; 26:9220 - 31; http://dx.doi.org/ 10.1128/MCB.01453-06; PMID: 17030611 [DOI] [PMC free article] [PubMed] [Google Scholar]
- 88. Ong SE, Blagoev B, Kratchmarova I, Kristensen DB, Steen H, Pandey A, Mann M. . Stable isotope labeling by amino acids in cell culture, SILAC, as a simple and accurate approach to expression proteomics. Mol Cell Proteomics 2002; 1:376 - 86; http://dx.doi.org/ 10.1074/mcp.M200025-MCP200; PMID: 12118079 [DOI] [PubMed] [Google Scholar]
- 89. Rappsilber J, Ishihama Y, Mann M. . Stop and go extraction tips for matrix-assisted laser desorption/ionization, nanoelectrospray, and LC/MS sample pretreatment in proteomics. Anal Chem 2003; 75:663 - 70; http://dx.doi.org/ 10.1021/ac026117i; PMID: 12585499 [DOI] [PubMed] [Google Scholar]
- 90. Larsen MR, Thingholm TE, Jensen ON, Roepstorff P, Jørgensen TJ. . Highly selective enrichment of phosphorylated peptides from peptide mixtures using titanium dioxide microcolumns. Mol Cell Proteomics 2005; 4:873 - 86; http://dx.doi.org/ 10.1074/mcp.T500007-MCP200; PMID: 15858219 [DOI] [PubMed] [Google Scholar]
- 91. Cox J, Mann M. . MaxQuant enables high peptide identification rates, individualized p.p.b.-range mass accuracies and proteome-wide protein quantification. Nat Biotechnol 2008; 26:1367 - 72; http://dx.doi.org/ 10.1038/nbt.1511; PMID: 19029910 [DOI] [PubMed] [Google Scholar]
Associated Data
This section collects any data citations, data availability statements, or supplementary materials included in this article.