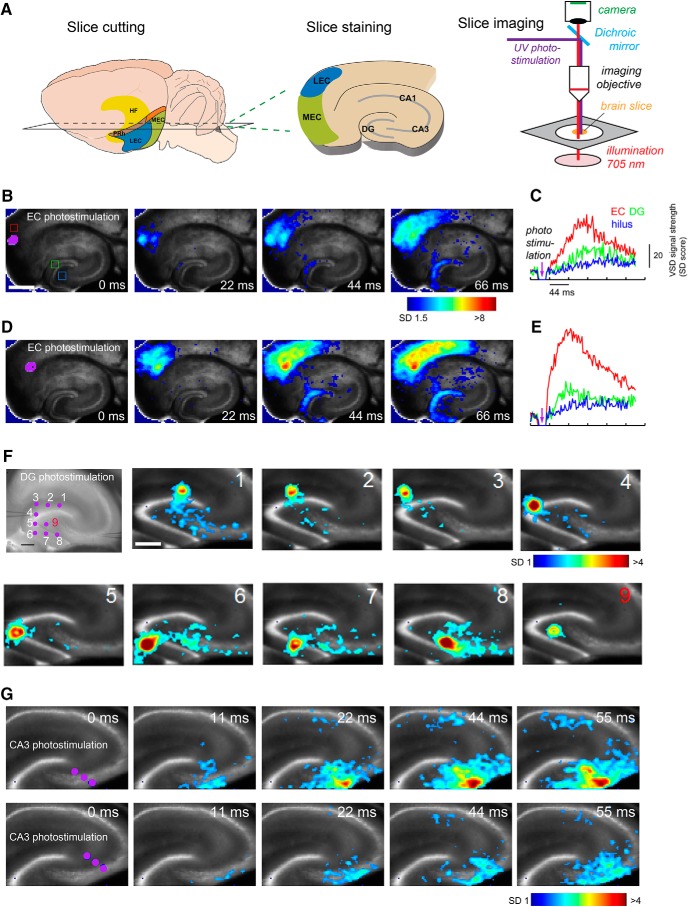
Figure 9.
Functional circuit mapping with fast VSD imaging of neural activity supports anatomic rabies tracing results. A, Schematic of living brain slice preparation and the VSD imaging set up. B–E, Spatially restricted photostimulation in EC evokes wide-spread activation in DG (full extent), but weak hilar neuronal activation. B, D, Time series data from VSD imaging of photostimulation-evoked neural activation in the hippocampal formation circuitry. The purple dots (laser stimulation artifact) indicates the photostimulation site. Color-coded activity is superimposed on the background slice image. The color scale codes VSD signal amplitude expressed as SD multiples above the mean baseline. The stronger activation is indicated by the warmer color. Scale bar, 500 μm. C, E, Time course plots of VSD signal from the regions of interest (EC, DG granule cell layer, hilus) indicated by the colored rectangles (red, green, and blue) in the first image frame in B, respectively, starting from the baseline of 22 ms preceding the photostimulation onset. No baseline drift was corrected. F, Spatially restricted photostimulation of dentate granule cells activate hilar and CA3 responses, but hilar photostimulation does not cause significant DG activation. The imaging of individual stimulation at nine different sites (including one hilus stimulation, number 9) was performed; the peak response image frames are plotted at 44 ms after photostimulation. Scale bars: 250 μm (first panel) and 250 μm (second panel), for both F and G. G, Time series data from VSD imaging of photostimulation-evoked neural activation in proximal CA3b with simultaneous stimulation of three sites (purple dots). Compared with weaker CA3 activation in the lower panels, the stronger CA3 activation in upper panels causes more CA3 collateral activation and feedforward signal propagation to CA1. In later time points, CA3 activation also leads to some hilar activation.

