Abstract
Background
Among older adults, it is not clear how different types or amounts of physical therapy may be associated with improvements in back pain and function.
Objective
The study objective was to investigate the association between types or amounts of physical therapist services and 1-year outcomes among older adults with back pain.
Design
This was a prospective cohort study.
Methods
A total of 3,771 older adults who were enrolled in a cohort study and who had a new primary care visit for back pain participated. Physical therapy use was ascertained from electronic health records. The following patient-reported outcomes were collected over 12 months: back-related disability (Roland-Morris Disability Questionnaire) and back and leg pain intensity (11-point numerical rating scale). Marginal structural models were used to estimate average effects of different amounts of physical therapy use on disability and pain for all types of physical therapy and for active, passive, and manual physical therapy.
Results
A total of 1,285 participants (34.1%) received some physical therapy. There was no statistically significant gradient in relationships between physical therapy use and back-related disability score. The use of passive or manual therapy was not consistently associated with pain outcomes. Higher amounts of active physical therapy were associated with decreased back and leg pain and increased odds of clinically meaningful improvements in back and leg pain relative to results obtained with no active physical therapy.
Limitations
The fact that few participants had high amounts of physical therapy use limited precision and the ability to test for nonlinear relationships for the amount of use.
Conclusions
Higher amounts of active physical therapy were most consistently related to the greatest improvements in pain intensity; however, as with all observational studies, the results must be interpreted with caution.
Back pain is an important public health issue for older adults. Approximately one-quarter to one-third of older adults have prevalent back pain,1,2 and older adults with low back pain have lower levels of health-related quality of life and greater functional limitations.2 As the US population ages, back pain in older adults is likely to become a more significant public health problem. Increased morbidity and need for care because of back pain can strain the use of health care systems. Specifically, back pain–related costs and health care use among older adults in the United States have increased disproportionately compared with the enrollment of older adults in Medicare, the United States' national health plan for older adults.3 As the population of older adults grows, the demand will escalate.
Physical therapist services are commonly used to address functional limitations in older adults with back pain, yet the types and amounts of physical therapy use and their impacts on back pain and function in older adults are unknown. One study of Medicare data found that early physical therapy visits were associated with less subsequent use of back-related health care by patients with nonspecific low back pain.4 However, because administrative data were used in that study, the authors had no information on corresponding changes in pain and functional status. Additionally, the authors did not examine the types of interventions provided by physical therapists. To gain a better understanding of the relationships between types or amounts of physical therapist services and patients' pain and function, research investigating the comparative effectiveness of active, passive, and manual physical therapy is needed.
In the absence of randomized clinical trials, observational comparative effectiveness research can provide valuable information. Such research can be used to examine the outcomes of patients; to support the decision making of patients, clinicians, and policy makers; and to help generate hypotheses for how to improve the delivery of health care services.5 Although observational comparative effectiveness studies lack the robust internal validity of randomized clinical trials, they have several advantages. They may have better external validity because they are focused on studying the outcomes of patients in more typical, real-world practice settings.5,6 The performance of an intervention under real-world circumstances is referred to as effectiveness, whereas efficacy refers to the performance of a treatment under ideal, well-controlled circumstances.7 Such studies also can be used to investigate the effectiveness of interventions in understudied populations, such as older adults.5
We conducted an observational comparative effectiveness research study to investigate the association between types or amounts of physical therapist services and outcomes, such as disability and pain intensity, among older adults over the course of 1 year. The primary aim was to estimate the differences in patient-reported outcomes among groups defined by types or amounts of physical therapy use. The secondary aim was to estimate the differences in the numbers of participants achieving clinically important differences in outcomes among these groups. We hypothesized that, relative to the results of receiving usual medical care without physical therapy, receiving any amount of active physical therapy or manual physical therapy would be associated with less pain and disability, and receiving any amount of passive physical therapy would have no association with subsequent pain and disability.
Method
Study Design, Data Source, and Study Population
We conducted an observational cohort study using the Back Pain Outcomes Using Longitudinal Data (BOLD) registry. The BOLD registry comprises 5,239 adults who were 65 years old and older and who had a new primary care visit for back pain. We recruited participants from 3 integrated health systems in the United States: Kaiser Permanente in northern California; Henry Ford Health System in Detroit, Michigan; and Harvard Vanguard Medical Associates/Harvard Pilgrim Health Care in Boston, Massachusetts. We collected data on demographic and baseline clinical characteristics. We then monitored participants prospectively for 12 months, collecting patient-reported outcomes at 3, 6, and 12 months after the initial index visit. We also collected data on health care use for the 12 months before and after the index visit from participants' electronic health records (EHRs). Patients provide verbal assent for their participation in the registry, which includes access to their medical records.
We excluded adults if they had had a health care encounter for back pain 6 months before the index date, prior lumbar spine surgery, developmental spine deformities, inflammatory spondyloarthropathy, known spinal malignancy or infection, primarily nerve compression–related symptoms, or a serious medical comorbid condition with a life expectancy of less than 1 year. We previously published a complete description of the BOLD cohort formation.8
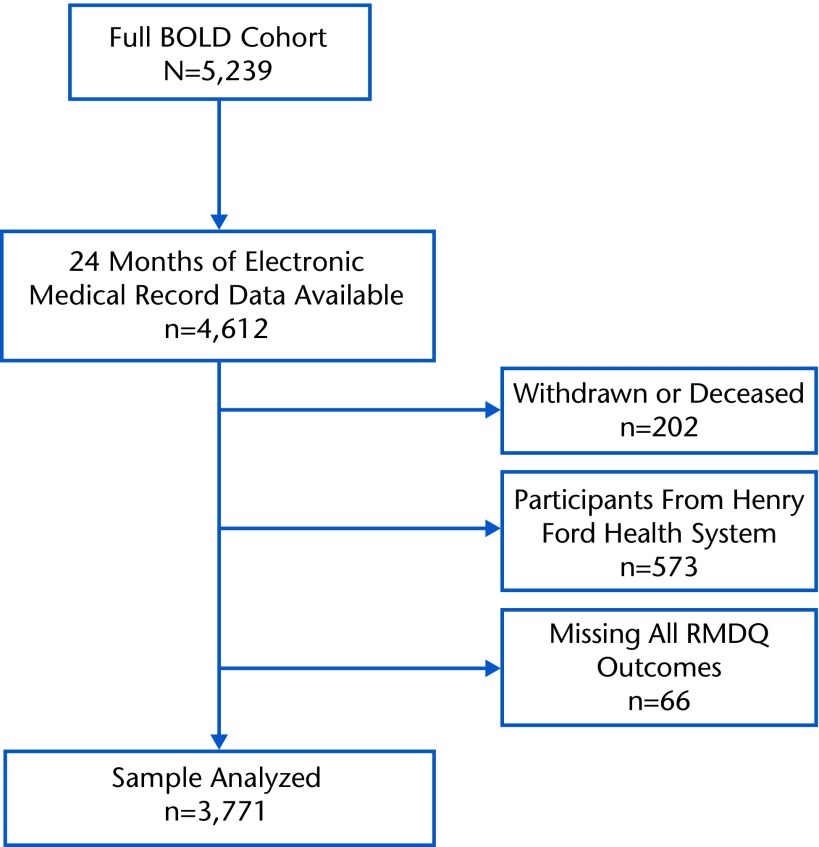
For this analysis, we selected from the BOLD registry participants who had reached their 12-month follow-up and for whom complete EHR data were available as of May 2014. We excluded adults with missing outcomes at all 3 time points, who had withdrawn from the study, or who had died before their 12-month follow-up. We also excluded adults from the Henry Ford Health System because Current Procedural Terminology (CPT), fourth edition, code-level data for physical therapy services were not available from this study site (Figure).
Figure.
Flow diagram of study enrollment. BOLD=Back Pain Outcomes Using Longitudinal Data, RMDQ=Roland-Morris Disability Questionnaire.
Physical Therapy Use
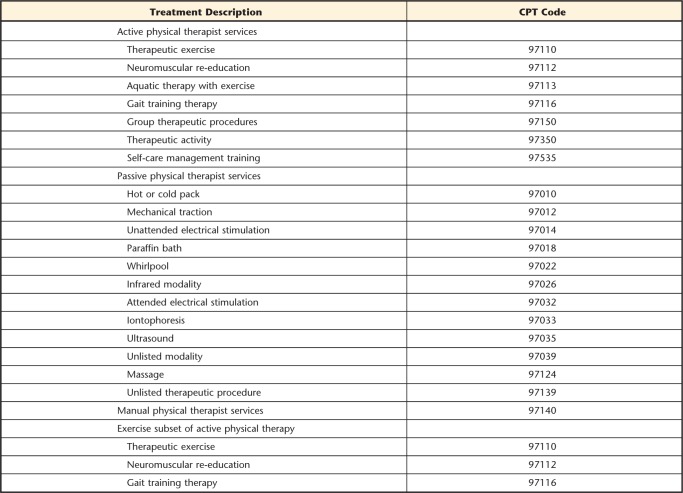
We determined the types and amounts of physical therapy services that participants received using the CPT codes in their EHRs (CPT codes 97001–97535). Physical therapist interventions were categorized as active (eg, therapeutic exercise, neuromuscular reeducation, or therapeutic activity), passive (modalities), or manual on the basis of the CPT codes (Appendix 1). Most procedures used by physical therapists, such as those for therapeutic exercise, neuromuscular reeducation, or manual therapy, are assigned time-based treatment CPT codes; 1 unit corresponds to approximately 15 minutes of treatment. Non–time-based codes, such as those for group therapy or mechanical traction, refer to a single procedure being performed per session regardless of time and can be charged only once per session. Thus, a physical therapy visit may consist of multiple CPT codes, depending on the type and amount of treatment provided, but Medicare specifies that the total number of time-based CPT codes billed per session must not exceed the total minutes of treatment.9
We recorded the amount of physical therapy use as the sum of all physical therapy CPT codes recorded in the EHRs from baseline through the 12-month follow-up period. Thus, the sum reflects the total amount of treatment time. We described type of use as the sum of CPT codes specific to each treatment category (active, passive, or manual therapy) during this same time period. We then categorized the amount of physical therapy use for the 12 months after the index visit on the basis of the sum within each category: none, low (1–4), medium (5–9), high (10–14), or very high (≥15). For hypothesis testing, we collapsed the active therapy use category into none, low (1–4), medium (5–9), and high (≥10), and we collapsed the passive and manual therapy use categories into none, low (1–4), and medium to high (≥5) because few participants had very high or high amounts of use in each of these categories.
Outcomes
The primary outcome measure was the Roland-Morris Disability Questionnaire (RMDQ). The RMDQ is a 24-item, well-validated questionnaire for back-related disability, and it has been recommended for back pain studies.10,11 The questions were slightly modified to specify disability from back pain or leg pain (sciatica).8 Secondary outcome measures were numerical rating scales (NRSs) for back pain and leg pain.12 We measured the pain NRS outcomes with scores of 0 to 10 for average pain in the preceding 7 days. We prespecified minimal clinically important differences for changes on the RMDQ as improvement from the baseline of greater than or equal to 5 points13 and for changes on each pain NRS as improvement from the baseline of greater than or equal to 30%.13
Covariates
At baseline, we collected data on the demographic variables age, sex, ethnicity (Hispanic or non-Hispanic), race, marital status, and education. Health characteristics assessed at the baseline interview were duration of current back pain, scores on the Patient Health Questionnaire-4 Depression and Anxiety 4-item screen,14,15 scores of 0 (no confidence) to 10 (complete confidence) on a scale for the expectation of recovery, smoking history, scores on the Brief Pain Inventory, and scores on the EQ-5D-5L. The Brief Pain Inventory is a scale that measures, with scores of 0 (no interference) to 10 (interferes completely), interference with 7 domains: general activity, mood, ability to walk, normal work, relations with other people, sleep, and enjoyment of life. The composite score is an average of the scores for the 7 domains.16 The EQ-5D-5L is a standardized, preference-based measure of general health status. It consists of an index that assesses 5 domains (mobility, self-care, usual activities, pain/discomfort, and anxiety/depression) and a visual analog scale with scores of 0 to 100.17
We also identified the use of additional interventions or diagnostic imaging during the 12 months after the participants' index visits from their EHRs. We used the date of service for all back-associated CPT codes pertaining to diagnostic imaging, chiropractic visits, injections, and surgeries to define the timing and type of all concomitant interventions during the study period.
Data Analysis
We used descriptive statistics to describe the baseline characteristics of the entire cohort and participants with no, low, medium, high, and very high total physical therapy use. We described unadjusted means and standard deviations for each outcome measure at each time point by strata of overall physical therapy use.
We used marginal structural models to estimate the association between amounts of all physical therapy, active physical therapy, passive physical therapy, and manual therapy use and back-related disability and pain. The use of marginal structural models is an appropriate method to account for differences between groups at baseline and differences over time.18,19 In this analysis, physical therapy interventions were “time-varying interventions” because they were initiated at different time points and the amount of exposure varied over time. In addition, the longitudinal analysis of cumulative physical therapy interventions over multiple time points created time-dependent confounding bias because physical therapy use and long-term outcomes were associated with past outcomes and treatments. Standard longitudinal statistical methods cannot fully adjust estimates in the presence of time-dependent confounding and time-varying interventions. Thus, specialized statistical methods were required.
Essentially, with marginal structural models, participants were reweighted by the inverse of the probability that they would receive the amount of treatment that they experienced. Marginal structural models involve a 2-step process. Step 1 involves creating the inverse probability of treatment weights, and step 2 involves applying these weights to a regression model. To generate these weights, we created propensity scores for the probability of receiving physical therapy interventions during 3 time periods (0–3 months, 3–6 months, and 6–12 months). We categorized treatment level as no physical therapy intervention (0 CPT codes), low physical therapy use (1–3 CPT codes), or high physical therapy use (>3 CPT codes), and we used ordinal regression to predict the propensity for each treatment category using baseline demographic and clinical data, intermediate pain and function outcomes, and any prior treatments or imaging. The primary idea was that confounding might occur if participants with a poorer health status sought additional care; marginal structural models can correct for such bias. The inverse of the probability that a participant would receive a specific treatment level was the participant's weight at each time period. We then created stabilized weights by including the probability of receiving treatment given the baseline characteristics in the numerator of each weight. We multiplied the stabilized weights for each time period by each other to create a participant's cumulative weight for the entire study period (0–12 months).
We applied the cumulative weight to generalized estimating equations (GEE) to estimate the average treatment effect of each intervention category over the 12-month study period using 3-, 6-, and 12-month outcome measures.20,21 All physical therapy, active physical therapy, passive physical therapy, and manual therapy were investigated with separate GEE models. We dropped 3 participants with cumulative weights of greater than 10 from the analysis because large weights might be overly influential. The first set of models tested differences in mean patient-reported outcome scores by comparing each amount of use category with the reference group (ie, adults with no use of that specific physical therapist intervention category). The second set of models tested the odds of a minimal clinically important difference by comparing each amount of use category with that of adults with no use in that intervention category. We adjusted each model for prespecified confounders: study site, age, sex, marital status, education, back pain duration, Patient Health Questionnaire-4 scores, expectation of recovery, baseline RMDQ scores, baseline back and leg NRS scores, and time. We tested for trend with increasing amount within each intervention category using a Wald test.
Missing Data
We removed participants with missing outcomes at all 3 follow-up time points (3, 6, and 12 months) (Figure). For creating weights and hypothesis testing, we used a simple single imputation for missing outcome measures at 3 months, 6 months, or both. We imputed missing 3-month outcomes by carrying the baseline measure forward. Missing 6-month outcomes were imputed by carrying the 3-month measure forward.
Sensitivity Analysis
We performed an additional sensitivity analysis to better understand whether the association of exercise-specific interventions with outcomes was different from that of all active interventions. We chose exercise-specific CPT codes (CPT codes 97110, 97112, and 97116) from the active category; then we used the GEE models that were used for active physical therapy but with the CPT codes for the amount of exercise replacing the CPT codes for the amount of active physical therapy.
For all analyses, the significance level was set at a P value of less than .05. Analyses were performed with Stata/IC version 12.1 (StataCorp, College Station, Texas).
Role of the Funding Source
This study was funded by the Agency for Healthcare Research and Quality (R01 HS019222-01). Dr Rundell's doctoral dissertation work was partially supported by a PhRMA Comparative Effectiveness Research Dissertation Award through the Pharmaceutical Outcomes Research and Policy Program at the University of Washington.
Results
From the BOLD registry we identified 3,771 participants who met all inclusion and exclusion criteria (Figure). Among those identified, the typical participant was 73.7 years of age, female, white, married or living with a partner, and a nonsmoker. Approximately 29% had a high school education or less, and 57% had had back pain for 3 months or less. At baseline, the mean RMDQ score was 9.1 (SD=6.2), the mean back pain NRS score was 4.8 (SD=2.7), and the mean Brief Pain Inventory score was 3.3 (SD=2.4). Most participants had leg pain (64%), 13% had symptoms of anxiety, and 8.4% had symptoms of depression. There were 719 participants (19.1%) with low use of all physical therapy services (1–4 physical therapy CPT codes), 351 (9.3%) with medium use (5–9 physical therapy CPT codes), 125 (3.3%) with high use (10–14 physical therapy CPT codes), and 90 (2.4%) with very high use (≥15 physical therapy CPT codes). The baseline characteristics of the cohort and participants in each category are described further in Table 1.
Table 1.
Baseline Characteristics of Participants Grouped by Use of Physical Therapya
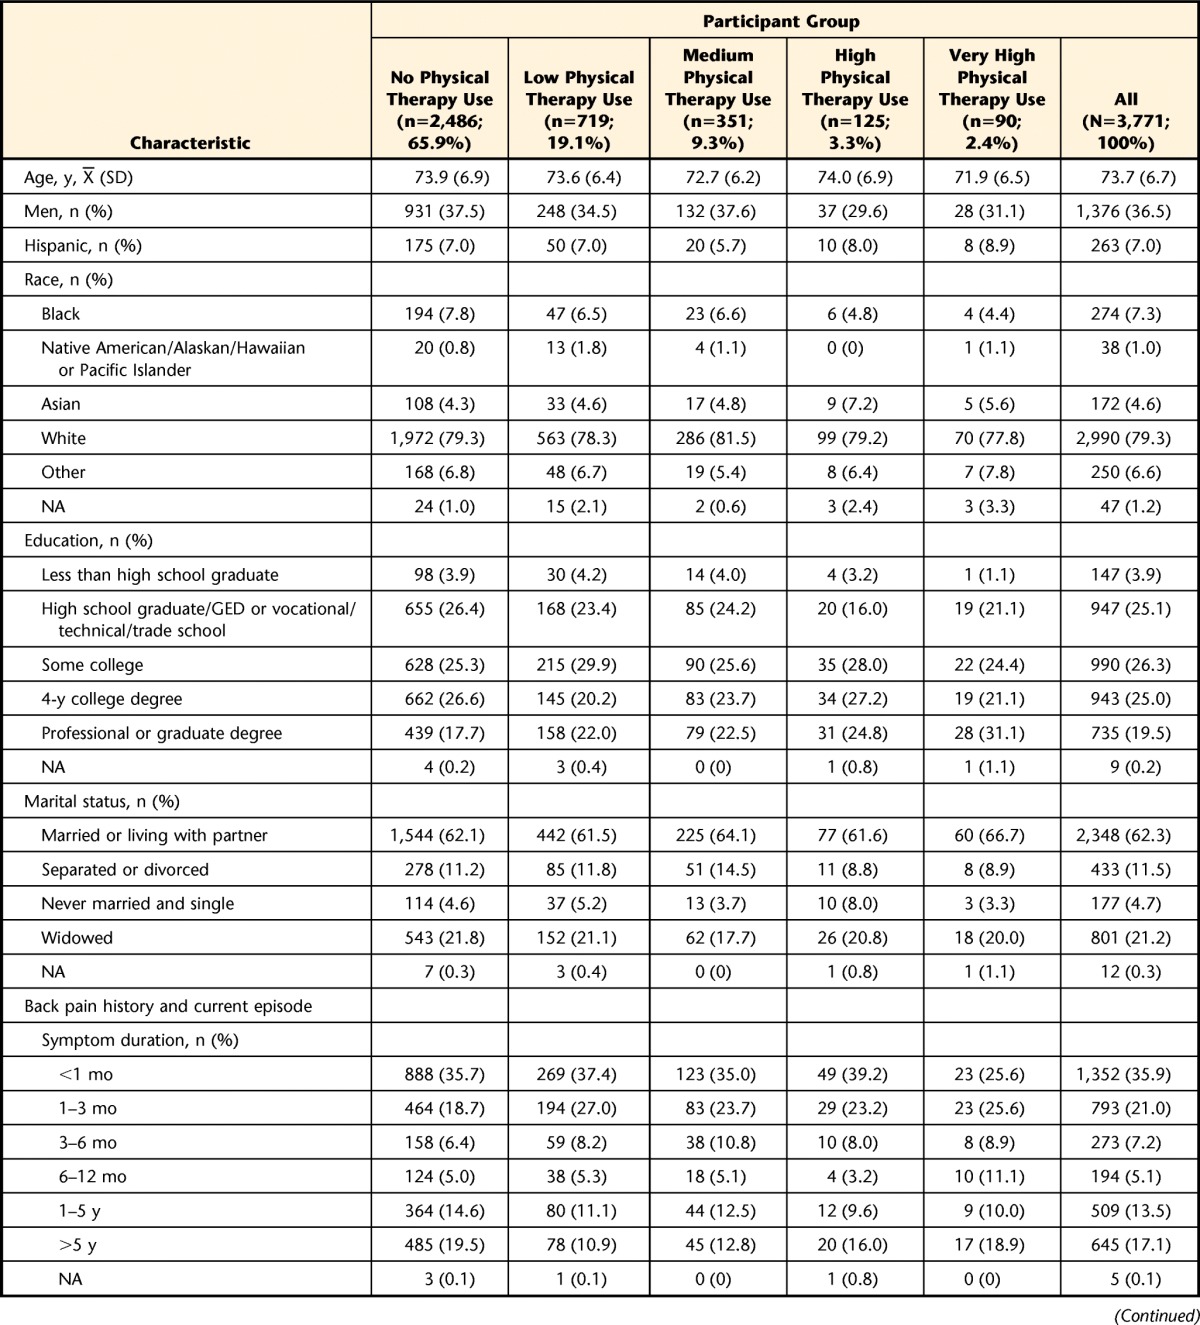
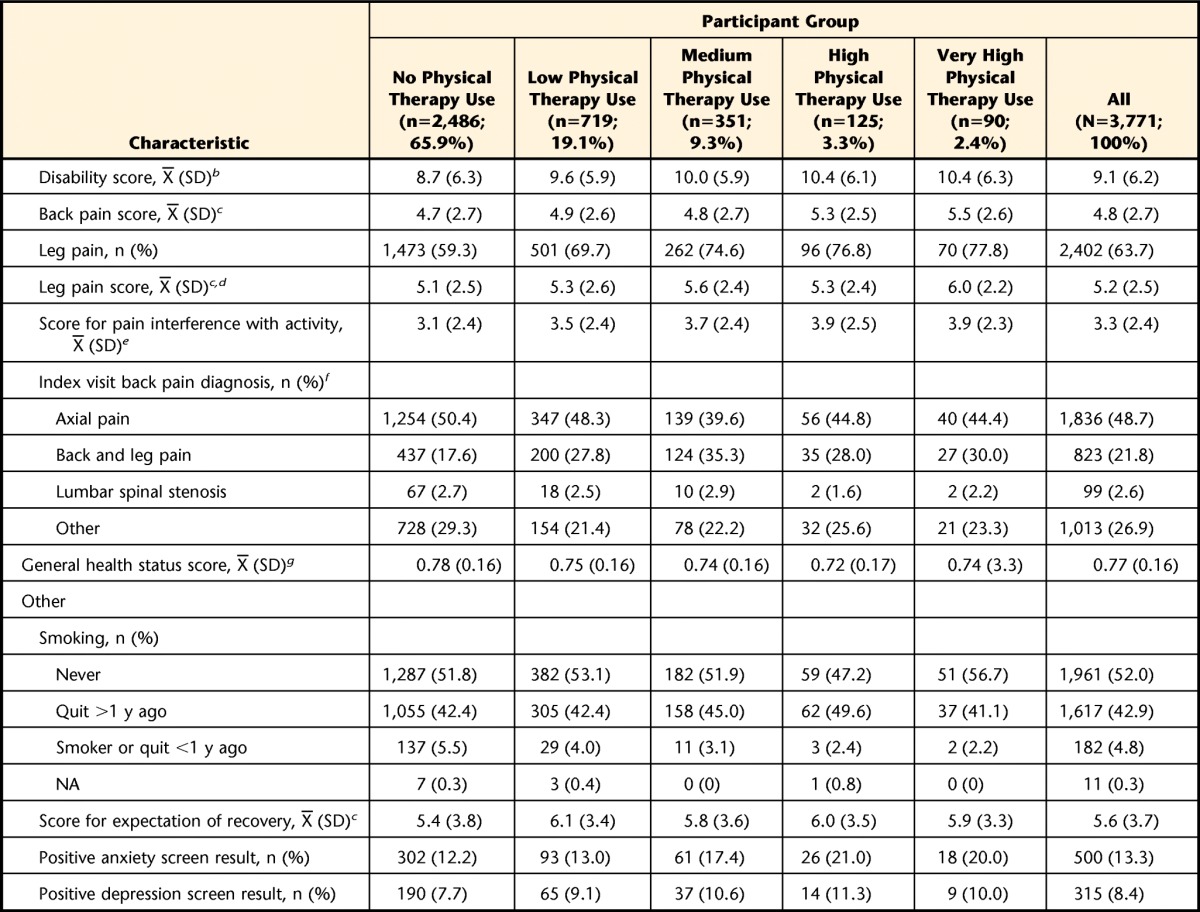
Data are reported as mean (standard deviation) or number (percentage) of participants. NA=not answered, GED=General Equivalency Diploma.
b Scored from 0 to 24 on the Roland-Morris Disability Questionnaire.
c Scored from 0 to 10 on the numerical rating scale.
d Participants with leg pain only.
e Scored from 0 to 10 on the Brief Pain Inventory.
f As coded with the International Classification of Diseases, 9th Revision.
g Scored from 0 to 1 on the EQ-5D-5L.
Physical Therapy Use
A total of 1,285 participants (34.1%) received physical therapist services. For those participants, the median number of physical therapy CPT codes was 4, and the interquartile range was 2 to 8. The median number of active physical therapy CPT codes was 2 (interquartile range=1–4). For passive physical therapy and manual therapy, the median number of CPT codes was 0 (interquartile ranges=0–0 and 0–1, respectively). Table 2 further describes the number of participants in each category.
Table 2.
Number of Physical Therapy Current Procedural Terminology (CPT) Codes by Use Category Over 12 Months

Patient-Reported Outcomes
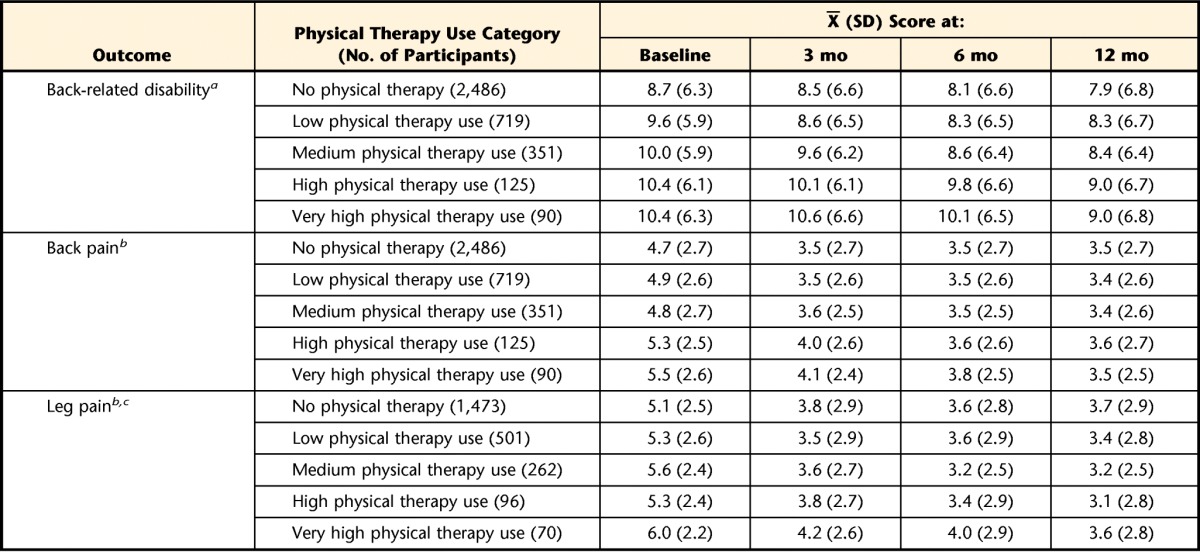
Table 3 shows unadjusted outcomes for back-related disability (RMDQ), back pain, and leg pain for each time point by group. Missing outcomes are described in the eTable. At 12 months, clinically important improvements in back-related disability were experienced by 471 participants (18.9%) who received no physical therapy, 177 (24.6%) with low physical therapy use, 85 (24.2%) with medium physical therapy use, 32 (25.6%) with high physical therapy use, and 21 (23.3%) with very high physical therapy use. Of the participants who received no physical therapy, 980 (39.4%) and 634 (25.5%) experienced meaningful changes in back pain and leg pain at 12 months, respectively. Clinically important improvements in back pain and leg pain at 12 months occurred in 312 participants (43.4%) and 252 participants (35.0%) with low physical therapy use, 137 (39.0%) and 128 (36.5%) with medium physical therapy use, 55 (44.0%) and 54 (43.2%) with high physical therapy use, and 42 (46.7%) and 36 (40.0%) with very high physical therapy use, respectively (eFigure).
Table 3.
Unadjusted Outcomes for Back-Related Disability, Back Pain, and Leg Pain by Physical Therapy Use Category
a As determined with the Roland-Morris Disability Questionnaire.
b As determined with the numerical rating scale.
c Participants with leg pain only.
Comparison of Adjusted Outcomes by Use Category
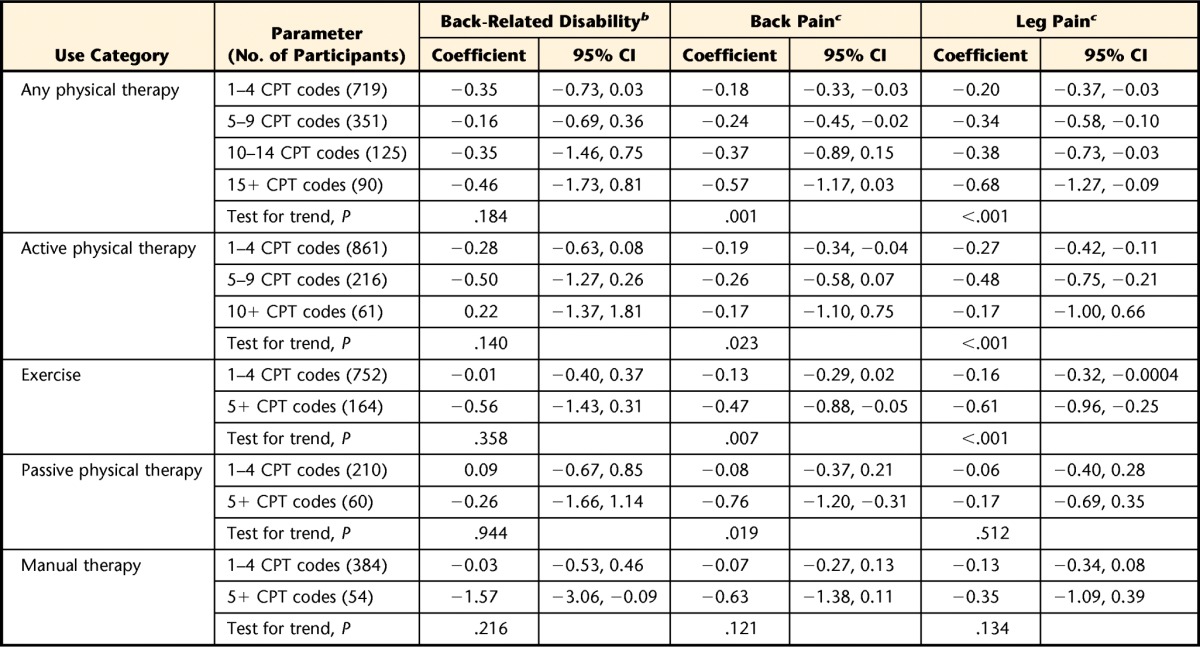
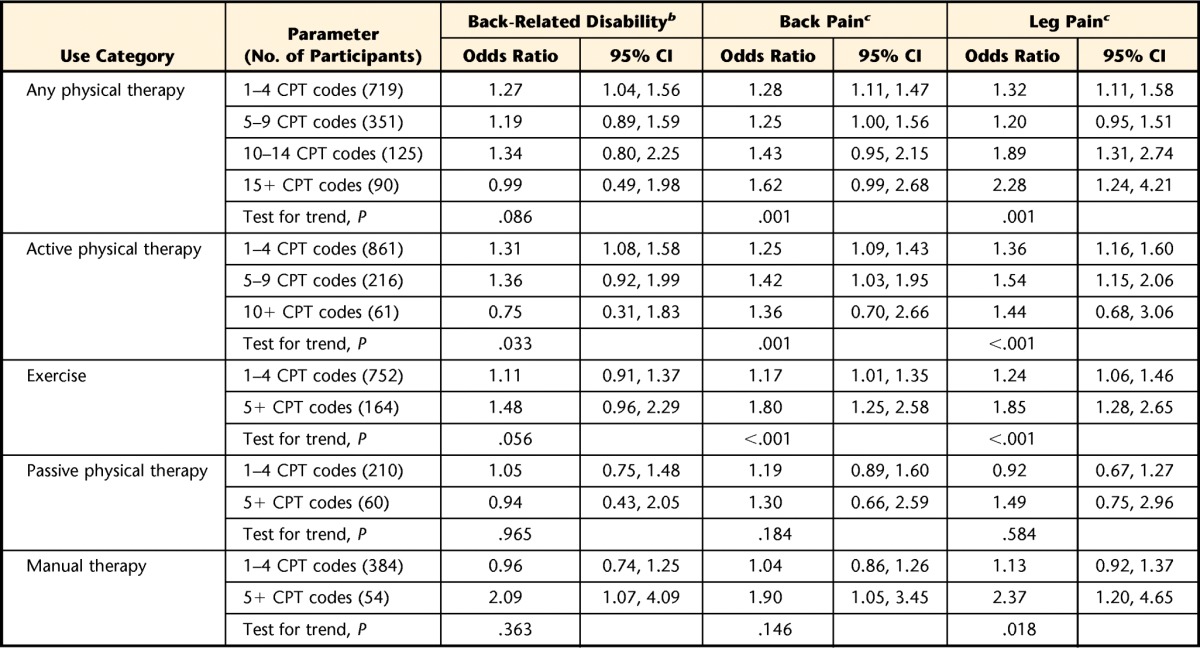
The results obtained from the marginal structural models are shown in Tables 4 and 5. Table 4 shows the adjusted difference in mean outcome and 95% confidence interval (95% CI) for each use category relative to no use in that particular category, and Table 5 shows the adjusted odds ratio and 95% CI for each use category relative to no use of that particular category.
Table 4.
Adjusted Mean Difference in Back-Related Disability, Back Pain, and Leg Pain for Each Use Category Compared With No Usea
CI=confidence interval, CPT=Current Procedural Terminology.
b As determined with the Roland-Morris Disability Questionnaire (RMDQ).
c As determined with the numerical rating scale.
Table 5.
Adjusted Odds Ratio of a Minimal Clinically Important Change in Back-Related Disability, Back Pain, and Leg Pain for Each Use Category Compared With No Usea
CI=confidence interval, CPT=Current Procedural Terminology.
b As determined with the Roland-Morris Disability Questionnaire (RMDQ).
c As determined with the numerical rating scale.
Participants receiving higher amounts of all physical therapist services had greater improvements in back pain (P=.001) and leg pain (P<.001) and were more likely to have clinically important improvements in back pain (P=.001) and leg pain (P=.001). The differences in back pain and leg pain were all less than 1 point on the numerical rating scale.
Back-related disability, back pain, and leg pain showed no consistent relationship with the use of passive interventions. In general, the amount of manual therapy showed no statistical trend for an association with improvements in back-related disability, back pain, and leg pain. However, participants with 5 or more manual therapy CPT codes had more improvements in disability (with a score 1.57 points lower than that of those receiving no manual therapy; 95% CI=−3.06, −0.09) and were more likely to have clinically important improvements in disability (odds ratio=2.09; 95% CI=1.07, 4.09), back pain (odds ratio=1.90; 95% CI=1.05, 3.45), and leg pain (odds ratio=2.37; 95% CI=1.20, 4.65).
Average back-related disability scores did not differ by amount of active physical therapy. However, participants receiving higher amounts of active physical therapy were more likely to have clinically important improvements in back-related disability (P=.033). Participants receiving higher amounts of active physical therapy had reduced back pain intensity (P=.023) and leg pain intensity (P<.001), but these differences were less than 1 point on the numerical rating scale. Participants receiving higher amounts of active physical therapy were more likely to have clinically important changes in back pain (P=.001) and leg pain (P<.001) as well.
Sensitivity Analysis
A secondary analysis of the exercise-specific subset of active physical therapy found that participants receiving higher amounts of exercise interventions had less back pain and leg pain (P=.007 and P<.001, respectively) and were more likely to experience clinically important improvements in back pain and leg pain (P<.001 for both) (Tabs. 4 and 5).
Discussion
We found that the use of all physical therapist services and active physical therapy were most consistently associated with lower back pain and leg pain intensity and a greater likelihood of clinically important improvements in pain, but not function. However, differences in mean back-related disability or pain scores among physical therapy use groups were either insignificant or small over the course of 12 months. Few participants received high amounts of physical therapist services. Most physical therapist services were active interventions.
These results vary from those of other observational studies in which back-related disability associated with physical therapy use patterns for back pain was investigated. American adults who were less than 65 years of age, had acute back pain, and were treated by physical therapists using guideline recommendations for active physical therapy had greater improvements in disability and received less health care than adults who received non–guideline-adherent care involving passive modality use.22 A Dutch study found that better adherence to guideline-recommended active interventions was associated with improvements in back-related function for people with low back pain of unspecified duration.23
Some key differences between those studies and ours could explain these findings. First, the earlier studies compared treatment patterns characterized by guideline adherence within a cohort receiving physical therapist services. In contrast, we compared the use of each type of physical therapy service with no use of that type of physical therapy service. Additionally, our sample consisted of adults aged 65 years or older. Older adults have a worse prognosis for back pain and more chronicity.24,25 In the studies by Fritz et al22 and Rutten et al,23 the samples consisted of younger cohorts with no chronic symptoms or a smaller proportion with chronic symptoms.
Although the results must be interpreted with caution, they suggest that current, real-world practices for managing back pain in older adults may be associated with modest clinical improvements over the course of 1 year, depending on the interventions selected. Modest effects have been consistent findings in most studies of interventions for back pain.26–28 There are several potential reasons for these findings. First, the interventions may have only modest efficacy. Another reason is that older adults with a new episode of back pain may not receive the most effective interventions from physical therapists, the interventions may not be well matched to the adults, or the adults may not receive sufficient doses of the interventions. Finally, the expected prognosis for older adults with back pain is not as good as that for younger adults,24 and, on average, great improvements in function and pain may not be anticipated for older adults seeking care for their back pain.
In addition to the content, how physical therapist services are delivered may affect the real-world effectiveness of interventions for back pain in older adults, and much more information is needed on effective service delivery models for older adults with back pain. Older adults with back pain may have distinctive health needs that are associated with aging. Consequently, more coordinated, interdisciplinary models of care, rather than physical therapy alone, may be needed to produce the best health outcomes in this population. Innovative models of interdisciplinary health care may lead to more wide-reaching improvements in health outcomes than single interventions in isolation.
To our knowledge, this is one of the few studies to longitudinally investigate the use of specific types of physical therapist services and their relationships with patient-reported outcomes in a large cohort of older adults with back pain. By using advanced epidemiological methods, we were able to examine the cumulative effects of physical therapist services over time while accounting for the influence of prior treatments and outcomes. Additionally, our use of minimally restrictive exclusion criteria made our cohort a better reflection of the current population of older adults being seen by physical therapists for back pain.
Even with a strong study design and analytical methods, the results need to be viewed with some reservation. One limitation is that we defined the amounts and types of treatments using CPT codes. The CPT codes allowed us to examine categories of physical therapist services, but some inaccuracy in coding may have resulted in the misclassification of intervention categories. Misclassification may cause bias or attenuate estimates.29 Additionally, observational research with coarse categories may not be sensitive enough to detect the true effectiveness of some interventions used by physical therapists when grouped with other treatments. However, most exercise-based interventions for low back pain show comparable effectiveness, and we do not have clinical data on which to base the further subgrouping of participants.28 Finally, residual treatment selection bias, also known as confounding by indication, still may have been present if all confounders were not measured and the marginal structural models were not fully specified correctly. One potential nonmeasured confounder was a participant's treatment preference. A patient's preference for physical therapist services in general or for specific physical therapist interventions may influence the type and amount of treatment received. Treatment preference can cause bias, depending on how strongly it is related to a person's function and pain outcomes.
Another limitation was the relatively small number of participants receiving high amounts of various types of physical therapy. This characteristic made it difficult to test for nonlinear relationships for the amount of use and limited our ability to generate precise estimates for participants with high use. Finally, all participants were recruited from integrated health systems. Consequently, any unique factors that influences service delivery patterns in this setting may have limited the generalizability of the results to other settings.
In conclusion, we found that higher amounts of all physical therapist services and active physical therapy were most consistently related to improvements in pain intensity, although differences in outcomes were small. These results provide initial information on the association of different types and amounts of physical therapy services with real-world outcomes in older adults with new visits for back pain. However, these results need to be validated with a randomized controlled trial to provide higher-level evidence on what treatment patterns are optimal for managing back pain in older adults, and they should be interpreted with caution until then.
The Bottom Line
What do we already know about this topic?
Back pain is a common problem for many older adults, but few studies have examined the outcomes achieved with physical therapist services specifically in this population.
What new information does this study offer?
Greater amounts of total physical therapist treatments and active physical therapist treatments were most consistently related to improvement in pain intensity, but not disability, in older adults with back pain compared with those who did not receive these treatments. The differences in outcomes between groups, however, were small.
If you're a patient or a caregiver, what might these findings mean for you?
These findings suggest that the amount and type of physical therapist treatments received by older adults with back pain may be modestly related to the average improvement in back pain.
Supplementary Material
Appendix.
Appendix.
Current Procedural Terminology (CPT) Codes for Treatment Categories
Footnotes
All authors provided concept/idea/research design. Dr Rundell, Dr Sherman, Dr Heagerty, and Dr Jarvik provided writing. Dr Rundell, Dr Heagerty, and Dr Jarvik provided data collection and analysis, project management, and fund procurement. Dr Jarvik provided participants, facilities/equipment, and institutional liaisons. Dr Mock and Dr Jarvik provided consultation (including review of manuscript before submission).
The institutional review boards at the University of Washington and each study site (Kaiser Permanente, Henry Ford Health System, and Harvard Vanguard Medical Associates/Harvard Pilgrim Health Care) approved the Back Pain Outcomes Using Longitudinal Data (BOLD) registry.
The content of this study was presented as a poster at the 33rd Annual Scientific Meeting of the American Pain Society; May 1, 2014; Tampa, Florida.
This study was funded by the Agency for Healthcare Research and Quality (R01 HS019222-01). Dr Rundell's doctoral dissertation work was partially supported by a PhRMA Comparative Effectiveness Research Dissertation Award through the Pharmaceutical Outcomes Research and Policy Program at the University of Washington.
References
- 1. Docking RE, Fleming J, Brayne C, et al. Epidemiology of back pain in older adults: prevalence and risk factors for back pain onset. Rheumatology (Oxford). 2011;50:1645–1653. [DOI] [PubMed] [Google Scholar]
- 2. Hicks GE, Gaines JM, Shardell M, Simonsick EM. Associations of back and leg pain with health status and functional capacity of older adults: findings from the Retirement Community Back Pain Study. Arthritis Rheum. 2008;59:1306–1313. [DOI] [PubMed] [Google Scholar]
- 3. Weiner DK, Kim YS, Bonino P, Wang T. Low back pain in older adults: are we utilizing healthcare resources wisely? Pain Med. 2006;7:143–150. [DOI] [PubMed] [Google Scholar]
- 4. Gellhorn AC, Chan L, Martin BI, Friedly J. Management patterns in acute low back pain: the role of physical therapy. Spine (Phila Pa 1976). 2012;37:775–782. [DOI] [PMC free article] [PubMed] [Google Scholar]
- 5. Gliklich RE, Dreyer NA, Leavy MB, eds. Registries for Evaluating Patient Outcomes, 3rd Edition: A User's Guide. Rockville, MD: Agency for Healthcare Research and Quality; 2014. Report No. 13(14)-EHC111. [PubMed] [Google Scholar]
- 6. Dreyer NA, Garner S. Registries for robust evidence. JAMA. 2009;302:790–791. [DOI] [PubMed] [Google Scholar]
- 7. Revicki DA, Frank L. Pharmacoeconomic evaluation in the real world: effectiveness versus efficacy studies. Pharmacoeconomics. 1999;15:423–434. [DOI] [PubMed] [Google Scholar]
- 8. Jarvik JG, Comstock BA, Bresnahan BW, et al. Study protocol: the Back Pain Outcomes using Longitudinal Data (BOLD) registry. BMC Musculoskelet Disord. 2012;13:64. [DOI] [PMC free article] [PubMed] [Google Scholar]
- 9. Centers for Medicare & Medicaid Services. Therapy services. CMS.gov Web site. Available at: http://www.cms.gov/Medicare/Billing/TherapyServices/index.html?redirect=/TherapyServices/ 2013. Accessed October 2, 2014.
- 10. Roland M, Morris R. A study of the natural history of back pain, part I: development of a reliable and sensitive measure of disability in low-back pain. Spine (Phila Pa 1976). 1983;8:141–144. [DOI] [PubMed] [Google Scholar]
- 11. Deyo RA, Battie M, Beurskens AJ, et al. Outcome measures for low back pain research: a proposal for standardized use. Spine (Phila Pa 1976). 1998;23:2003–2013. [DOI] [PubMed] [Google Scholar]
- 12. Herr KA, Spratt K, Mobily PR, Richardson G. Pain intensity assessment in older adults: use of experimental pain to compare psychometric properties and usability of selected pain scales with younger adults. Clin J Pain. 2004;20:207–219. [DOI] [PubMed] [Google Scholar]
- 13. Ostelo RWJG, Deyo RA, Stratford P, et al. Interpreting change scores for pain and functional status in low back pain: towards international consensus regarding minimal important change. Spine (Phila Pa 1976). 2008;33:90–94. [DOI] [PubMed] [Google Scholar]
- 14. Kroenke K, Spitzer RL, Williams JBW. The Patient Health Questionnaire-2: validity of a two-item depression screener. Med Care. 2003;41:1284–1292. [DOI] [PubMed] [Google Scholar]
- 15. Lowe B, Wahl I, Rose M, et al. A 4-item measure of depression and anxiety: validation and standardization of the Patient Health Questionnaire-4 (PHQ-4) in the general population. J Affect Disord. 2010;122:86–95. [DOI] [PubMed] [Google Scholar]
- 16. Cleeland CS, Ryan KM. Pain assessment: global use of the Brief Pain Inventory. Ann Acad Med Singapore. 1994;23:129–138. [PubMed] [Google Scholar]
- 17. Barton GR, Sach TH, Avery AJ, et al. A comparison of the performance of the EQ-5D and SF-6D for individuals aged ≥ 45 years. Health Econ. 2008;17:815–832. [DOI] [PubMed] [Google Scholar]
- 18. Robins JM, Hernán MA, Brumback B. Marginal structural models and causal inference in epidemiology. Epidemiology. 2000;11:550–560. [DOI] [PubMed] [Google Scholar]
- 19. Suarez D, Borras R, Basagana X. Differences between marginal structural models and conventional models in their exposure effect estimates. a systematic review. Epidemiology. 2011;22:586–588. [DOI] [PubMed] [Google Scholar]
- 20. Liang K-Y, Zeger S. Longitudinal data analysis using generalized linear models. Biometrika. 1986;73:13–22. [Google Scholar]
- 21. Zeger SL, Liang KY, Albert PS. Models for longitudinal data: a generalized estimating equation approach. Biometrics. 1988;44:1049–1060. [PubMed] [Google Scholar]
- 22. Fritz JM, Cleland JA, Brennan GP. Does adherence to the guideline recommendation for active treatments improve the quality of care for patients with acute low back pain delivered by physical therapists? Med Care. 2007;45:973–980. [DOI] [PubMed] [Google Scholar]
- 23. Rutten GM, Degen S, Hendriks EJ, et al. Adherence to clinical practice guidelines for low back pain in physical therapy: do patients benefit? Phys Ther. 2010;90:1111–1122. [DOI] [PubMed] [Google Scholar]
- 24. Scheele J, Enthoven WT, Bierma-Zeinstra SM, et al. Course and prognosis of older back pain patients in general practice: a prospective cohort study. Pain. 2013;154:951–957. [DOI] [PubMed] [Google Scholar]
- 25. Knauer SR, Freburger JK, Carey TS. Chronic low back pain among older adults: a population-based perspective. J Aging Health. 2010;22:1213–1234. [DOI] [PubMed] [Google Scholar]
- 26. Rubinstein SM, Terwee CB, Assendelft WJ, et al. Spinal manipulative therapy for acute low back pain: an update of the Cochrane review. Spine (Phila Pa 1976). 2013;38:E158–E177. [DOI] [PubMed] [Google Scholar]
- 27. Chou R, Atlas SJ, Stanos SP, Rosenquist RW. Nonsurgical interventional therapies for low back pain: a review of the evidence for an American Pain Society clinical practice guideline. Spine (Phila Pa 1976). 2009;34:1078–1093. [DOI] [PubMed] [Google Scholar]
- 28. Hayden JA, van Tulder MW, Malmivaara A, Koes BW. Exercise therapy for treatment of non-specific low back pain. Cochrane Database Syst Rev. 2005;3:CD000335. [DOI] [PMC free article] [PubMed] [Google Scholar]
- 29. Koepsell TD, Weiss NS. Epidemiologic Methods: Studying the Occurrence of Illness. New York, NY: Oxford University Press; 2003. [Google Scholar]
Associated Data
This section collects any data citations, data availability statements, or supplementary materials included in this article.


