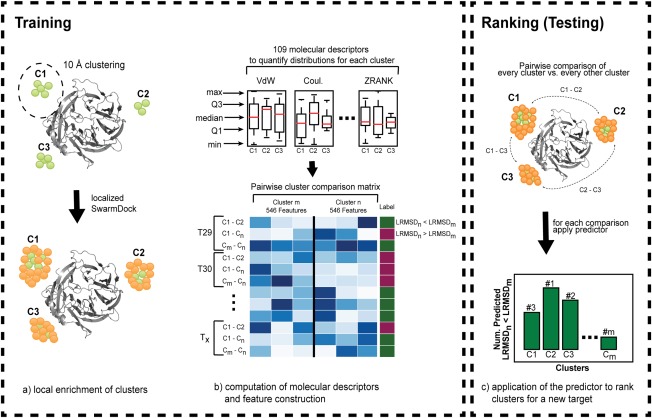
Figure 1.

Schematic overview of the method. In a first step (a) decoys are clustered with a 10 Å cutoff and clusters are enriched with additional solutions with localized SwarmDock runs. Green and orange spheres around the receptor (grey) represent the center of mass of ligand positions before and after enrichment, respectively. (b) For each model of a cluster 109 molecular descriptors are computed and grouped by cluster to quantify the protein–protein interaction. These distributions are characterized by min, Q1, median, Q3 and max that represent the features for a supervised learning algorithm. Finally, a matrix is generated which compares all possible combinations of clusters for each target to train a binary classifier where LRMSDn < LRMSDm produces label 1 otherwise 0. (c) To rank clusters for a new target the classifier is applied to all possible cluster comparisons. Counted is the number of times a cluster was predicted to have a lower LRMSD compared to another cluster. Ranking is based on descending order where the cluster with the highest number is ranked first and the cluster with the lowest number is ranked last.
