Abstract
Objectives
The purpose of this article was to present an original standardized tool assessing the medicine's acceptability whichever their characteristics and the patient features.
Methods
An acceptability map was built with objective measures from medicine use assessments collected in real‐life conditions. Multiple correspondence analysis (MCA) was used for the mapping process. Hierarchical classification on the principal components (HCPC) of the MCA was performed for the clustering process corresponding to distinct acceptability profiles.
Key findings
The results presented here focus on 234 evaluations issued from the paediatric population and gathered in four clusters: ‘well‐accepted’ (50%), ‘accepted’ (19%), ‘poorly accepted’ (25%) and ‘not accepted’ medicines (6%). The first one was characterized by a dose fully taken, in a short time, with a patient's positive reaction; the second by a longer administration time, a neutral reaction and the use of methods to achieve administration (reward, divided dose). Differentiation between the two last clusters was, respectively, originated by a required dose partially taken or not taken.
Conclusions
The acceptability profile of each medicine can be evaluated with the map position of the related patient's assessments barycentre. This tool should satisfy expectations in terms of methods for appropriate acceptability evaluation and standardized comparison among medicines.
Keywords: acceptability, child, drug formulations, evaluation
Introduction
Guidance issued by the European Medicines Agency (EMA)1 defines patient acceptability as ‘the overall ability and willingness of the patient to use and its caregiver to administer the medicine as intended’. Acceptability is also considered to be ‘driven by the characteristics of the user (age, ability, disease type and state) and by the characteristics of a medicinal product’.2 Palatability, swallowability, appearance, complexity of modification before administration, required dose, container or administration device use and mode of administration are proposed as characteristics of the medicinal product.
Consideration of patient acceptability is necessary to optimize patient adherence in order to reach the efficacy and safety of medicines. It becomes of utmost importance in populations such as paediatric or geriatric which require particular attention to prevent unlicensed used or non‐compliance. Effectively, unauthorized tablet crushing or capsule opening for child and elderly patients is frequently reported in literature whereas it may cause dosing inaccuracies and impair bioavailability.3, 4 Unaccepted medication rejected by the children is also an important problem for caregivers that cannot achieve the prescribed treatment; however, this reflex is the reflection of the child's basic biology.5
Furthermore, the main elements impacting on acceptability which have to be considered in acceptability testing may differ depending on medicines and patient: taste is a crucial criteria for acceptability of oral medicines but not of ear or ocular preparations. This parameter is also more important for the paediatric population than for elderly because taste sensitivity is decreased in this population.6
In this context, however EMA identified that ‘knowledge on acceptability testing is still fragmented’ and ‘an internationally harmonized method has not yet been developed’, the institution specified its expectations in the guideline on pharmaceutical development of medicines for paediatric use. ‘Acceptability should be an integral part of the pharmaceutical and clinical development’ and ‘should be preferably studied in children themselves’.
Consequently, we developed an original tool designed to meet these expectations: a model based on mapping and clustering processes providing relevant standardized acceptability assessments whichever the medicines’ and the patients’ characteristics. To illustrate the utilization of this new tool, we focused on the paediatric population results, which represents a challenge of assessment harmonization, considering the difficulties to report assessment during the first years,7 the variation of the caregiver involvement and the capacity of patients to accept and use medicines.8
Materials and Methods
Data on medicines use
Objective measures were used to collect real‐life data on medicines use. These measures focused on the following observable content: the time needed to prepare and administrate medicine,9, 10 the volume of the required dose taken by the patient,11, 12, 13 the patient's reaction during administration12, 14 and the use of methods to achieve administration (dividing the required dose, crushing the medicine, using food or drink, promising a reward or using restraint).10, 15 These observational measures considered indirectly the critical aspects of products affecting acceptability and thus reflected appreciation and usability of medicines by both patients and potential caregivers.
These generic measures provided standardized data regardless of the medicines’ and patients’ characteristics. The latter made directly by patients themselves based on their perception may require distinct measures to obtain relevant data. Specific subjective measures ensured the relevance of considered aspects in acceptability testing depending on the type of products studied, or guarantee people's understandability according to their features such as age. Some people are not able to report themselves reliable and valid information on their feeling especially children under 6.16 In such a case, observational measures can be used rather than proxy measures which require interpretation about the subjective experience of patients.17
Data collection
Pharmacists into community dispensaries throughout France were randomly selected in a sample of a national database and recruited on a voluntary basis, and some physicians and pharmacists selected from Paris area also participated in the pilot study. They were invited to propose the study to all the parents of the children under 15 receiving any treatment. Parents were invited to fill a Web questionnaire focusing on the first medicine's administration following study inclusion. The inform consent form delivered to participants contained the arrangements for participation specifically a unique login code and the observational measures that need to be performed by an observer during the medicine use.
Participants were invited to provide information: (1) medicine features (the medicine's name (brand name + strength + dosage form) and the required dose); (2) patient features (age, gender and knowledge of the medicine); (3) observational measures (the result of the administration, the child reaction on a 3‐point hedonic scale and the time between the opening of the secondary container and the end of the administration with an accuracy of 10 s); (4) objective information on medicine use (the methods used to achieve administration (divide the dose; use food or drink to mask the taste or ease swallowing; use a reward; use restraint) and the person(s) in charge of manipulation and administration); (5) subjective information on medicine use (perception of the child/parent on the easiness of the medicine preparation and the easiness of the medicine intake on a 4‐point Likert's scale then additional remarks on medicine acceptability).
The medicine's names collection was based on the French public database.18 The medicine's characteristics were collected in their summary of product characteristics (SmPC).
This study was strictly observational. As such, it did not influence patient treatment and usual child medical care and it did not impact on the physical or psychological integrity. Furthermore, data were provided directly by the participants on a voluntary basis and data collection has been performed in a complete anonymous way. Consequently, according to French regulations, ethical committee and data protection authority approval were not deemed mandatory.
Statistical analysis and Acceptability map design
Acceptability map
Multiple correspondence analysis (MCA) was used for the mapping process. Each evaluation (1 medicine taken by 1 child) was defined by one of the response options (categories) to each observational measure and method used to achieve administration (variables). The dimensions of the MCA explaining the greater amount of variance of the data set are selected to design the acceptability map.
The categories and the evaluations were positioned together on the acceptability map. The Figure 1 illustrates how the categories of a variable were positioned around the zero of the map, which is the barycentre of all categories. The more the category was answered, the closest from the zero of the map it was. Interpretation was based on proximities between elements on the acceptability map. The proximity between categories revealed that they were often selected together during the evaluations.
Figure 1.
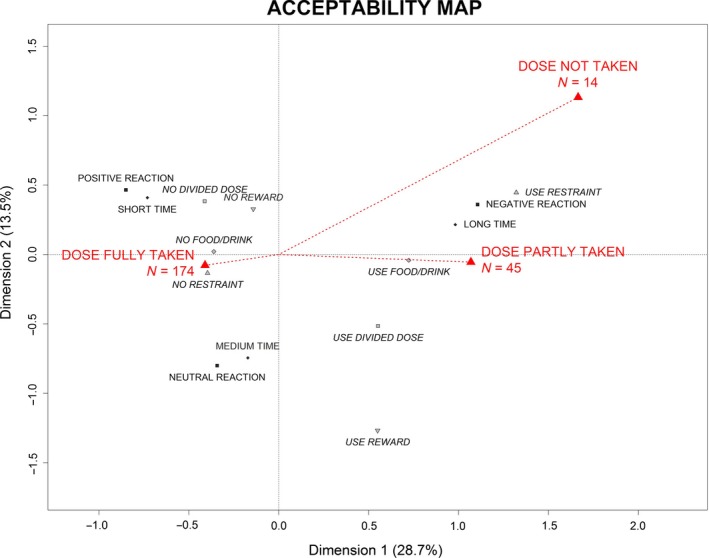
Positioning the categories of a variable on the acceptability map.
The Figure 2 illustrates (in 2 dimensions) how the evaluations were positioned at the barycentre of their categories (in 3 dimensions). For example, the evaluation 156 was positioned at the barycentre of ‘dose not taken’, ‘use restraint’, ‘negative reaction’, ‘long time’, ‘no food/drink’, ‘use divided dose’ and ‘no reward’. Evaluations were characterized by the closest categories on the acceptability map. Evaluations were close on the map if the results of their evaluation were similar.
Figure 2.
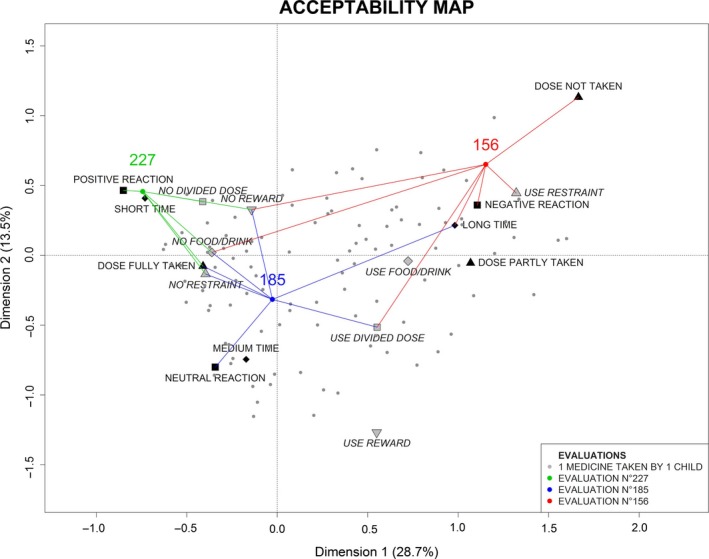
Positioning of medicine's assessments on the acceptability map.
F‐tests and then t‐tests were performed to highlight the variables; then, the categories significantly linked to each dimension.
Acceptability profiles
The hierarchical classification on the principal components (HCPC) of the MCA was used for the clustering process.19 Based on the positions of the evaluations on the acceptability map, this analysis gathered them into clusters. The clusters defined distinct acceptability profiles. Each cluster was characterized by a specific pattern of objective measures. The categories over‐represented in the clusters had a V‐test value greater than 1.96 (P‐value < 0.05). The higher the value, the more strongly the category was over‐represented in the cluster.
Acceptability of a medicine
The position of a selected medicine on the acceptability map was defined by the barycentre of the evaluations corresponding to the selected medicine. This barycentre was associated to an acceptability profile. Based on sample data, the confidence ellipse, drawn around the barycentre, held the true medicine's position in the population with a probability of 90%. Position on the acceptability map of two medicines was significantly different if their ellipses do not overlap.
The Figure 3 illustrates the place of a selected medicine (labelled A) on the acceptability map. The individual evaluations corresponding to this medicine were located into the four clusters in various proportions. Then, the barycentre coordinates were calculated and plotted on the acceptability map with its confidence area. The acceptability profile of the medicine A was defined with the cluster 1.
Figure 3.
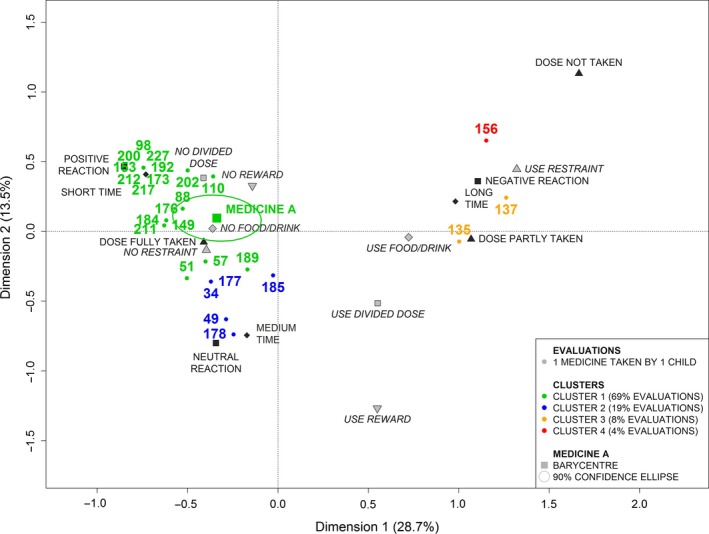
Positioning of a medicine on the acceptability map.
Model validity
To assess the model validity, we studied the link between the acceptability assessments provided by our model (based on objective data) and the subjective perception of medicine's users. Chi‐square tests were used to assess a potential relationship between the acceptability profile of a medicine (cluster) and the users’ perception regarding the easiness of the medicine preparation and the easiness of the medicine intake.
Softwares
R and SAS were used. The R packages FactoMineR20 and MissMDA21 were used to perform MCA and HCPC and to handle missing data. Data analyses in R and results were checked with SAS 9.4 for patients with complete data.
Results
Sample of patients
Between 7 May 2015 and 22 December 2015, there were 234 children under 15 included in the study. Table 1 presents the demographic characteristics of the patients.
Table 1.
Demographic characteristics of the patients
| Population (n = 231) | |||
|---|---|---|---|
| Characteristics | n | (%) | |
| Gender | Girl | 125 | (54) |
| Boy | 108 | (46) | |
| Age (year) | [0; 2] | 101 | (43) |
| [3; 5] | 74 | (32) | |
| [6; 8] | 35 | (15) | |
| [9; 11] | 16 | (7) | |
| [12; 14] | 8 | (3) | |
Sample of medicines
A medicine is defined by a specific combination of brand name, strength and dosage form. There were 109 distinct medicines assessed in the study. Table 2 presents the characteristics of the medicines. Among these medicines, 45% were assessed more than once.
Table 2.
Characteristics of the assessed medicines
| Medicines (n = 109) | |||
|---|---|---|---|
| Characteristics | n | (%) | |
| Routes of administration | Oral | 93 | (85) |
| Other (n ≤ 5): ocular, rectal, pulmonary, nasal, sublingual, ear preparation | |||
| Dosage forms | Powder for oral suspension | 30 | (28) |
| Syrup | 11 | (10) | |
| Oral solution | 10 | (9) | |
| Oral suspension | 9 | (8) | |
| Granules for oral suspension | 6 | (6) | |
| Other (n ≤ 5): orally disintegrating tablet, drops for oral solution, powder for oral solution, ocular solution, tablet, suspension for inhalation, coated tablet, suppository, solution for spray, dispersible tablet, ocular ointment… | |||
| Anatomic therapeutic subgroups (ATC2) | Antibacterials for systemic use (J01) | 39 | (36) |
| Corticosteroids for systemic use (H02) | 9 | (8) | |
| Analgesics (N02) | 9 | (8) | |
| Cough and cold preparations (R05) | 8 | (7) | |
| Antihistamines for systemic use (R06) | 7 | (6) | |
| Other (n ≤ 5): Ophthalmologicals (S01), Drugs for obstructive airway diseases (R03), Nasal preparations (R01), Vitamins (A11), Antidiarrheals intestinal anti‐inflammatory (A07), Drugs for functional gastrointestinal disorders (A03)… | |||
Objective measures
Figure 4 presents the observational measures for the 234 evaluations. During the first medicine administration, the required dose was fully taken for three‐fourths of the children (Figure 4a) with an equitable distribution of the patient's reaction (Figure 4b).
Figure 4.
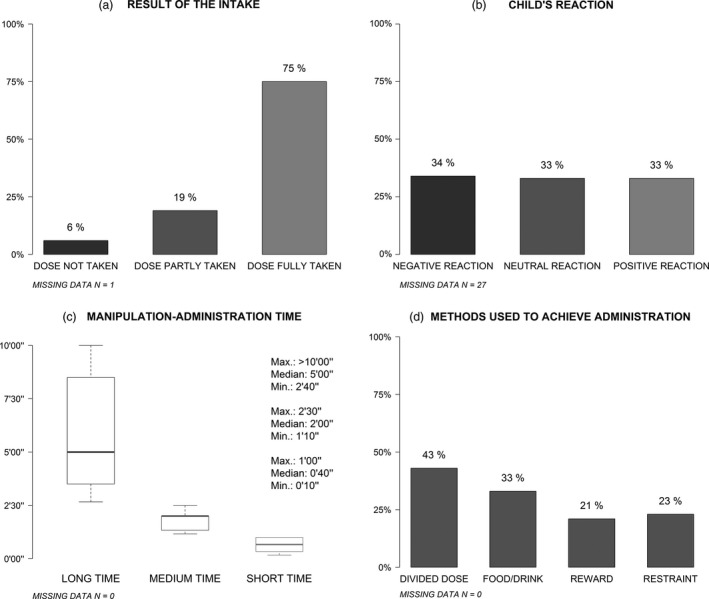
Observational measures.
The minimum time needed for manipulation and administration of medicine was 10 seconds (the scale's lower limit), and the maximum was more than 10 min (the scale's upper limit) (Figure 4c). The median time was 1 min and 40 s. The first and the third quartiles were, respectively, 1 min and 3 min and 30 s. These data were transformed into a categorical variable with three categories corresponding to thirds: ‘short time’, ‘medium time’ and ‘long time’. The median time for the ‘short time’ category was 40 s, and the maximum was 1 min. The median time for the ‘medium time’ category was 2 min, and the maximum was 2 min and 30 s. The last category included manipulation and administration time upper than 2 min and 30 s with a median of 5 min.
Regarding the methods used to achieve administration, for 43% of the children the required dose was divided so not taken as a whole, for 33% of the children food or drink were used, either mixed with drug or taken just before or after administration to mask the taste or ease swallowing, for 21% of the children a reward was promised and for 23% restraint was used (Figure 4d).
Acceptability map
The MCA explained the total variance of the data set with 10 dimensions. The first 3 dimensions explained a greater amount of variance than the average amount per dimension of 10%. The first dimension accounted for 28.7% of the explained variance, the second for 13.5% and the third for 10.8%.
Table 3 highlights the significant link between the categories and the dimensions.
Table 3.
Dimensions description by categories
| Variables | Categories | Dimension 1 | Dimension 2 | Dimension 3 |
|---|---|---|---|---|
| Result of the intake | Dose not taken | 684.10−12 | 487.10−06 | 118.10−32 |
| Dose partly taken | 111.10−17 | – | 124.10−26 | |
| Dose fully taken | 207.10−35 | 445.10−02 | 466.10−03 | |
| Child's reaction | Negative reaction | 164.10−42 | 574.10−06 | – |
| Neutral reaction | 108.10−04 | 325.10−15 | – | |
| Positive reaction | 239.10−21 | 986.10−08 | – | |
| Manipulation–administration time | Long time | 426.10−34 | 210.10−02 | – |
| Medium time | – | 255.10−15 | – | |
| Short time | 676.10−21 | 905.10−07 | – | |
| Divided dose | Use divided dose | 108.10−14 | 904.10−13 | – |
| No divided dose | 108.10−14 | 904.10−13 | – | |
| Food/drink | Use food/drink | 155.10−17 | – | 846.10−10 |
| No food/drink | 155.10−17 | – | 846.10−10 | |
| Reward | Use reward | 145.10−05 | 794.10−29 | 305.10−07 |
| No reward | 145.10−05 | 794.10−29 | 305.10−07 | |
| Restraint | Use restraint | 318.10−39 | 161.10−04 | 335.10−02 |
| No restraint | 318.10−39 | 161.10−04 | 335.10−02 |
Significant t‐test P‐value at the 5% threshold for categories.
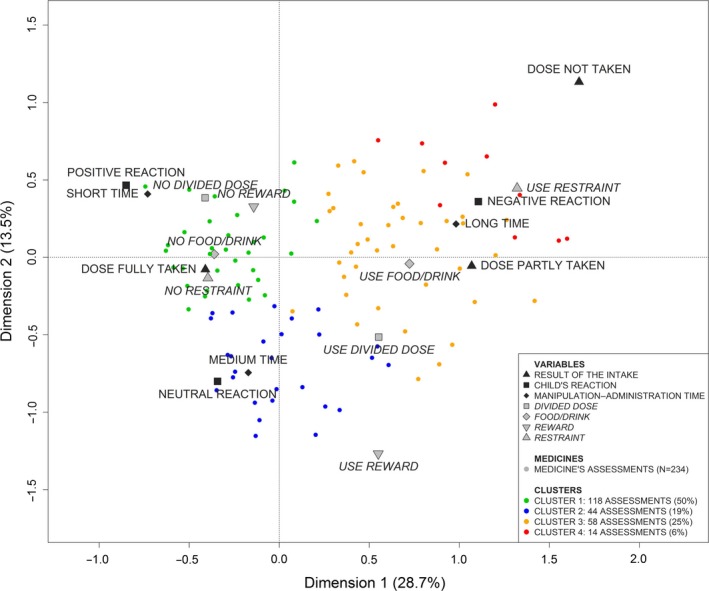
Figure 5 presents the first two dimensions of the map. These dimensions are the most important as they summarized 42.2% of the total inertia.
Figure 5.
Acceptability map for pediatric population (dimensions 1 and 2).
The first dimension opposes the categories positively connoted on the left side of Figure 5: dose fully taken, short time, positive reaction, neutral reaction, no restraint, no food/drink, no divided dose and no reward; to the categories negatively connoted on the right side: dose not taken, dose partly taken, long time, negative reaction, use of restraint, use of food/drink, divided dose, use reward.
The second dimension opposes on the left side of Figure 5 the categories on the top: positive reaction, short time, no reward and no divided dose; to the categories on the bottom: neutral reaction, medium time and no restraint. This dimension opposes on the right side the categories on the top: dose not taken, long time, negative reaction and use restraint; to the categories on the bottom: use divided dose and use reward.
Medicines with negative coordinates on the first dimension of the acceptability map are defined by categories positively connoted thus tend to be accepted. Medicines, which are the furthest away from the origin, are the most accepted. Those with positive coordinates on the second dimension are better accepted than those with negative coordinates. Medicines with positive coordinates on the first dimension are characterized by categories negatively connoted and thus tend to be poorly accepted. Those with positive coordinates on the second dimension tend to be less accepted than those with negative coordinates.
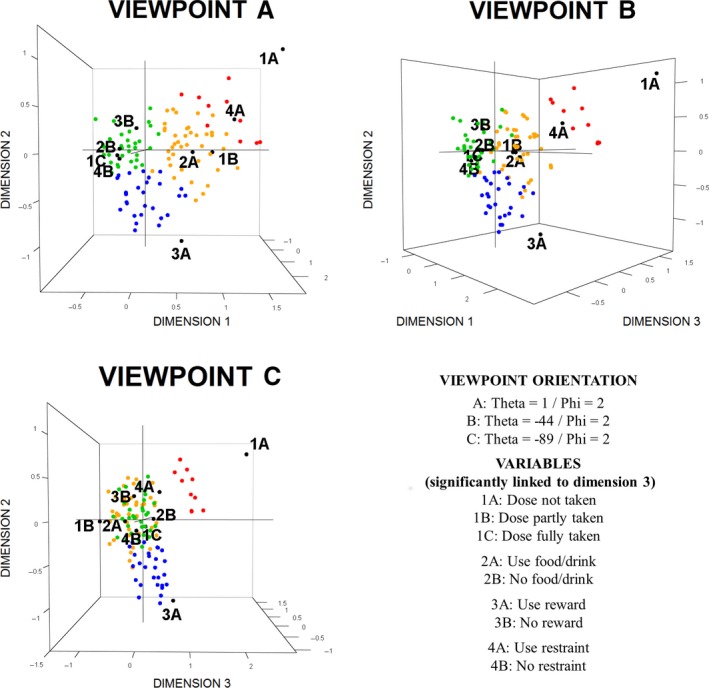
Figure 6 presents the third dimension with two rotations (45°) about the second dimension of the acceptability map. The third dimension mainly parts the medicines defined by the categories negatively connoted on the right side of Figures 5 and 6A. Those with higher positive coordinates on the third dimension were not taken by the patients while those with negative coordinates were partly taken.
Figure 6.
3D acceptability map for pediatric population.
The 234 evaluations were plotted on the acceptability map. On Figures 5 and 6, only 110 points are visible. Some evaluations have exactly the same position on the map because they were similarly assessed. On the map, 67 visible points correspond to a unique assessment, 22 points correspond to 2 evaluations, 10 points to 3 evaluations, 6 points to 4 evaluations, 1 point to 5 evaluations and 1 point to 6 evaluations. The points with the following coordinates dim.1 = −0.62/dim.2 = 0.08/dim.3 = 0.16, dim.1 = −0.63/dim.2 = 0.04/dim.3 = −0.07 and dim.1 = −0.74/dim.2 = 0.46/dim.3 = −0.04 correspond, respectively, to 12, 17 and 29 evaluations.
Acceptability profiles
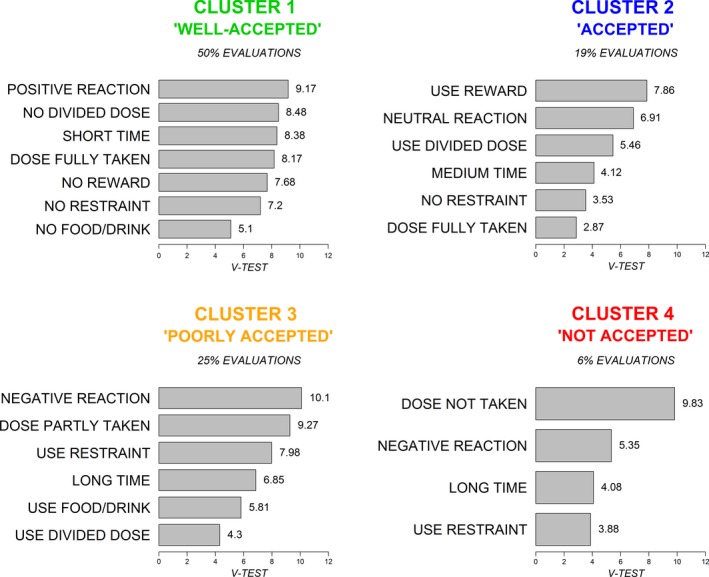
The 234 evaluations were gathered into 4 clusters corresponding to the following acceptability profiles: ‘well‐accepted’, ‘accepted’, ‘poorly accepted’ and ‘not accepted’. Each evaluation is coloured depending on the cluster it belongs to on Figure 5. The ‘well‐accepted’ cluster gathered 118 evaluations (50%), 44 evaluations were grouped into cluster 2 (19%), 58 into cluster 3 (25%) and 14 into cluster 4 (6%). The clusters correspond to different acceptability profiles. Figure 7 presents the specific patterns of categories significantly linked to each cluster.
Figure 7.
Clusters description.
The cluster 1 included 93.1% of the evaluations within the ‘positive reaction’ category, 85.1% of the ‘short time’ category, 65.1% of the ‘dose fully taken’ category, 73.9% of the ‘no divided dose’ category, 62.8% of the ‘no restraint’ category, 62.4% of the ‘no reward’ category and 62.2% of the ‘no food/drink’ category. This cluster was thus characterized by a pattern of positively connoted categories and defined a profile of ‘well‐accepted’ medicines.
The cluster 2 grouped 62.5% of the evaluations of the ‘use reward’ category, 35.0% of the ‘use divided dose’ category, 42.9% of the ‘neutral reaction’ category, 35.7% of the ‘medium time’ category, 22.9% of the ‘dose fully taken’ category and 23.3% of the ‘no restraint’ category. This cluster was characterized by a pattern of categories with a fairly positive valence. It thus defined a profile of ‘accepted’ medicines.
The cluster 3 contained 65.4% of the evaluations in the category ‘negative reaction’, 82.2% of the ‘dose partly taken’ category, 68.5% of the ‘use restraint’ category, 53.2% of the ‘long time’ category, 48.7% of the ‘use food/drink’ category and 39.0% of the ‘use divided dose’ category. This cluster was thus characterized by a pattern of negatively connoted categories and defined a profile of ‘poorly accepted’ medicines.
The last cluster included 100% of the evaluations within the ‘dose not taken’ category, 17.9% of the ‘negative reaction’ category, 18.5% of the ‘use restraint’ category and 15.6% of ‘long time’ category. In addition to a pattern of negatively connoted categories, this cluster was also characterized by a medicine not taken. It defined a profile of ‘not accepted’ medicines.
Model validity
To evaluate the validity of the clusters scoring, we pooled the evaluations of the cluster 1 (well‐accepted) with the evaluations of the cluster 2 (accepted), and we pooled the evaluations of the clusters 3 (poorly accepted) with the evaluations of the cluster 4 (medicines not accepted). The user perception regarding the medicine intake easiness was gathered into 2 groups: easy intake (‘strongly agree’ and ‘agree’ with the allegation ‘this medicine in its actual form (flavour, texture, size, route of administration, packaging, administration device, etc.) is taken easily’) and difficult intake (‘disagree’ and ‘strongly disagree’ with the previous allegation). A chi‐square test indicated that there was a statistically significant relationship between acceptability profiles and user perception regarding the medicine use (P‐value < 0.0001).
Then, we explored separately the relationship between the 2 first clusters (well‐accepted/accepted) and the agreement with the allegation (strongly agree/agree). The level ‘strongly agree’ was more represented in cluster 1 than in cluster 2, and a higher representation of ‘agree’ was found in cluster 2 compared with cluster 1. The level of the user perception was concluded to be statistically significant related to clusters (P‐value < 0.0001).
Finally, we explored the evaluations of the two last clusters to assess whether they were associated to the level of difficulty, ‘disagree’ and ‘strongly disagree’. A higher representation of ‘disagree’ was found in cluster 3 compared with cluster 4, and the ‘strongly disagree’ was more represented in cluster 4 than in cluster 3. Fisher's exact test was used due to low frequency in one cell (<5). The test showed a significant relationship (P‐value = 0.0154).
Discussion
In this study, data on medicine use were collected for a wide range of medicines (7 routes of administration and 21 dosage forms) in heterogeneous patients from newborn to 14 years old with different diseases (23 therapeutic groups). The observational measures used provide objective data whichever the characteristics of medicines and patients. This method using real‐life data offers the opportunity to study acceptability directly in targeted paediatric population as recommended by EMA.
A paediatric acceptability map was built based on 234 evaluations of medicine use. The evaluations were gathered into 4 clusters characterized by specific patterns of observational measures. The clusters correspond to 4 distinct acceptability profiles: ‘well‐accepted’, ‘accepted’, ‘poorly accepted’ and ‘not accepted’.
The clusters 3 and 4 (respectively, ‘poorly accepted’ and ‘not accepted’) gathered 31% of the evaluations. These medicines were partly or not taken by the children during the first administration following treatment delivery. If the methodology of the study is not designed to provide representative data of whole paediatric population, this percentage underlines the major acceptability issue in designing appropriate formulations adapted to paediatric use.4, 22
Any medicine can be positioned on the acceptability map using the barycentre of at least 30 evaluations. The barycentre is localized in a cluster corresponding to the acceptability profile of the medicine. Thus, it defines the medicine's acceptability in the studied population; however, it does not characterize each patient's acceptability. The barycentre is surrounded by a confidence ellipse reflecting the accuracy of estimation and the variability of patient's acceptability. A large ellipse indicates a high variability between patient's acceptability.
The tool we developed provides standardized assessments of acceptability and thus allows comparing the acceptability of different medicines. The acceptability of two medicines is significantly different if their confidence ellipses do not overlap. It may be relevant to compare acceptability among groups of medicines such as generic groups which include medicines with similar active substance, strength and dosage form or therapeutic groups as antibacterials, analgesics or antihistamines. It is also relevant to compare acceptability of medicines between different groups of patients differing in age or cultural background. These characteristics of patients could impact the acceptability of medicine and the preference among the different formulations (form, flavour, etc.).1 Hence, exploring the results by age or country could allow acceptability assessment of medicine in a specific population.
In addition, the barycentre of the evaluations of distinct medicines with similar characteristics could be positioned on the acceptability map. That allows comparing the acceptability of different active substances, strength or dosage forms regardless of other characteristics of medicines.
This method aims to design a descriptive model, which fits the real‐life data collected. By continuously implementing our model with new data, the acceptability map and acceptability profiles will be more and more accurate and representative of global medicine market and worldwide patients. New recruitment centres initiation in different districts and countries, in cities or hospitals, will allow improving the model in term of diversity.
The result indicated that there was a statistically significant relationship between the acceptability assessments provided by the model based on objective data and the user perception regarding the medicine intake easiness. The relationship between the manipulation and administration time and the user perception regarding the medicine preparation tend to be significant. Recording the manipulation time and the administration time separately will allow to objectively measure the burden of manipulation in medicine use.
Thirty‐three per cent of the evaluations reported use of food or drink, and this behaviour could alter the pharmaceutical properties. Dedicated design to study prevalence of misuse depending on the acceptability could be of public health interest.
Previous data supported that there is no systematic difference between the first two administrations of a medicine,12 and then, for this protocol we focused only on the first medicine's administration following treatment delivery. Nonetheless, in the Web questionnaire a final section was proposed to the parents if they wanted to report additional remarks regarding the preparation and the intake of the medicine. Some parents declared spontaneously that it has been easy for the first administration before the children experienced the test, but very difficult for the second one. Longitudinal data collection will allow to study the impact of repeated administration on acceptability and to consider the acceptability over time.
As a first validation of the tool, this protocol did not include a parallel assessment performed by a professional health care; thus, interobserver reliability remains to be demonstrated. A protocol has been set up to explore this property, and longitudinal data will be used to confirm the ability of the tool to detect changes.
Acceptability is influenced by the characteristics of the medicines and the users. Linking acceptability of medicines to their characteristics and those of the patients will allow studying their impact on acceptability. We assume that it is possible to identify predictive factors of acceptability, which would thus allow designing a predictive model. This model will predict the expected acceptability of a medicine in a targeted population based on their characteristics. It could help medicines’ designers to study acceptability of new products from the early stages of paediatric formulation development.
Conclusion
This article presents an original tool assessing the acceptability of medicines whichever the products and patients characteristics. Our method is based on mapping and clustering processes. The first step is to build an acceptability map based on objective measures provided by real‐life data collection on medicines use. The second step is to group evaluations in clusters corresponding to distinct acceptability profiles. Any medicine may be positioned on the acceptability map and defined by an acceptability profile using the barycentre of their evaluations. This method provides standardized assessment tool of acceptability and allows comparison among medicines. This model will be constantly implemented with new data increasing the knowledge on acceptability of medicines over time. This tool should actively participate to the acceptability assessment standardization and contribute to the improvement of medicine's acceptability by the development of adequate drug formulation.
Declarations
Acknowledgements
The authors gratefully acknowledge the children's parent for their participation, the assistance of the pharmacists and the physicians for recruiting the volunteers and all staff members of ClinSearch, Laboratoire Conception de Produits et Innovation (LCPI) and Ecole de Biologie Industrielle (EBI) for their continuous support and involvement in the study.
References
- 1. European.Medicine.Agency.(EMA) . Guideline on pharmaceutical development of medicines for paediatric use. 2013.
- 2. Kozarewicz P. Regulatory perspectives on acceptability testing of dosage forms in children. Int J Pharm 2014; 2: 245–248. [DOI] [PubMed] [Google Scholar]
- 3. Liu F et al Patient‐centred pharmaceutical design to improve acceptability of medicines: similarities and differences in paediatric and geriatric populations. Drugs 2014; 16: 1871–1889. [DOI] [PMC free article] [PubMed] [Google Scholar]
- 4. Wang S. Formulations in paediatric investigation plans (PIPs): Introduction to PIP quality section and regulatory framework. Int J Pharm 2015; 1–2: 332–334. [DOI] [PubMed] [Google Scholar]
- 5. Mennella JA, Beauchamp GK. Optimizing oral medications for children. Clin Ther 2008; 11: 2120–2132. [DOI] [PMC free article] [PubMed] [Google Scholar]
- 6. Bartoshuk LM. Taste. Robust across the age span? Ann N Y Acad Sci 1989;561:65–75. [DOI] [PubMed] [Google Scholar]
- 7. Guinard JX. Sensory and consumer testing with children. Trends Food Sci Technol 2001;11:273–283. [Google Scholar]
- 8. European.Medicine.Agency.(EMA) . Reflection paper: formulations of choice for the paediatric population. 2006.
- 9. Uhari M et al Acceptance of antibiotic mixtures by infants and children. Eur J Clin Pharmacol 1986; 4: 503–504. [DOI] [PubMed] [Google Scholar]
- 10. Skwierczynski C, Conroy S. How long does it take to administer oral medicines to children? Paediatric Perinatal Drug Therapy 2008; 4: 145–149. [Google Scholar]
- 11. Klingmann V et al Favorable acceptance of mini‐tablets compared with syrup: a randomized controlled trial in infants and preschool children. J Pediatr 2013; 6: 1728–1732. [DOI] [PubMed] [Google Scholar]
- 12. Van Riet‐Nales DA et al Acceptability of different oral formulations in infants and preschool children. Arch Dis Child 2013; 9: 725–731. [DOI] [PMC free article] [PubMed] [Google Scholar]
- 13. Kluk A et al Can preschool‐aged children swallow several minitablets at a time? Results from a clinical pilot study. Int J Pharm 2015; 15: 00196–00199. [DOI] [PubMed] [Google Scholar]
- 14. Wollner A et al Acceptability, compliance and schedule of administration of oral antibiotics in outpatient children. Arch Pediatr 2011; 5: 611–616. [DOI] [PubMed] [Google Scholar]
- 15. Bryson SP. Patient‐centred, administration friendly medicines for children ‐ an evaluation of children's preferences and how they impact medication adherence. Int J Pharm 2014; 2: 257–259. [DOI] [PubMed] [Google Scholar]
- 16. Arbuckle R, Abetz‐Webb L. “Not just little adults”: qualitative methods to support the development of pediatric patient‐reported outcomes. Patient 2013; 3: 143–159. [DOI] [PubMed] [Google Scholar]
- 17. Matza LS et al Pediatric patient‐reported outcome instruments for research to support medical product labeling: report of the ISPOR PRO good research practices for the assessment of children and adolescents task force. Value Health 2013; 4: 461–479. [DOI] [PubMed] [Google Scholar]
- 18. Ministère.des.affaires.sociales.et.de.la.santé . Base de données publique des médicaments. http://base-donnees-publique.medicaments.gouv.fr/, 2016.
- 19. Husson F et al Principal component methods‐hierarchical clustering‐partitional clustering: why would we need to choose for visualizing data. Appl Math Department 2010. [Google Scholar]
- 20. Le S et al FactoMineR: an R package for multivariate analysis. J Stat Softw 2008; 1: 1–18. [Google Scholar]
- 21. Josse J, Husson F. missMDA a package to handle missing values in principal component methods. J Stat Softw 2015. [Google Scholar]
- 22. Tuleu C, Breitkreutz J. Educational paper: formulation‐related issues in pediatric clinical pharmacology. Eur J Pediatr 2013; 6: 717–720. [DOI] [PubMed] [Google Scholar]


