

Abstract
Tofacitinib is an oral Janus kinase inhibitor for the treatment of rheumatoid arthritis (RA). Here, the safety and efficacy data from five Phase 2 studies of tofacitinib in patients with RA are summarized. Tofacitinib 1–30 mg twice daily was investigated, as monotherapy and in combination with methotrexate, in patients with RA. Tofacitinib 20 mg once daily was investigated in one study. Tofacitinib 5 and 10 mg twice daily were selected for investigation in Phase 3 studies; therefore, the efficacy and safety of tofacitinib 5 and 10 mg twice daily in Phase 2 studies are the focus of this review. Tofacitinib ≥ 5 mg twice daily was efficacious in a dose‐dependent manner, with statistically significant and clinically meaningful reductions in the signs and symptoms of RA and patient‐reported outcomes. The safety profile was consistent across studies. The efficacy and safety profile of tofacitinib in Phase 2 studies supported its further investigation and the selection of tofacitinib 5 mg twice daily and tofacitinib 10 mg twice daily for evaluation in Phase 3 studies.
Keywords: efficacy, Phase 2, rheumatoid arthritis, safety, tofacitinib
Introduction
Rheumatoid arthritis (RA) is a chronic autoimmune disease with a significant impact on health‐related quality of life.1 The cornerstones of RA treatment are the disease‐modifying antirheumatic drugs (DMARDs), of which methotrexate (MTX) has become the first‐choice treatment.2 Patients with an initial good response to non‐biologic DMARD monotherapy continue to show improvements in signs and symptoms during the first 2 years; however, continued radiographic progression is often evident.3
Patients with an inadequate response to non‐biologic therapy can be treated successfully with biologic DMARDs, either as monotherapy or in combination with non‐biologic DMARDs.2, 4 However, biologic DMARDs cannot be used in all patients because of their adverse event (AE) profile. Additionally, many patients do not achieve remission by Disease Activity Score of 28 joints (DAS28) criteria5 and even fewer by American College of Rheumatology (ACR)/European League Against Rheumatism criteria.6 Moreover, sustainability of the biologic effect over time is an issue. Overall, these findings highlight the need for additional effective and tolerable therapies for the treatment of patients with RA.
Multiple cytokines are involved in the pathogenesis of RA7; many cytokine receptors rely on Janus kinases (JAKs) to mediate intracellular signaling.8 The recognition of JAKs as key components in the pathogenesis of RA has led to the clinical development of JAK inhibitors as potential DMARDs.9
Tofacitinib is an oral JAK inhibitor for the treatment of RA. Tofacitinib is a selective inhibitor of the JAK family (Fig. S1) that preferentially inhibits JAK3 and/or JAK1 over JAK210 and blocks intracellular signaling of multiple key cytokines involved in the immune response.
Here, we summarize the efficacy and safety data (using a consistent format) from five previously reported, randomized Phase 2 studies investigating tofacitinib administered as monotherapy or in combination with MTX in patients with active RA,11, 12, 13, 14, 15 focusing on the 5 and 10 mg twice‐daily doses that were selected for investigation in Phase 3 studies.
Methods
Overview of studies
These were randomized, double‐blind, placebo‐controlled, multicenter studies: A3921019 (NCT00147498), A3921025 (NCT00413660), A3921035 (NCT00550446), A3921039 (NCT00603512), and A3921040 (NCT00687193) (Table S1).
Studies A3921019 (6 weeks), A3921035 (24 weeks), and A3921040 (12 weeks; Japan) investigated tofacitinib monotherapy versus placebo in patients with active RA with a prior inadequate response to ≥ 1 DMARD (Table S1). Studies A3921025 (24 weeks) and A3921039 (12 weeks; Japan) investigated tofacitinib efficacy versus placebo in patients with RA despite background MTX (Table S1). Study A3921035 included a monotherapy adalimumab arm, and A3921025 included an exploratory tofacitinib 20 mg once daily arm (Table S1). In A3921025 and A3921035, patients assigned to tofacitinib 1 or 3 mg twice daily, tofacitinib 20 mg once daily, or placebo who failed to achieve ≥ 20% reduction in swollen/tender joint counts compared with baseline at Week 12 were labeled ‘non‐responders’ and reassigned to tofacitinib 5 mg twice daily.
The primary endpoint was the ACR20 response at Week 12 (Week 6 for A3921019). Patients who participated in these studies could participate in ongoing Phase 2/3 open‐label extension studies: A3921024 (ORAL Sequel; global studies) or A3921041 (Japanese patients).
The safety and efficacy data of tofacitinib 5 or 10 mg twice daily versus comparators in the five studies are presented. Data from the full analysis set were used unless otherwise stated and included all patients randomized who received ≥ 1 dose of the study drug. Statistical significance was declared when P ≤ 0.05, with no adjustment for multiple comparisons. It should be noted that owing to differing study designs and objectives of these Phase 2 studies, the approaches taken to their statistical analyses differed across studies. The approach reported here is an attempt to unify analyses where possible to make the results more comparable, for example, the method of ‘last observation carried forward’ is used here to account for missing data in analyses of binary endpoints. This overall approach using different imputation methods yields similar but not identical results from those previously reported.
Patient populations
Inclusion and exclusion criteria are detailed elsewhere.11, 12, 13, 14, 15 Briefly, patients were ≥ 18 years old (≥ 20 years in Japan) with a diagnosis of RA for ≥ 6 months by ACR 1987 revised criteria.6 Patients had ≥ 6 tender and ≥ 6 swollen joints and either an erythrocyte sedimentation rate (ESR) above the upper limit of normal (ULN) or C‐reactive protein (CRP) > 66.67 nmol/L (normal: ≤ 46.67 nmol/L); however, in A3921019, patients had ≥ 9 tender and ≥ 6 swollen joints and two out of three of: ESR of ≥ 28 mm/h, CRP ≥ 95.24 nmol/L, or morning stiffness ≥ 45 min. In the monotherapy studies, DMARDs were discontinued ≥ 4 weeks before randomization; stable MTX was required in A3921025 and A3921039. Patients were screened for tuberculosis (TB) using a Mantoux Purified Protein Derivative skin test or QuantiFERON‐TB Gold test, plus a chest radiograph; isoniazid therapy for latent TB was allowed.
Results
Patient disposition
Across studies, 1617 patients were randomized: 260 and 214 patients to tofacitinib 5 and 10 mg twice daily, respectively, were randomized and treated (Table S1). Completers ranged from 81.1% to 94.0% and discontinuations ranged from 5.7% to 18.4% (Table S2).
Patient demography and baseline disease characteristics
Treatment‐group baseline demographics and disease characteristics were similar across the five studies (Table 1). Most patients were female, with a mean age range of 50.6–53.4 years; mean duration of RA ranged from 7.6–9.6 years. Most patients were White (68.2–86.2%), except in A3921039 and A3921040, where all were Japanese. Patients had moderate to severe disease as evidenced by the mean DAS28‐4(ESR) (6.0–6.5). Twenty‐one countries, including the USA, Latin America, Europe, and Asia‐Pacific regions, contributed randomized patients to these studies.
Table 1.
Baseline demographics and characteristics
| A3921019 (N = 264) | A3921025 (N = 507) | A3921035 (N = 384) | A3921039 (N = 136) | A3921040 (N = 317) | |
|---|---|---|---|---|---|
| Geographic coverage by region | USA; Latin America; Europe | USA; Latin America; Europe | USA; Latin America; Europe; Asia‐Pacific excluding Japan | Japan | Japan |
| Female, n (%) | 226 (85.6) | 406 (80.1) | 333 (86.7) | 117 (86.0) | 264 (83.3) |
| Mean age, years | 50.6 | 53.2 | 53.4 | 51.3 | 53.4 |
| Race, % | |||||
| White | 68.2 | 86.2 | 76.6 | 0 | 0 |
| Black | 5.3 | 2.2 | 2.3 | 0 | 0 |
| Asian | 1.9 | 0.2 | 9.1 | 100 | 100 |
| Other | 24.6 | 11.4 | 12.0 | 0 | 0 |
| Mean time since diagnosis, years | 9.6 | 9.6 | 9.1 | 7.6 | 7.8 |
| Concomitant glucocorticoids, % | N/A | 58.2 | 55.7 | 59.6 | 68.8 |
| Rheumatoid factor positive, % | 90.2 | 80.3 | 79.9 | 85.3 | 83.9 |
| Mean tender joints, 68 count | 29.6 | 23.0 | 25.8 | 16.4 | 16.5 |
| Mean swollen joints, 66 count | 19.2 | 15.3 | 16.4 | 14.5 | 13.6 |
| Mean HAQ‐DI, 0–3 | 1.7 | 1.4 | 1.5 | 1.2 | 1.3 |
| Mean CRP, nmol/L | 254.3 | 156.2 | 195.2 | 216.2 | 269.5 |
| Mean DAS28‐4(ESR) | N/Aa | 6.2 | 6.5 | 6.0 | 6.1 |
| Mean DAS28‐3(CRP) | 5.9 | 5.3 | 5.5 | 5.0 | 5.1 |
CRP, C‐reactive protein; DAS, disease activity score; ESR, erythrocyte sedimentation rate; HAQ‐DI, Health Assessment Questionnaire‐Disability Index; N/A, not available.
ESR not collected.
Efficacy
ACR response rates
Across studies, tofacitinib 5 and 10 mg twice daily resulted in significantly greater (P ≤ 0.05) ACR20 response rates versus placebo at Week 12 (A3921019, Week 6) (Fig. 1). Significant ACR20 improvements for tofacitinib versus placebo (P ≤ 0.05) were seen as early as Weeks 1 and 2; efficacy was sustained to the end of active treatment (Figs S2–S6). Significantly higher ACR50 and ACR70 response rates versus placebo (P ≤ 0.05; Figs S2–S6) were seen with both tofacitinib doses and observed as early as Weeks 2 and 4 in some studies. ACR50 and ACR70 response rates were sustained to the end of study treatment in all studies.
Figure 1.
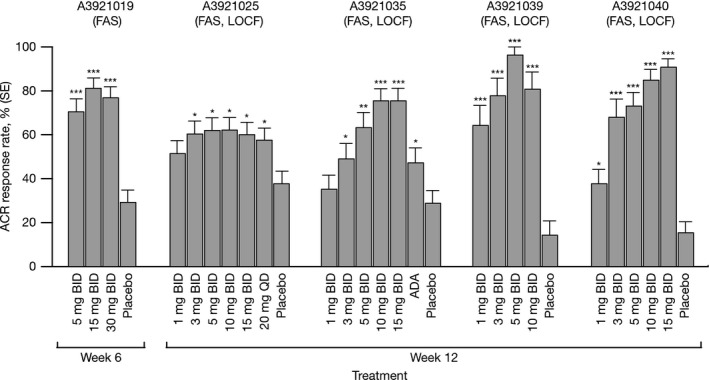
ACR20 response rates at Week 6 (A3921019) and Week 12 (A3921025, A3921035, A3921039, and A3921040). ACR, American College of Rheumatology; ADA, adalimumab; BID, twice daily; FAS, full analysis set; LOCF, last observation carried forward; QD, once daily; SE, standard error. *P ≤ 0.05; **P < 0.001; ***P < 0.0001 versus placebo.
DAS28 response
DAS28‐3(CRP) improvements were observed and sustained in both tofacitinib groups in all studies (Figs S7–S11). Dose‐dependent increases in the proportion of patients with DAS28‐3(CRP) < 2.6 were observed in both tofacitinib groups versus placebo, regardless of baseline score (Figs S7–S11). In A3921039 and A3921040, significantly higher proportions (P ≤ 0.05) of tofacitinib‐treated patients achieved DAS28‐4(ESR) < 2.6 at Week 12 compared with placebo (Figs S10, S11); in A3921035 only patients receiving ≥ 10 mg twice daily reached this endpoint in significantly higher proportions versus placebo (Fig. S9). These responses were maintained for tofacitinib ≥ 10 mg twice daily at Week 24; significantly higher proportions (P ≤ 0.05) were also observed for adalimumab versus placebo.
Patient‐reported outcomes
Patient‐reported outcomes (PROs) improved in all studies, with significant reductions (P ≤ 0.05) versus placebo observed in the Patient's Global Assessment of Arthritis (PtGA) by Week 2 for tofacitinib; these data paralleled those for the Physician's Global Assessment of Arthritis (PGA).
Mean Health Assessment Questionnaire‐Disability Index (HAQ‐DI) and pain (visual analog scale) scores improved over time in a dose‐dependent manner, with improvements in pain observed by Week 1 in both tofacitinib groups (Figs S12–S16). For HAQ‐DI, significantly more patients reported improvements greater than the minimal clinically important difference, −0.22,16 for both tofacitinib doses versus placebo by Week 2 in A3921025,13 A392103914, and A3921040,15 and by Week 2 for 10 mg twice daily in A3921035,11 although response for 5 mg twice daily was not consistent in A3921019 (data not shown).
There were statistically significant improvements from baseline in the physical component score of the Short Form‐36 Health Survey for both doses at Week 6 (A3921019) or 12 (A3921035, A3921039, A3921040 [Pfizer data on file]),11, 12, 14, 17 although neither dose achieved this at Week 12 for A3921025.13 Importantly, ACR responses, DAS improvement, and PRO responses were similar in the monotherapy and background MTX studies.
Safety
Adverse events
Tofacitinib had a consistent safety profile across all five studies (Table 2). The incidence of AEs ranged from 55.1–76.9% across the two groups. Headache (2.5–15.5%), nasopharyngitis (1.3–10.4%), and nausea (0.3–6.1%) were the most common AEs. The most common AEs leading to permanent discontinuation (protocol‐mandated or at the discretion of the investigator) were elevated alanine aminotransferase (ALT) (0–2.9%) and elevated aspartate aminotransferase (AST) (0–2.9%), although in A392101912 there were no such discontinuations (leukopenia was the most common AE leading to permanent discontinuation for A3921019). One malignancy (basal‐cell carcinoma, A3921025) was reported for tofacitinib 5 mg twice daily; none were reported for 10 mg twice daily. There were two malignancies in other treatment arms: basal‐cell carcinoma (A3921025, tofacitinib 3 mg twice daily) and renal‐cell carcinoma (A3921035, adalimumab).
Table 2.
Safety summary
| Study | Treatment | AEs, n (%) | Serious AEs,a n (%) | Severe AEs,b n (%) | Infections and infestation, n (%) | Serious infection, n (%) | Discontinuation due to AEs, n (%) | Death, n (%) |
|---|---|---|---|---|---|---|---|---|
| A3921019 (mono) | Placebo (n = 65) | 38 (58.5) | 1 (1.5) | 2 (3.1) | 17 (26.2) | 1 (1.5) | 4 (6.2) | 0 |
| 5 mg BID (n = 61) | 36 (59.0) | 1 (1.6) | 3 (4.9) | 15 (24.6) | 0 | 1 (1.6) | 0 | |
| 15 mg BID (n = 69) | 52 (75.4) | 5 (7.2) | 6 (8.7) | 21 (30.4) | 1 (1.5) | 6 (8.7) | 0 | |
| 30 mg BID (n = 69) | 53 (76.8) | 3 (4.3) | 2 (2.9) | 21 (30.4) | 2 (2.9) | 10 (14.5) | 0 | |
| A3921025 (+ MTX) | Placebo (n = 51) | 29 (56.9) | 0 | 0 | 12 (23.5) | 0 | 3 (5.9) | 0 |
| Placebo (r) (n = 18) | 12 (66.7) | 0 | 0 | 5 (27.8) | 0 | 0 | 0 | |
| 1 mg BID (n = 49) | 29 (59.2) | 1 (2.0) | 1 (2.0) | 10 (20.4) | 0 | 3 (6.1) | 0 | |
| 1 mg BID (r) (n = 21) | 14 (66.7) | 1 (4.8) | 2 (9.5) | 9 (42.9) | 0 | 0 | 0 | |
| 3 mg BID (n = 55) | 38 (69.1) | 4 (7.3) | 2 (3.6) | 17 (30.9) | 2 (3.6) | 2 (3.6) | 1 (1.8) | |
| 3 mg BID (r) (n = 13) | 10 (76.9) | 0 | 0 | 8 (61.5) | 0 | 0 | 0 | |
| 5 mg BID (n = 71) | 47 (66.2) | 4 (5.6) | 4 (5.6) | 27 (38.0) | 1 (1.4) | 3 (4.2) | 0 | |
| 10 mg BID (n = 74) | 50 (67.6) | 1 (1.4) | 7 (9.5) | 26 (35.1) | 1 (1.4) | 5 (6.8) | 0 | |
| 15 mg BID (n = 75) | 57 (76.0) | 6 (8.0) | 6 (8.0) | 28 (37.3) | 0 | 10 (13.3) | 0 | |
| 20 mg QD (n = 67) | 41 (61.2) | 4 (6.0) | 2 (3.0) | 24 (35.8) | 1 (1.5) | 6 (9.0) | 0 | |
| 20 mg QD (r) (n = 13) | 6 (46.2) | 0 | 0 | 6 (46.2) | 0 | 0 | 0 | |
| A3921035 (mono) | Placebo (n = 34) | 16 (47.1) | 2 (5.9) | 2 (5.9) | 6 (17.6) | 1 (2.9) | 1 (2.9) | 0 |
| Placebo (r) (n = 25) | 13 (52.0) | 0 | 0 | 6 (24.0) | 0 | 0 | 0 | |
| 1 mg BID (n = 37) | 19 (51.4) | 2 (5.4) | 1 (2.7) | 11 (29.7) | 2 (5.4) | 4 (10.8) | 0 | |
| 1 mg BID (r) (n = 17) | 5 (29.4) | 0 | 0 | 2 (11.8) | 0 | 0 | 0 | |
| 3 mg BID (n = 34) | 18 (52.9) | 1 (2.9) | 2 (5.9) | 7 (20.6) | 0 | 3 (8.8) | 0 | |
| 3 mg BID (r) (n = 17) | 6 (35.3) | 0 | 0 | 3 (17.6) | 0 | 0 | 0 | |
| 5 mg BID (n = 49) | 27 (55.1) | 0 | 1 (2.0) | 17 (34.7) | 0 | 1 (2.0) | 0 | |
| 10 mg BID (n = 61) | 36 (59.0) | 1 (1.6) | 0 | 21 (34.4) | 0 | 1 (1.6) | 0 | |
| 15 mg BID (n = 57) | 35 (61.4) | 4 (7.0) | 5 (8.8) | 19 (33.3) | 1 (1.8) | 3 (5.3) | 1 (1.8) | |
| ADA QOW Baseline–Week 12 (n = 53) | 27 (50.9) | 1 (1.9) | 0 | 10 (18.9) | 0 | 4 (7.5) | 0 | |
| ADA QOW/tofacitinib 5 mg BID (r) Week 12–Week 24 (n = 44) | 28 (63.6) | 4 (9.1) | 0 | 11 (25.0) | 1 (2.3) | 3 (6.8) | 0 | |
| A3921039 (+ MTX) | Placebo (n = 28) | 11 (39.3) | 0 | 0 | 6 (21.4) | 0 | 2 (7.1) | 0 |
| 1 mg BID (n = 28) | 15 (53.6) | 1 (3.6) | 1 (3.6) | 3 (10.7) | 0 | 0 | 0 | |
| 3 mg BID (n = 27) | 16 (59.3) | 1 (3.7) | 1 (3.7) | 8 (29.6) | 0 | 2 (7.4) | 0 | |
| 5 mg BID (n = 27) | 19 (70.4) | 1 (3.7) | 1 (3.7) | 3 (11.1) | 0 | 4 (14.8) | 0 | |
| 10 mg BID (n = 26) | 20 (76.9) | 2 (7.7) | 1 (3.8) | 11 (42.3) | 0 | 4 (15.4) | 0 | |
| A3921040 (mono) | Placebo (n = 52) | 23 (44.2) | 1 (1.9) | 0 | 8 (15.4) | 0 | 2 (3.8) | 0 |
| 1 mg BID (n = 53) | 21 (39.6) | 0 | 0 | 7 (13.2) | 0 | 0 | 0 | |
| 3 mg BID (n = 53) | 23 (43.4) | 3 (5.7) | 2 (3.8) | 5 (9.4) | 0 | 1 (1.9) | 0 | |
| 5 mg BID (n = 52) | 29 (55.8) | 2 (3.8) | 1 (1.9) | 11 (21.2) | 1 (1.9) | 2 (3.8) | 0 | |
| 10 mg BID (n = 53) | 32 (60.4) | 2 (3.8) | 1 (1.9) | 16 (30.2) | 1 (1.9) | 3 (5.7) | 0 | |
| 15 mg BID (n = 54) | 28 (51.9) | 1 (1.9) | 0 | 11 (20.4) | 1 (1.9) | 0 | 0 |
(r), reassigned to tofacitinib 5 mg BID at Week 12; ADA, adalimumab; AE, adverse event; BID, twice daily; mono, monotherapy; + MTX, plus methotrexate; QD, once daily; QOW, every other week.
Serious AEs were defined as any AE that: resulted in death; was life‐threatening; required in‐patient hospitalization or prolongation of existing hospitalization; resulted in a persistent or significant disability/incapacity; or resulted in congenital anomaly/birth defect. Other important medical events were considered serious AEs if they jeopardized the patient or required medical or surgical intervention to prevent one of the outcomes listed in this definition.
Classes of AE severity were determined by the investigator to be mild, moderate or severe. Severe AEs were those AEs classed by the investigator as ‘severe’.
Serious infection events
Serious infection events occurred at a rate of 0–5.4% for all arms across all studies. Seventeen serious infections were reported: pneumonia (organism unspecified, n = 5; Staphylococcus aureus pneumonia, n = 1); herpes zoster (n = 3, including one case of Ramsay‐Hunt syndrome); pyelonephritis (n = 2); pneumococcal sepsis, ankle‐joint infection, respiratory‐tract infection, urinary‐tract infection, infectious gastroenteritis, and exacerbation of Whipple's disease (all n = 1).
Deaths
No deaths were reported for tofacitinib 5 or 10 mg twice daily. Three deaths were reported in other arms: A3921025, n = 2 (subarachnoid bleeding in a 56‐year‐old man prior to randomization; bilateral pneumonia followed by respiratory failure and heart failure in a 40‐year‐old woman, 3 mg twice daily); A3921035, n = 1 (cerebrovascular accident [stroke] in a 68‐year‐old woman, 15 mg twice daily).
Clinical laboratory parameters
Mean changes from baseline in laboratory parameters were similar across studies (Table S3). Hemoglobin mean change from baseline at Week 12 ranged from −0.2 to 4.9 g/L for 5 mg twice daily and from −3.4 to 6.1 g/L for 10 mg twice daily. Incidence of severe anemia (hemoglobin change from baseline −19.9 to −29.9 g/L)18 ranged from 0 to 3.7% and 0 to 4.8% in the 5 and 10 mg twice‐daily groups, respectively; the earliest observed onset of severe anemia was at Week 2. One patient receiving 3 mg twice daily temporarily discontinued due to severe anemia. Small mean increases from baseline in serum creatinine levels (up to 5.30 μmol/L) were observed for tofacitinib on last assessment. In A3921025, A3921035, and A3921040, three (5 mg twice daily) and six (10 mg twice daily) patients had a > 50% increase from baseline in serum creatinine. Data for elevations > 50% were not available for A3921019 and A3921039: in A3921019, 12 patients (5 mg twice daily) had elevations > 20%; in A3921039, among patients with at least a 17.68 μmol/L elevation, one patient (10 mg twice daily) had an elevation > 10%. Dose‐related increases in total cholesterol (TC), high‐density lipoprotein (HDL), and low‐density lipoprotein (LDL) were observed for both doses with modest and variable changes in LDL : HDL ratios. Mean percent changes from baseline at Week 12 ranged from 13.8–18.8% for LDL, 12.5–32.7% for HDL, and 12.9–21.4% for TC for 5 mg twice daily; and 17.4–24.2% (LDL), 3.5–38.0% (HDL), and 12.2–28.2% (TC) for 10 mg twice daily, with elevations seen as early as Week 6.
Dose‐dependent decreases in mean neutrophil counts (maximum mean change from baseline: 2.25 × 10⁹ cells/L; 10 mg twice daily, Week 12) were observed in all studies for both doses; changes occurred quickly and were reversible after drug discontinuation. The decreases were stable after 1 month. Moderate to severe neutropenia (0.5–1.5 × 10⁹ cells/L) was reported at Week 8 and Week 12 in one patient each — both receiving 5 mg twice daily and in A3921019 — and was not reported in any patient receiving 10 mg twice daily. Life‐threatening neutropenia (< 0.5 × 10⁹ cells/L)18 was not observed.
In the 5 mg twice‐daily group, 32/260 (12%) and 32/260 (12%) patients experienced ALT and AST elevations > 1 × ULN, respectively. In the 10 mg twice‐daily group, 37/214 (17%) and 35/214 (16%) patients experienced ALT and AST elevations, respectively, > 1 × ULN. Across the studies for the placebo, 5 mg and 10 mg twice‐daily groups, transaminase elevations > 3 × ULN were observed in eight (ALT) and four (AST) patients. All abnormal laboratory events of clinical significance were followed until levels returned to normal or baseline values.
Discussion
These five studies represent the largest Phase 2 program conducted to date for an immunomodulatory DMARD therapy in patients with active RA: 1282 patients were treated with tofacitinib, representing 422 patient‐years of exposure (113 years of 5 mg twice daily and 76 years of 10 mg twice daily) in Phase 2 randomized controlled studies. Studies were conducted in a broad geographic range of countries and adequately supported a number of analyses, including dose selection for Phase 3 studies using pharmacologically based dose‐response models.19 Tofacitinib efficacy was established with significant differences in ACR20 observed for tofacitinib 5 and 10 mg twice daily versus placebo. Both doses of tofacitinib were effective as monotherapy or in combination with MTX.
Tofacitinib was associated with consistently significant and clinically meaningful reductions in the signs and symptoms of RA and improvements in physical function and PROs across studies, whether administered as monotherapy or on background MTX. Significant and clinically meaningful dose‐related improvements in clinical endpoints were seen in both 5 and 10 mg twice‐daily groups versus placebo. Evidence of efficacy was identified as early as Week 1 or 2 and sustained to treatment end. Improvements were observed in secondary endpoints, including ACR50 and ACR70 response rates, PGA, PtGA, HAQ‐DI and pain scores, changes from baseline in DAS28‐3(CRP), and achievement of DAS‐defined remission.
A consistent safety profile was reported in all Phase 2 studies: most AEs were mild and there were few discontinuations due to AEs. Most AEs were treatable and resolved spontaneously or following drug discontinuation; the incidence of serious AEs was low. Across all tofacitinib doses, higher discontinuation rates were reported in A3921019 and A3921039 than in the other studies. A3921019 contained higher tofacitinib doses, and most patients who permanently discontinued were receiving either tofacitinib 15 or 30 mg twice daily. It is unclear why there was an increase in discontinuations in the Japanese A3921039 study. There were increased proportions of patients with transaminase elevations for those on combination therapies in the Japanese studies. It is possible that Japanese populations might be more sensitive to transaminase elevations and the hepatic effect of MTX.20 The pharmacokinetic profiles were similar in Japanese and non‐Japanese patients (Pfizer data on file). Overall, the safety profile was similar for patients receiving tofacitinib as monotherapy or in combination with MTX.
The safety of biologic therapies in RA remains an area of scrutiny, particularly with regard to serious infections, opportunistic infections, lymphomas, malignancies, and immunogenic events.21, 22 The incidence of serious infections and malignancies in the tofacitinib Phase 2 studies was low and did not show a clear dose‐dependent pattern; the incidence was in the same range as that reported with biologic DMARDs.21, 23, 24, 25, 26 Collectively, the Phase 2 studies indicate that the rate of infections increased at the highest doses tested; too few serious infections were observed to assess dose response. Phase 2 studies are typically too short in duration to assess the incidences of malignancies. Immunogenic events, such as hypersensitivity reactions, were not observed in tofacitinib studies.
The incidence of abnormal laboratory values was similar across the studies; however, there was a slightly lower incidence of neutropenias, anemias, and increased transaminases in the monotherapy studies. Change from baseline in cholesterol levels was largely similar across the studies.
Current guidelines for the treatment of RA highlight the need for a flexible approach to treatment, including the opportunity to switch treatments if response is inadequate or therapy is poorly tolerated, and to provide combination therapy for patients with unfavorable prognostic features.2, 27 The tofacitinib Phase 2 program has provided preliminary evidence of its utility both as monotherapy and in combination with MTX. Overall Phase 2 data indicated that doses ≥ 5 mg twice daily consistently provided clinically meaningful efficacy versus placebo, while the 15 and 30 mg twice‐daily doses did not provide substantial improvements compared with 10 mg twice daily. Model‐based methods were applied to characterize the dose‐response profile with improved precision to inform further the selection of 5 and 10 mg twice‐daily doses for Phase 3 studies.19 Based on the results from these Phase 2 studies, tofacitinib has now completed six Phase 3 studies for the treatment of patients with active RA.28, 29, 30, 31, 32, 33 Moreover, tofacitinib dosed at 5 or 10 mg twice daily in patients with RA has demonstrated a consistent safety profile and sustained efficacy throughout 72 months in open‐label long‐term extension studies.
In summary, in five Phase 2 studies, tofacitinib, an oral JAK inhibitor, demonstrated a consistent safety profile, statistically significant and clinically meaningful reductions in the signs and symptoms of RA, and improvements in physical function and PROs. Efficacy with 5 and 10 mg twice daily was achieved rapidly and sustained for periods of up to 24 weeks. The safety profile was considered manageable and confirmed in Phase 3 and open‐label long‐term extension studies.
Author contributions
DG, KK, TK, SK, GW, BW, and SHZ were involved in the conception and design of the study/analyses. DG and SK performed the data and statistical analyses. RF, JK, YT, and EK were involved in data acquisition. All authors were involved in data interpretation and manuscript drafting, reviewing, and development.
Supporting information
Figure S1 Overview of cytokine signaling through the JAK‐STAT pathway. JAK, Janus kinase; P, phosphate group; STAT, signal transducer and activator of transcription. Reprinted by permission from Macmillan Publishers Ltd: Nature Reviews Immunology; 3: 900–911, copyright 2003.
Figure S2 Study A3921019 a: ACR20, b: ACR50, and c: ACR70 response rates over time. ACR, American College of Rheumatology; BID, twice daily; FAS, full analysis set; LOCF, last observation carried forward. *P ≤ 0.05; **P < 0.001; ***P < 0.0001 versus placebo.
Figure S3 Study A3921025 a: ACR20, b: ACR50, and c: ACR70 response rates over time. ACR, American College of Rheumatology; BID, twice daily; FAS, full analysis set; LOCF, last observation carried forward; QD, once daily. Owing to reassignment, P values were not added to data post‐Week 12. *P ≤ 0.05; **P < 0.001; ***P < 0.0001 versus placebo.
Figure S4 Study A3921035 a: ACR20, b: ACR50, and c: ACR70 response rates over time. ACR, American College of Rheumatology; BID, twice daily; FAS, full analysis set; LOCF, last observation carried forward. Owing to reassignment, P values were not added to data post week 12. *P ≤ 0.05; **P < 0.001; ***P < 0.0001 versus placebo.
Figure S5 Study A3921039 a: ACR20, b: ACR50, and c: ACR70 response rates over time. ACR, American College of Rheumatology; BID, twice daily; FAS, full analysis set; LOCF, last observation carried forward. *P ≤ 0.05; **P < 0.001; ***P < 0.0001 versus placebo.
Figure S6 Study A3921040 a: ACR20, b: ACR50, and c: ACR70 response rates over time. ACR, American College of Rheumatology; BID, twice daily; FAS, full analysis set; LOCF, last observation carried forward. *P ≤ 0.05; **P < 0.001; ***P < 0.0001 versus placebo.
Figure S7 Study A3921019 a: mean change from baseline in DAS28‐3(CRP) and b: time course of DAS28‐3(CRP)< 2.6. BID, twice daily; CRP, C‐reactive protein; DAS, disease activity score; FAS, full analysis set. *P ≤ 0.05; **P < 0.001; ***P < 0.0001 versus placebo.
Figure S8 Study A3921025 a: mean change from baseline in DAS28‐3(CRP) and b: time course of DAS28‐3(CRP)< 2.6. BID, twice daily; CRP, C‐reactive protein; DAS, disease activity score; FAS, full analysis set; QD, once daily. *P ≤ 0.05; **P < 0.001; ***P < 0.0001 versus placebo.
Figure S9 Study A3921035 a: mean change from baseline in DAS28‐3(CRP), b: time course of DAS28‐3(CRP)< 2.6, and c: DAS28‐4(ESR)< 2.6 rates (patients not in remission at baseline). BID, twice daily; CRP, C‐reactive protein; DAS, disease activity score; ESR, erythrocyte sedimentation rate; FAS, full analysis set. *P ≤ 0.05; **P < 0.001; ***P < 0.0001 versus placebo.
Figure S10 Study A3921039 a: mean change from baseline in DAS28‐3(CRP), b: time course of DAS28‐3(CRP)< 2.6, and c: DAS28‐4(ESR)< 2.6 rates (patients not in remission at baseline). BID, twice daily; CRP, C‐reactive protein; DAS, disease activity score; ESR, erythrocyte sedimentation rate; FAS, full analysis set. *P ≤ 0.05; **P < 0.001; ***P < 0.0001 versus placebo.
Figure S11 Study A3921040 a: mean change from baseline in DAS28‐3(CRP), b: time course of DAS28‐3(CRP)< 2.6, and c: DAS28‐4(ESR)< 2.6 rates (patients not in remission at baseline). BID, twice daily; CRP, C‐reactive protein; DAS, disease activity score; ESR, erythrocyte sedimentation rate; FAS, full analysis set. *P ≤ 0.05; **P < 0.001; ***P < 0.0001 versus placebo.
Figure S12 Study A3921019 a: mean HAQ‐DI and b: pain (VAS) over time. BID, twice daily; FAS, full analysis set; HAQ‐DI, Health Assessment Questionnaire‐Disability Index; VAS, visual analog scale.
Figure S13 Study A3921025 a: mean HAQ‐DI and b: pain (VAS) over time. (r), reassigned; BID, twice daily; FAS, full analysis set; HAQ‐DI, Health Assessment Questionnaire‐Disability Index; QD, once daily; VAS, visual analog scale.
Figure S14 Study A3921035 a: mean HAQ‐DI and b: pain (VAS) over time. (r), reassigned; BID, twice daily; FAS, full analysis set; HAQ‐DI, Health Assessment Questionnaire‐Disability Index; VAS, visual analog scale.
Figure S15 Study A3921039 a: mean HAQ‐DI and b: pain (VAS) over time. BID, twice daily; FAS, full analysis set; HAQ‐DI, Health Assessment Questionnaire‐Disability Index; VAS, visual analog scale.
Figure S16 Study A3921040 a: mean HAQ‐DI and b: pain (VAS) over time. BID, twice daily; FAS, full analysis set; HAQ‐DI, Health Assessment Questionnaire‐Disability Index; VAS, visual analog scale.
Table S1 Study design
Table S2 Patient disposition
Table S3 Change from baseline in laboratory values (FAS, no imputation)†
Acknowledgements
These studies were funded by Pfizer Inc. Editorial support was provided by Karen Irving and Anne Marie Reid, PhD, of Complete Medical Communications, and was funded by Pfizer Inc. David Gruben, Keith Kanik, Tamas Koncz, Sriram Krishnaswami, Gene Wallenstein, Bethanie Wilkinson, and Samuel H. Zwillich are employees of Pfizer Inc. Joel Kremer, Yoshiya Tanaka, and Edward Keystone have received consultancy fees or honoraria, and research grants, from Pfizer Inc. Roy Fleischmann has received consultancy fees or honoraria, research grants, and payment for lectures, including service on speakers bureaus, from Pfizer Inc.
References
- 1. Strand V, Khanna D (2010) The impact of rheumatoid arthritis and treatment on patients’ lives. Clin Exp Rheumatol 28, S32–40. [PubMed] [Google Scholar]
- 2. Smolen JS, Landewé R, Breedveld FC et al (2010) EULAR recommendations for the management of rheumatoid arthritis with synthetic and biological disease‐modifying antirheumatic drugs. Ann Rheum Dis 69, 964–75. [DOI] [PMC free article] [PubMed] [Google Scholar]
- 3. Rezaei H, Saevarsdottir S, Forslind K et al (2012) In early rheumatoid arthritis, patients with a good initial response to methotrexate have excellent 2‐year clinical outcomes, but radiological progression is not fully prevented: data from the methotrexate responders population in the SWEFOT trial. Ann Rheum Dis 71, 186–91. [DOI] [PubMed] [Google Scholar]
- 4. Singh JA, Furst DE, Bharat A et al (2012) 2012 update of the 2008 American College of Rheumatology recommendations for the use of disease‐modifying antirheumatic drugs and biologic agents in the treatment of rheumatoid arthritis. Arthritis Care Res (Hoboken) 64, 625–39. [DOI] [PMC free article] [PubMed] [Google Scholar]
- 5. Barton JL (2009) Patient preferences and satisfaction in the treatment of rheumatoid arthritis with biologic therapy. Patient Prefer Adherence 3, 335–44. [DOI] [PMC free article] [PubMed] [Google Scholar]
- 6. Felson DT, Smolen JS, Wells G et al (2011) American College of Rheumatology/European League Against Rheumatism provisional definition of remission in rheumatoid arthritis for clinical trials. Arthritis Rheum 63, 573–86. [DOI] [PMC free article] [PubMed] [Google Scholar]
- 7. McInnes I, Schett G (2011) The pathogenesis of rheumatoid arthritis. N Engl J Med 365, 2205–19. [DOI] [PubMed] [Google Scholar]
- 8. Ghoreschi K, Laurence A, O'Shea JJ (2009) Janus kinases in immune cell signaling. Immunol Rev 228, 273–87. [DOI] [PMC free article] [PubMed] [Google Scholar]
- 9. Fleischmann R (2012) Novel small‐molecular therapeutics for rheumatoid arthritis. Curr Opin Rheumatol 24, 335–41. [DOI] [PubMed] [Google Scholar]
- 10. Meyer DM, Jesson MI, Li X et al (2010) Anti‐inflammatory activity and neutrophil reductions mediated by the JAK1/JAK3 inhibitor, CP‐690,550, in rat adjuvant‐induced arthritis. J Inflamm (Lond) 7, 41. [DOI] [PMC free article] [PubMed] [Google Scholar]
- 11. Fleischmann R, Cutolo M, Genovese MC et al (2012) Phase IIb dose‐ranging study of the oral JAK inhibitor tofacitinib (CP‐690,550) or adalimumab monotherapy versus placebo in patients with active rheumatoid arthritis with an inadequate response to disease‐modifying antirheumatic drugs. Arthritis Rheum 64, 617–29. [DOI] [PubMed] [Google Scholar]
- 12. Kremer JM, Bloom BJ, Breedveld FC et al (2009) The safety and efficacy of a JAK inhibitor in patients with active rheumatoid arthritis: results of a double‐blind, placebo‐controlled phase IIa trial of three dosage levels of CP‐690,550 versus placebo. Arthritis Rheum 60, 1895–905. [DOI] [PubMed] [Google Scholar]
- 13. Kremer JM, Cohen S, Wilkinson BE et al (2012) A phase IIb dose‐ranging study of the oral JAK inhibitor tofacitinib (CP‐690,550) versus placebo in combination with background methotrexate in patients with active rheumatoid arthritis and an inadequate response to methotrexate alone. Arthritis Rheum 64, 970–81. [DOI] [PubMed] [Google Scholar]
- 14. Tanaka Y, Suzuki M, Nakamura H, Toyoizumi S, Zwillich SH (2011) Phase II study of tofacitinib (CP‐690,550) combined with methotrexate in patients with rheumatoid arthritis and an inadequate response to methotrexate. Arthritis Care Res (Hoboken) 63, 1150–8. [DOI] [PubMed] [Google Scholar]
- 15. Tanaka Y, Takeuchi T, Yamanaka H, Nakamura H, Toyoizumi S, Zwillich S (2015) Efficacy and safety of tofacitinib as monotherapy in Japanese patients with active rheumatoid arthritis: a 12‐week, randomized, Phase 2 study. Mod Rheumatol 25, 514–21. [DOI] [PMC free article] [PubMed] [Google Scholar]
- 16. Strand V, Scott DL, Emery P et al (2005) Physical function and health related quality of life: analysis of 2‐year data from randomized, controlled studies of leflunomide, sulfasalazine, or methotrexate in patients with active rheumatoid arthritis. J Rheumatol 32, 590–601. [PubMed] [Google Scholar]
- 17. Coombs JH, Bloom BJ, Breedveld FC et al (2010) Improved pain, physical functioning and health status in patients with rheumatoid arthritis treated with CP‐690,550, an orally active Janus kinase (JAK) inhibitor: results from a randomised, double‐blind, placebo‐controlled trial. Ann Rheum Dis 69, 413–6. [DOI] [PubMed] [Google Scholar]
- 18. Woodworth T, Furst DE, Alten R et al (2007) Standardizing assessment and reporting of adverse effects in rheumatology clinical trials II: the Rheumatology Common Toxicity Criteria v. 2.0. J Rheumatol 34, 1401–14. [PubMed] [Google Scholar]
- 19. Tan H, Gruben D, French J, Thomas N (2011) A case study of model‐based Bayesian dose response estimation. Stat Med 30, 2622–33. [DOI] [PubMed] [Google Scholar]
- 20. Meyer UA, Zanger UM (1997) Molecular mechanisms of genetic polymorphisms of drug metabolism. Annu Rev Pharmacol Toxicol 37, 269–96. [DOI] [PubMed] [Google Scholar]
- 21. Bongartz T, Sutton AJ, Sweeting MJ, Buchan I, Matteson EL, Montori V (2006) Anti‐TNF antibody therapy in rheumatoid arthritis and the risk of serious infections and malignancies: systematic review and meta‐analysis of rare harmful effects in randomized controlled trials. JAMA 295, 2275–85. [DOI] [PubMed] [Google Scholar]
- 22. Salliot C, Dougados M, Gossec L (2009) Risk of serious infections during rituximab, abatacept and anakinra treatments for rheumatoid arthritis: meta‐analyses of randomised placebo‐controlled trials. Ann Rheum Dis 68, 25–32. [DOI] [PMC free article] [PubMed] [Google Scholar]
- 23. Curtis JR, Patkar N, Xie A et al (2007) Risk of serious bacterial infections among rheumatoid arthritis patients exposed to tumor necrosis factor alpha antagonists. Arthritis Rheum 56, 1125–33. [DOI] [PubMed] [Google Scholar]
- 24. Dixon WG, Watson K, Lunt M, Hyrich KL, Silman AJ, Symmons DP (2006) Rates of serious infection, including site‐specific and bacterial intracellular infection, in rheumatoid arthritis patients receiving anti‐tumor necrosis factor therapy: results from the British Society for Rheumatology Biologics Register. Arthritis Rheum 54, 2368–76. [DOI] [PubMed] [Google Scholar]
- 25. Kievit W, Fransen J, Adang EM et al (2011) Long‐term effectiveness and safety of TNF‐blocking agents in daily clinical practice: results from the Dutch Rheumatoid Arthritis Monitoring register. Rheumatology (Oxford) 50, 196–203. [DOI] [PubMed] [Google Scholar]
- 26. Thompson AE, Rieder SW, Pope JE (2011) Tumor necrosis factor therapy and the risk of serious infection and malignancy in patients with early rheumatoid arthritis: a meta‐analysis of randomized controlled trials. Arthritis Rheum 63, 1479–85. [DOI] [PubMed] [Google Scholar]
- 27. Saag KG, Teng GG, Patkar NM et al (2008) American College of Rheumatology 2008 recommendations for the use of nonbiologic and biologic disease‐modifying antirheumatic drugs in rheumatoid arthritis. Arthritis Rheum 59, 762–84. [DOI] [PubMed] [Google Scholar]
- 28. Burmester GR, Blanco R, Charles‐Schoeman C et al (2013) Tofacitinib (CP‐690,550) in combination with methotrexate in patients with active rheumatoid arthritis with an inadequate response to tumour necrosis factor inhibitors: a randomised phase 3 trial. Lancet 381, 451–60. [DOI] [PubMed] [Google Scholar]
- 29. Fleischmann R, Kremer J, Cush J et al (2012) Placebo‐controlled trial of tofacitinib monotherapy in rheumatoid arthritis. N Engl J Med 367, 495–507. [DOI] [PubMed] [Google Scholar]
- 30. van der Heijde D, Tanaka Y, Fleischmann R et al (2013) Tofacitinib (CP‐690,550) in patients with rheumatoid arthritis receiving methotrexate: twelve‐month data from a twenty‐four‐month phase III randomized radiographic study. Arthritis Rheum 65, 559–70. [DOI] [PubMed] [Google Scholar]
- 31. van Vollenhoven RF, Fleischmann R, Cohen S et al (2012) Tofacitinib or adalimumab versus placebo in rheumatoid arthritis. N Engl J Med 367, 508–19. [DOI] [PubMed] [Google Scholar]
- 32. Kremer J, Li ZG, Hall S et al (2013) Tofacitinib in combination with nonbiologic disease‐modifying antirheumatic drugs in patients with active rheumatoid arthritis: a randomized trial. Ann Intern Med 159, 253–61. [DOI] [PubMed] [Google Scholar]
- 33. Lee EB, Fleischmann R, Hall S et al (2014) Tofacitinib versus methotrexate in rheumatoid arthritis. N Engl J Med 370, 2377–86. [DOI] [PubMed] [Google Scholar]
Associated Data
This section collects any data citations, data availability statements, or supplementary materials included in this article.
Supplementary Materials
Figure S1 Overview of cytokine signaling through the JAK‐STAT pathway. JAK, Janus kinase; P, phosphate group; STAT, signal transducer and activator of transcription. Reprinted by permission from Macmillan Publishers Ltd: Nature Reviews Immunology; 3: 900–911, copyright 2003.
Figure S2 Study A3921019 a: ACR20, b: ACR50, and c: ACR70 response rates over time. ACR, American College of Rheumatology; BID, twice daily; FAS, full analysis set; LOCF, last observation carried forward. *P ≤ 0.05; **P < 0.001; ***P < 0.0001 versus placebo.
Figure S3 Study A3921025 a: ACR20, b: ACR50, and c: ACR70 response rates over time. ACR, American College of Rheumatology; BID, twice daily; FAS, full analysis set; LOCF, last observation carried forward; QD, once daily. Owing to reassignment, P values were not added to data post‐Week 12. *P ≤ 0.05; **P < 0.001; ***P < 0.0001 versus placebo.
Figure S4 Study A3921035 a: ACR20, b: ACR50, and c: ACR70 response rates over time. ACR, American College of Rheumatology; BID, twice daily; FAS, full analysis set; LOCF, last observation carried forward. Owing to reassignment, P values were not added to data post week 12. *P ≤ 0.05; **P < 0.001; ***P < 0.0001 versus placebo.
Figure S5 Study A3921039 a: ACR20, b: ACR50, and c: ACR70 response rates over time. ACR, American College of Rheumatology; BID, twice daily; FAS, full analysis set; LOCF, last observation carried forward. *P ≤ 0.05; **P < 0.001; ***P < 0.0001 versus placebo.
Figure S6 Study A3921040 a: ACR20, b: ACR50, and c: ACR70 response rates over time. ACR, American College of Rheumatology; BID, twice daily; FAS, full analysis set; LOCF, last observation carried forward. *P ≤ 0.05; **P < 0.001; ***P < 0.0001 versus placebo.
Figure S7 Study A3921019 a: mean change from baseline in DAS28‐3(CRP) and b: time course of DAS28‐3(CRP)< 2.6. BID, twice daily; CRP, C‐reactive protein; DAS, disease activity score; FAS, full analysis set. *P ≤ 0.05; **P < 0.001; ***P < 0.0001 versus placebo.
Figure S8 Study A3921025 a: mean change from baseline in DAS28‐3(CRP) and b: time course of DAS28‐3(CRP)< 2.6. BID, twice daily; CRP, C‐reactive protein; DAS, disease activity score; FAS, full analysis set; QD, once daily. *P ≤ 0.05; **P < 0.001; ***P < 0.0001 versus placebo.
Figure S9 Study A3921035 a: mean change from baseline in DAS28‐3(CRP), b: time course of DAS28‐3(CRP)< 2.6, and c: DAS28‐4(ESR)< 2.6 rates (patients not in remission at baseline). BID, twice daily; CRP, C‐reactive protein; DAS, disease activity score; ESR, erythrocyte sedimentation rate; FAS, full analysis set. *P ≤ 0.05; **P < 0.001; ***P < 0.0001 versus placebo.
Figure S10 Study A3921039 a: mean change from baseline in DAS28‐3(CRP), b: time course of DAS28‐3(CRP)< 2.6, and c: DAS28‐4(ESR)< 2.6 rates (patients not in remission at baseline). BID, twice daily; CRP, C‐reactive protein; DAS, disease activity score; ESR, erythrocyte sedimentation rate; FAS, full analysis set. *P ≤ 0.05; **P < 0.001; ***P < 0.0001 versus placebo.
Figure S11 Study A3921040 a: mean change from baseline in DAS28‐3(CRP), b: time course of DAS28‐3(CRP)< 2.6, and c: DAS28‐4(ESR)< 2.6 rates (patients not in remission at baseline). BID, twice daily; CRP, C‐reactive protein; DAS, disease activity score; ESR, erythrocyte sedimentation rate; FAS, full analysis set. *P ≤ 0.05; **P < 0.001; ***P < 0.0001 versus placebo.
Figure S12 Study A3921019 a: mean HAQ‐DI and b: pain (VAS) over time. BID, twice daily; FAS, full analysis set; HAQ‐DI, Health Assessment Questionnaire‐Disability Index; VAS, visual analog scale.
Figure S13 Study A3921025 a: mean HAQ‐DI and b: pain (VAS) over time. (r), reassigned; BID, twice daily; FAS, full analysis set; HAQ‐DI, Health Assessment Questionnaire‐Disability Index; QD, once daily; VAS, visual analog scale.
Figure S14 Study A3921035 a: mean HAQ‐DI and b: pain (VAS) over time. (r), reassigned; BID, twice daily; FAS, full analysis set; HAQ‐DI, Health Assessment Questionnaire‐Disability Index; VAS, visual analog scale.
Figure S15 Study A3921039 a: mean HAQ‐DI and b: pain (VAS) over time. BID, twice daily; FAS, full analysis set; HAQ‐DI, Health Assessment Questionnaire‐Disability Index; VAS, visual analog scale.
Figure S16 Study A3921040 a: mean HAQ‐DI and b: pain (VAS) over time. BID, twice daily; FAS, full analysis set; HAQ‐DI, Health Assessment Questionnaire‐Disability Index; VAS, visual analog scale.
Table S1 Study design
Table S2 Patient disposition
Table S3 Change from baseline in laboratory values (FAS, no imputation)†