

Abstract
Purpose
Near real‐time vaccine safety surveillance (NRTVSS) is an option for post‐licensure vaccine safety assessment. NRTVSS requires timely recording of outcomes in the database used. Our main objective was to examine recording delays in the Clinical Practice Research Datalink (CPRD) for outcomes of interest for vaccine safety to inform the feasibility of NRTVSS using these data. We also evaluated completeness of recording and further assessed reporting delays for hospitalized events in CPRD.
Methods
We selected Guillain–Barré syndrome (GBS), Bell's palsy (BP), optic neuritis (ON) and febrile seizures (FS), from January 2005 to June 2014. We assessed recording delays (e.g. due to feedback from specialist referral) in stand‐alone CPRD by comparing the event and system dates and excluding delays >1 year. We used linked CPRD‐hospitalization data to further evaluate delays and completeness of recording in CPRD.
Results
Among 51 220 patients for the stand‐alone CPRD analysis (GBS: n = 830; BP: n = 12 602; ON: n = 1720; and FS: n = 36 236), most had a record entered within 1 month of the event date (GBS: 73.6%; BP: 93.4%; ON: 76.2%; and FS: 85.6%). A total of 13 482 patients, with a first record in hospital, were included for the analysis of linked data (GBS: n = 678; BP: n = 4060; ON: n = 485; and FS: n = 8321). Of these, <50% had a record in CPRD after 1 year (GBS: 41.3%; BP: 22.1%; ON: 22.4%; and FS: 41.8%).
Conclusion
This work shows that most diagnoses in CPRD for the conditions examined were recorded with delays of ≤30 days, making NRTVSS possible. The pattern of delays was condition‐specific and could be used to adjust for delays in the NRTVSS analysis. Despite low sensitivity of recording, implementing NRTVSS in CPRD is worthwhile and could be carried out, at least on a trial basis, for events of interest. © 2017 The Authors. Pharmacoepidemiology & Drug Safety Published by John Wiley & Sons Ltd.
Keywords: delay, electronic health records, safety, surveillance, timeliness, vaccines, pharmacoepidemiology
Introduction
The Clinical Practice Research Datalink (CPRD) is a UK primary care database widely used for epidemiological research, including monitoring disease rates over time and assessing the post‐licensure safety of several vaccines using epidemiological designs.1, 2, 3, 4, 5, 6, 7, 8, 9 Near real‐time vaccine safety surveillance (NRTVSS) using electronic health records is a post‐licensure vaccine surveillance tool that involves monitoring rates of adverse events over time to identify changes associated with vaccine use. NRTVSS is ideally started at the time a vaccine is introduced in a population by looking at data at repeated time points to ensure timely signal identification. This type of surveillance is now used by the Vaccine Safety Datalink in the USA and has been implemented by a few other countries.10 In the UK, NRTVSS has been carried out using spontaneous reports to calculate the observed number of events and CPRD data to calculate the expected number of events.11 However, CPRD data have not been used as the sole data source to perform NRTVSS.
The CPRD data are currently updated monthly and are therefore a potential data source for implementing NRTVSS. For near real‐time surveillance, timeliness is paramount. One way of dealing with delays is to delay the analysis until sufficient data accrue. A more timely approach12 is to know how long it takes for data to accrue and then use the pattern of delays to adjust the expected number of events.
Data accrual delays in CPRD can be due to the following: (i) delays in making the diagnosis after an initial consultation, (ii) practices receiving and recording diagnoses made at secondary care and (iii) delays in uploading the data for researchers. Different outcomes of interest might have different sources and levels of delay, depending, for example, on whether the onset of the condition is acute or insidious and the healthcare setting in which it is diagnosed and managed.13 Given CPRD's structure, it is likely that an acute condition that is usually diagnosed and managed by general practitioners (GPs) will accrue more quickly than a condition diagnosed and managed in hospital. Conversely, a more insidious condition and which tends to be diagnosed in secondary care might take longer to accrue. Understanding recording delays, by knowing the time it takes for data to accrue and how this differs by condition, helps to determine the feasibility of implementing NRTVSS in CPRD. In this paper, we focus on delays in practices recording diagnoses made elsewhere (aforementioned scenario ii).
It is also important to understand the sensitivity of CPRD for capturing outcomes of interest. Feedback from secondary care (e.g. hospital admissions and outpatient consultations) may not be completely captured as coded diagnoses in CPRD, for example, if GPs do not code these events but simply scan in hospital letters without adding diagnostic codes to the patient record. The information from hospital admissions in England is recorded in the Hospital Episode Statistics (HES) database and linked to CPRD for a subset of practices. Previous studies have shown that the use of linked data (including primary and secondary care information) improves sensitivity of diagnoses.14, 15, 16 However, these linkages are currently updated too infrequently to allow their use for surveillance purposes. To the best of our knowledge, no previous studies have investigated completeness of recording for conditions of interest for NRTVSS that are typically diagnosed in secondary care such as Guillain–Barré syndrome (GBS).
Our main objective was thus to examine recording delays for selected conditions, due to practices receiving and recording diagnoses made at secondary care, in stand‐alone CPRD, to inform the feasibility of implementing NRTVSS in England using these data. Secondary objectives were to further assess delays and evaluate completeness of recording of diagnoses in CPRD using linked hospitalization data.
Methods
Data sources
For our main analysis, we used data from CPRD, which comprises anonymized UK primary care health records for >11.3 million patients from 674 general practices, with information on demographics, diagnosis, therapies, vaccines, health‐related behaviours and referrals to secondary care.1 Patient information is recorded using Read codes, and when a new record is entered, the software automatically assigns it the current date, the system date. Practice staff also enters an event date, the date generally considered to represent the time the event has occurred. Monthly updates of CPRD data include the date information was last collected from each practice (last collection date).13
Despite being assigned when new records are entered, the system date can be changed when mass transfer of records occurs. These might occur when (Rachael Williams, personal communication) (1) the practice changes software to Vision (and joins CPRD) or updates their version of Vision: previous system dates will be updated for all patients to the date the change has occurred; (2) patients' records are transferred from their previous practice (or an internal transfer of a patient occurs within a practice); the system dates for that patient's records will then all be changed to the date the transfer occurred.
Our secondary analysis used CPRD–HES linked data, which includes patient‐level information from 58% of all CPRD practices.1 HES data are coded using International Classification of Diseases, version 10 (ICD‐10), and each hospitalization includes ≥1 episode, corresponding to the time a patient is under the care of a single consultant.17 Information available includes date of hospital admission and discharge and, for each episode, a starting date (episode date).
Outcomes
We selected four outcomes of interest for NRTVSS10: GBS, Bell's palsy (BP), optic neuritis (ON) and febrile seizures (FS). These represent different characteristics that might affect delays; GBS is an acute condition, diagnosed and managed in hospital; BP is typically diagnosed and managed by GPs; ON is a more insidious condition, likely to be diagnosed in outpatient hospital settings; and FS can be diagnosed and managed in both primary and secondary care.10 For each outcome, a specific and a broader (potentially more sensitive but less specific) code lists were considered (Appendix A). These different versions were used to explore the effect of imperfect validity of different code lists to identify the outcomes. It has been previously suggested that for NRTVSS, a more sensitive code list generates more timely signals.18 We thus considered the broader code list in our main analysis and the specific code list in a sensitivity analysis.
Analysis
System dates and event dates were compared to assess delays in recording. To avoid overestimation of delays because of mass transfers of system dates to later dates, we first studied which records were likely to have been part of such transfers and excluded these from remaining analyses.
We assumed that (i) an unusually high number of records with the same system date was due to a mass transfer; (ii) mass transfers are infrequent, so only a small proportion of patients will have records affected by mass transfers; (iii) there is a threshold number of repeated system dates above which mass transfers can be identified. To identify this threshold, we created a within‐patient proportion of records with the same system date used s times (psi), using eligible patient records from the clinical, test, referral and immunization files. psi is given by tsi/ri, where tsi is the number of records with a given number of repeat system dates and ri the total number of records for that patient. For example, if we consider a patient with a total of 300 records and if this patient has four records registered on one shared system date and four others on a different shared system date, p4 is given by 8/300 ≈ 0.03. This means that 3% of all this patient's records are recorded in blocks of four records.
The patient‐level psi was averaged across all patients ( ). This average proportion of records with the same system date s was displayed graphically, and we selected candidate thresholds, on the basis of our assumptions about mass transfers.
For each threshold, we took a sample of 10 patients with that number of repeated dates (e.g. if threshold = 100, we selected the 100 records with the same system date for 10 patients). We then looked at these records to assess the likelihood that they had been involved in mass transfers. We considered that records with the same system dates that had codes that could feasibly refer to the same condition or a related procedure/test result and which all had the same event date were likely to have been entered on the same day. Conversely, if the codes were unrelated, with varying event dates, this would suggest a mass transfer. To evaluate the influence of the final threshold decision, we calculated the percentage of the outcomes assigned as mass transfers and excluded using the selected threshold.
After excluding system dates likely to have been part of mass transfers, we used a forward approach to assess delays, that is, considering the time from the event date (the assumed date of diagnosis) until the system date (the date the diagnosis was entered in the practice system). Delays were calculated as the difference between the system and event dates (Figure 1(A)). We excluded diagnoses with a delay >1 year as these would be of limited utility for NRTVSS and could be ignored if NRTVSS was only based on events recorded within a year. To give enough time for data to accrue, we considered records with an event data up to June 2014 (using CPRD data released in July 2015). Diagnoses within a year of registration (6 months if aged <1 year) with the practice were excluded to avoid counting past diagnoses recorded retrospectively.19 We described delays in terms of their cumulative distribution and further described these by year of diagnosis to assess whether this distribution was constant over time.
Figure 1.
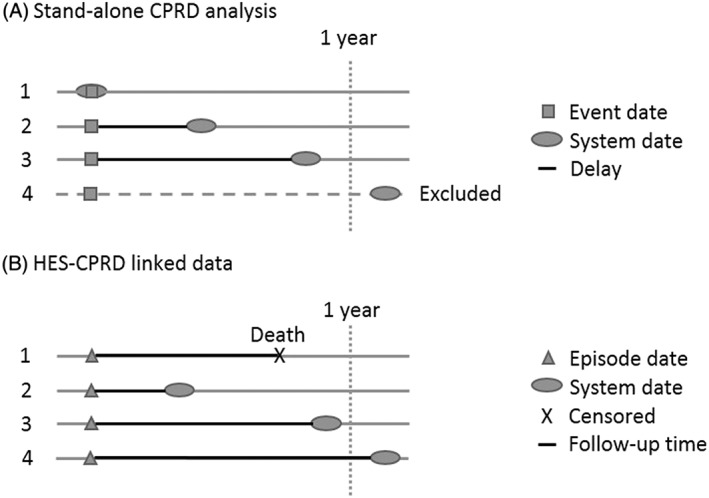
Schematic representation of the analysis undertaken for describing recording delays in CPRD (A) and completeness and delays in HES‐CPRD linked data (B). (A) includes patients with no delay (1), varying delays (2 and 3) and those who were excluded because of having a delay of more than a year (4). (B) includes a censored patient because of death (1), patients with varying delays (2 and 3) and a patient with a delay of more than 1 year, included in the analysis but not displayed in the Kaplan–Meier curves. CPRD, Clinical Practice Research Datalink; HES, Hospital Episode Statistics
The secondary analysis focused on completeness and delays in recording for patients with an outcome of interest in HES. We considered a cohort of patients with an outcome first recorded in HES. Patients were followed up from the hospital episode date in which the outcome was first recorded until they had an outcome in CPRD (noting the system date) or were censored (earliest of date of death, date of leaving the practice, last collection date or July 2015) (Figure 1(B).). We excluded patients with a previous record of the outcome in CPRD, as these would be captured by a system on the basis of CPRD. We conducted a sensitivity analysis to evaluate the effect of adding these patients. Patients with diagnoses within a year of their registration date (6 months if aged <1 year) with the practice were also excluded, unless a relevant diagnosis was made in HES during that period (as the latter is not subject to retrospective recording of this type). Kaplan–Meier analysis of the time until recording the condition in CPRD was used to describe completeness and delays, truncating the curves at 1 year (considered the period of interest for NRTVSS).
Results
Analysis of mass transfers
We identified 54 252 eligible patients for the mass transfer analysis, with 24 905 375 records. Repeated system dates ranged from 1 to 3958. Figure 2 shows the proportion (and cumulative proportion) of records with a unique date, ranging from 2 to 3958 on the same date, averaged across patients. The average proportion of records with repeated dates decreased until 50 records, after which it stabilized. The vast majority (Figure 2 bottom) of records were recorded at the same time as <49 other events.
Figure 2.
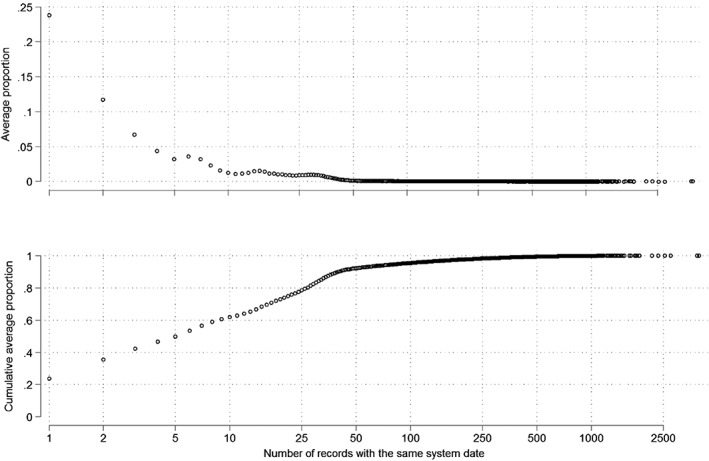
Average proportion (top) and cumulative average proportion of repeated system dates (number of records is represented in the logarithmic scale)
We thus selected 50, 100 and 150 as candidate thresholds, which resulted in losses of 7.7%, 4.5% and 3.1% of records, respectively. Some of the code lists with 50 repeated dates were a mixture of blood tests and diagnosis codes, all with the same event date. These were considered a plausible combination of codes to have been entered on the same system date. On the other hand, all the lists of 100 and 150 codes were for different conditions, with different event dates. We interpreted this as highly suggestive of a mass transfer and therefore selected 100 as the threshold. This reduced cases by 2.3%, 1.5%, 2.4% and 1.5% for GBS, BP, ON and FS, respectively. After excluding records deemed to be mass transfers, we assessed delays in stand‐alone CPRD for 53 414 patients (GBS: n = 905; BP: n = 13 234; ON: n = 1837; and FS: n = 37 625).
Recording delays in stand‐alone Clinical Practice Research Datalink
We further excluded records with delays >1 year (% of exclusions: GBS, 8.3%; BP, 4.8%; ON, 6.4%; and FS, 3.7%). Our final analysis included 51 220 patients (GBS: n = 830; BP: n = 12 602; ON: n = 1720; and FS: n = 36 236). Table 1 summarizes gender, age and year of event date for these patients.
Table 1.
Gender, age and year of event date of included patients by condition
| GBS (n = 830) | BP (n = 12 602) | ON (n = 1720) | FS (n = 36 236) | |
|---|---|---|---|---|
| Gender, n (%) | ||||
| Male | 465 (56.0) | 6218 (49.3) | 569 (33.1) | 19 029 (52.5) |
| Female | 365 (44.0) | 6384 (50.7) | 1151 (66.9) | 17 207 (47.5) |
| Mean age (SD) | 53.5 (20.1) | 48.2 (20.2) | 42.9 (17.8) | 35.4 (29.0) |
| Year of event date, n (%) | ||||
| 2005 | 70 (8.4) | 1317 (10.5) | 187 (10.9) | 3605 (9.9) |
| 2006 | 98 (11.8) | 1240 (9.8) | 181 (10.5) | 3774 (10.4) |
| 2007 | 76 (9.2) | 1275 (10.1) | 191 (11.1) | 3808 (10.5) |
| 2008 | 100 (12.0) | 1430 (11.3) | 162 (9.4) | 3989 (11.0) |
| 2009 | 94 (11.3) | 1407 (11.2) | 175 (10.2) | 3983 (11.0) |
| 2010 | 84 (10.1) | 1376 (10.9) | 182 (10.6) | 3853 (10.6) |
| 2011 | 90 (10.8) | 1390 (11.0) | 196 (11.4) | 3844 (10.6) |
| 2012 | 96 (11.6) | 1320 (10.5) | 195 (11.3) | 3923 (10.8) |
| 2013 | 83 (10.0) | 1251 (9.9) | 166 (9.7) | 3778 (10.4) |
| 2014 | 39 (4.7) | 596 (4.7) | 85 (4.9) | 1679 (4.6) |
BP, Bell's palsy; FS, febrile seizures; GBS, Guillain–Barré syndrome; ON, optic neuritis; SD, standard deviation.
Table 2 and Figure 3 present the cumulative distribution of data accrual lags by condition in CPRD, defined as the time from event date to system date. Most diagnoses were recorded within a month (73.6% (GBS); 93.4% (BP)). BP had the highest percentage of records with identical system and event dates (72.0%), while ON had the lowest (27.8%). BP and FS records accrue more quickly than GBS and ON. These differences occur mainly (but not entirely) until 10 weeks after the event date, after which data accrual seemed to stabilize. Using a more specific code list yielded similar patterns (Appendix B). These patterns were constant over time (Appendix C).
Table 2.
Cumulative distribution of delays by condition (n (%))
| Delay* | GBS (n = 830) | BP (n = 12 602) | ON (n = 1720) | FS (n = 36 236) |
|---|---|---|---|---|
| Same day | 275 (33.1) | 9076 (72.0) | 478 (27.8) | 14 254 (39.3) |
| First week | 371 (44.7) | 10 459 (83.0) | 699 (40.6) | 22 181 (61.2) |
| First month | 611 (73.6) | 11 776 (93.4) | 1310 (76.2) | 31 031 (85.6) |
| 6 months | 790 (95.2) | 12 431 (98.6) | 1672 (97.2) | 35 575 (98.2) |
| 1 year | 830 (100.0) | 12 602 (100.0) | 1720 (100.0) | 36 236 (100.0) |
BP, Bell's palsy; FS, febrile seizures; GBS, Guillain–Barré syndrome; ON, optic neuritis.
Defined as the difference between the system and the event date.
Figure 3.
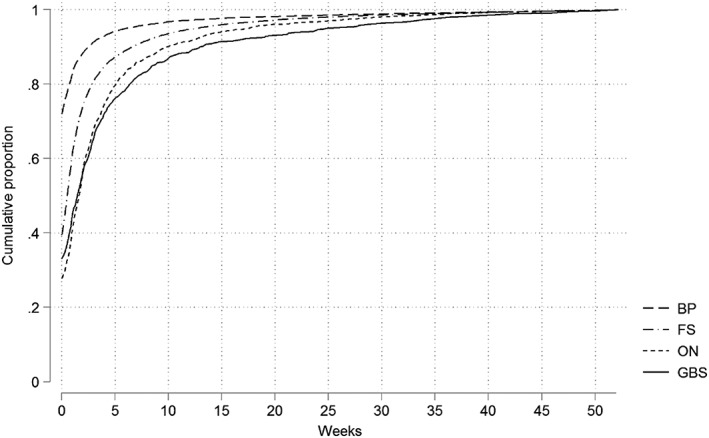
Weekly data accrual in CPRD across 52 weeks considering data accrued during the first year and diagnosis made up to June 2014. BP, Bell's palsy; CPRD, Clinical Practice Research Datalink; FS, febrile seizures; GBS, Guillain–Barré syndrome; ON, optic neuritis
Comparison of Hospital Episode Statistics–Clinical Practice Research Datalink
We included 13 482 patients (GBS: n = 678; BP: n = 4060; ON: n = 485; FS: n = 8321) with a first outcome recorded in HES. Table 3 shows the characteristics of included patients and completeness of recording in CPRD. Age and sex distributions for GBS and FS were similar to those observed for the stand‐alone data. BP and ON patients in HES were older (mean age: BP: HES—57.4, CPRD—48.2; ON: HES—49.9, CPRD—42.9). BP and ON had the lowest completeness of recording and FS and GBS the highest. Most records accrued within a year. When we added patients with a first record in CPRD, the increase in total completeness was less than 10% (Appendix D).
Table 3.
Characteristics of included patients, time of follow‐up and completeness of records in Clinical Practice Research Datalink per condition of interest
| GBS (n = 678) | BP (n = 4060) | ON (n = 485) | FS (n = 8321) | |
|---|---|---|---|---|
| Gender, n (%) | ||||
| Male | 363 (53.5) | 1844 (45.4) | 155 (32.0) | 4662 (56.0) |
| Female | 315 (46.5) | 2216 (54.6) | 330 (68.0) | 3659 (44.0) |
| Mean age (SD) | 55.8 (21.0) | 57.4 (24.1) | 49.9 (25.2) | 34.8 (31.2) |
| Year of diagnosis,* n (%) | ||||
| 2005 | 61 (9.0) | 424 (10.4) | 56 (11.5) | 1264 (15.2) |
| 2006 | 73 (10.8) | 460 (11.3) | 45 (9.3) | 1108 (13.3) |
| 2007 | 79 (11.7) | 400 (9.9) | 47 (9.7) | 1103 (13.3) |
| 2008 | 85 (12.5) | 417 (10.3) | 47 (9.7) | 1055 (12.7) |
| 2009 | 79 (11.7) | 515 (12.7) | 56 (11.5) | 912 (11.0) |
| 2010 | 69 (10.2) | 545 (13.4) | 68 (14.0) | 793 (9.5) |
| 2011 | 76 (11.2) | 471 (11.6) | 48 (9.9) | 702 (8.4) |
| 2012 | 71 (10.5) | 404 (10.0) | 56 (11.5) | 715 (8.6) |
| 2013 | 69 (10.2) | 358 (8.8) | 54 (11.1) | 531 (6.4) |
| 2014 | 16 (2.4) | 66 (1.6) | 8 (1.6) | 138 (1.7) |
| Median follow‐up time (years) | 0.9 | 1.9 | 2.1 | 1.4 |
| Completeness, % (95% confidence interval)† | ||||
| Maximum | 45.9 (41.5–50.5) | 26.8 (25.0–28.7) | 28.5 (22.9–35.0) | 46.0 (44.8–47.2) |
| At 1 year | 41.3 (37.6–45.3) | 22.1 (20.8–23.5) | 22.4 (18.9–26.5) | 41.8 (40.7–42.9) |
BP, Bell's palsy; FS, febrile seizures; GBS, Guillain–Barré syndrome; ON, optic neuritis; SD, standard deviation.
Considering the start of episode date in Hospital Episode Statistics database.
Kaplan–Meier estimates of individuals with a record in Clinical Practice Research Datalink.
Figure 4 illustrates data accrual patterns. BP and FS accrued more quickly at initial stages and plateaued sooner than the other outcomes. GBS showed a steadier accrual pattern, plateauing at around 20 weeks after HES recording. Sensitivity analyses using specific code lists showed similar patterns (Appendix E).
Figure 4.
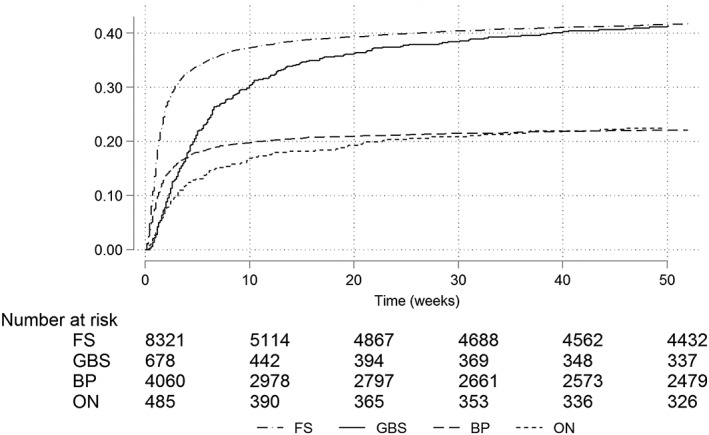
Kaplan–Meier recording estimates considering a first record in HES and a subsequent record in CPRD, truncated at 1 year. BP, Bell's palsy; CPRD, Clinical Practice Research Datalink; FS, febrile seizures; GBS, Guillain–Barré syndrome; HES, Hospital Episode Statistics; ON, optic neuritis
Discussion
We have conducted a comprehensive analysis of recording delays and completeness for four outcomes, to inform NRTVSS. Our results showed that data accrual patterns and completeness depend on the conditions studied. Selecting conditions with different characteristics (in clinical presentation, place of diagnosis and management) enabled us to capture these different patterns. BP showed the quickest data accrual and highest agreement between system and event date, consistent with a condition often diagnosed and managed by GPs. GBS and ON showed the slowest data accrual. GBS is an acute condition usually requiring admission, while ON is typically diagnosed and managed in outpatient settings. We considered FS as an acute condition diagnosed at any level of care, but in most cases not requiring prolonged admission. This is consistent with an intermediate agreement between system and event date (38.1%) and more rapid data accrual than GBS and ON. Overall, our findings indicate that conditions diagnosed by GPs or during short‐term hospital admissions tend to accrue more quickly than conditions diagnosed in hospital with longer admission or diagnosed in outpatients. In general, data captured in CPRD accrued within the first month of the diagnosis, making NRTVSS possible using this data source.
Our assessment of completeness showed that a low proportion of diagnoses first recorded in HES subsequently accrued in CPRD. It seems particularly unlikely that GPs are aware of <50% of cases of serious conditions such as GBS. A recent UK study that contacted GPs about patients with a coded GBS diagnosed in HES found that 68.2% (95% confidence interval: 60.7–74.9%) were aware of a GBS diagnosis made in hospital that has been confirmed (Julia Stowe, personal communication). Incomplete diagnostic coding in general practice may occur because GPs instead scan in hospital letters or record diagnoses in free text, neither of which is now available to researchers using CPRD because of changes in the information governance environment in the UK. This might have decreased the ability to assess fully the validity of CPRD data for research purposes. The inclusion of therapy codes might help to capture some incompletely coded diagnoses for conditions requiring treatment, but the conditions we examined do not have unique treatments. On the other hand, HES is itself an imperfect source to capture conditions of interest as it might include unconfirmed cases. If that is the case, our analysis would have underestimated completeness in CPRD. For NRTVSS, if completeness is constant over time, this should not bias the results, but it decreases power. Knowing whether there is enough power is a key aspect when considering a new data source to implement NRTVSS. This goes beyond the scope of our study but should be assessed by future work looking at trial implementation of NRTVSS using CPRD. Results from that work will allow further conclusions on the possibility of implementing NRTVSS using CPRD. A further consideration is that, for conditions which may not always require hospital admission, hospitalized patients may be a particular subset of all cases, for example, those with more severe disease (as highlighted in studies of upper gastrointestinal bleeding and venous thromboembolism14, 20) or specific patient characteristics (as in our study, which showed that patients with BP and ON captured in HES were older). This will matter if the adverse event is more likely among these specific subgroups.
Previous adjustments for accrual delays when conducting NRTVSS with administrative claims data have focused on delays in processing information for filing and approval.12 Primary care‐based data have different sources of delay, and our work focused on delays in practices documenting feedback from secondary care. Our work thus differs from Greene et al.12 in the reasons for the delays we have considered. In addition, we looked at four outcomes (GBS, BP, ON and FS), while Greene et al.12 have only considered GBS. Other sources of delay include time before data are made available; CPRD data are released to researchers monthly and practices upload data some time before each release. These delays could be examined by looking at the time between last collection date and date of release, and adjustments made depending on the patterns of such delays. Delays in making diagnoses could involve identifying early symptom codes, with the extent of delay varying by condition. The results of our study indicate that adjustments for data accrual delays should be tailored for individual conditions and that future studies should consider including setting‐specific adjustments, that is, generating delay distributions for diagnoses made in primary care, in‐patient and outpatient settings. More broadly, we recommend that researchers reflect on the source of delays in their data and whether these delays are likely to be dependent on the outcomes of interest, to help decide whether to establish condition‐specific data accrual patterns.
To the best of our knowledge, this is the first in‐depth analysis of recording delays in CPRD. Sammon and Petersen13 recently examined the number of records lost as a function of last collection date, to inform incidence or prevalence studies. Our study complements and extends this work by quantifying delays for selected conditions and investigating how their characteristics affect delays. Our study is novel in showing the limitations of using system dates, and we have proposed a simple approach to minimize the effects of these limitations that are relevant to those planning surveillance using CPRD. We also provide the first analyses of both completeness and timeliness of recording of these four specific conditions in CPRD.
This study is subject to some limitations. Firstly, measurement error in delays in stand‐alone CPRD may have resulted from errors in system and event dates. We addressed misclassification of system dates by excluding dates that were likely to have been part of mass transfers. As we did not take an unduly low threshold, we may have included some transferred system dates and thus overestimated delays. However, our exclusion of delays >1 year should have minimized this issue. Furthermore, if the same criteria are applied to a future NRTVSS, inclusion of these records should not bias results. The event date is also an imperfect measure of the date of diagnosis. When entering diagnoses made elsewhere, GPs might insert the diagnosis date, but alternatively, the date of hospital admission or discharge, the date the hospital letter was received or the date of data entry. For the latter three scenarios, our delays (the difference between system and event dates) would be underestimated. However, if this coding behaviour is constant over time, any adjustments made in the future considering our results would be valid. Furthermore, the choice of code lists affects the validity of cases. We did not validate the code lists directly, but assessed the potential effects of imperfect validity by using code lists with different levels of sensitivity. The use of a more specific code list did not substantially affect our results. When implementing a new system, this should be further assessed; previous analyses suggest that a more sensitive code list might produce more timely results.18 Finally, we did not quantify the uncertainty around the data accrual estimates in CPRD. However, our sensitivity analysis describing yearly patterns showed stable results, suggesting it is appropriate to use our distributions for future adjustments.
In conclusion, this work shows that most diagnoses recorded in stand‐alone CPRD accrued within the first month, making NRTVSS possible. The distribution of delays was condition‐specific, and the weekly delay distribution could be used to adjust for delays in the NRTVSS analysis. CPRD can be a viable data source to use in this kind of analysis; next steps will include trial implementation of the system using these data.
Conflict of Interest
The authors declare no conflict of interest.
Key Points.
Near real‐time vaccine safety surveillance using electronic health records is one of the methods available to detect vaccine safety signals. It requires timely data.
The Clinical Practice Research Datalink (CPRD) is a potential data source for this surveillance.
Delays in recording of events in CPRD will limit its utility, and delays were found to vary by condition. For Bell's palsy and febrile seizures, events were recorded sooner than for Guillain–Barré syndrome and optic neuritis. For all these conditions, most events documented by practices were recorded within the first month of the presumed diagnosis date.
Records of Guillain–Barré syndrome, Bell's palsy, optic neuritis and febrile seizures diagnosed in hospital have low completeness of recording in CPRD, with less than 50% recorded within a year of the hospital admission date.
The CPRD is a feasible data source to implement near real‐time surveillance, although sensitivity of recording of events first seen at hospital may be low.
Ethics Statement
All data were anonymized prior to receipt by the authors. Ethics approval for the study was given by the Independent Scientific and Advisory Committee (of CPRD) and the London School of Hygiene and Tropical Medicine Ethics Committee.
Supporting information
Appendix A. Code lists
Appendix B. Sensitivity analysis—specific codes stand‐alone CPRD
Appendix C. Sensitivity analysis—data accrual per year
Appendix D. Sensitivity analysis—including patients with a previous record in CPRD
Appendix E. Sensitivity analysis—specific codes linked data
Acknowledgements
The research was funded by the National Institute for Health Research Health Protection Research Unit (NIHR HPRU) in Immunisation at the London School of Hygiene and Tropical Medicine in partnership with Public Health England. The views expressed are those of the author(s) and not necessarily those of the NHS, the NIHR, the Department of Health or Public Health England. The funders had no role in the study design, data collection, analysis or interpretation.
Leite, A. , Andrews, N. J. , and Thomas, S. L. (2017) Assessing recording delays in general practice records to inform near real‐time vaccine safety surveillance using the Clinical Practice Research Datalink (CPRD). Pharmacoepidemiol Drug Saf, 26: 437–445. doi: 10.1002/pds.4173.
This work has not been submitted or accepted elsewhere. Preliminary results have been presented at the Public Health England Applied Epidemiology Scientific Conference, Warwick, March 2016, and have been accepted for presentation at the 2016 International Population Data Linkage Conference to take place in August 2016.
References
- 1. Herrett E, Gallagher AM, et al Data resource profile: Clinical Practice Research Datalink (CPRD). Int J Epidemiol 2015; 44: 827–836. [DOI] [PMC free article] [PubMed] [Google Scholar]
- 2. Alexandropoulou K, van Vlymen J, Reid F, Poullis A, Kang JY. Temporal trends of Barrett's oesophagus and gastro‐oesophageal reflux and related oesophageal cancer over a 10‐year period in England and Wales and associated proton pump inhibitor and H2RA prescriptions: a GPRD study. Eur J Gastroenterol Hepatol 2013; 25: 15–21. [DOI] [PubMed] [Google Scholar]
- 3. Millett ER, Quint JK, Smeeth L, Daniel RM, Thomas SL. Incidence of community‐acquired lower respiratory tract infections and pneumonia among older adults in the United Kingdom: a population‐based study. PLoS One 2013; 8: e75131. [DOI] [PMC free article] [PubMed] [Google Scholar]
- 4. West J, Fleming KM, Tata LJ, Card TR, Crooks CJ. Incidence and prevalence of celiac disease and dermatitis herpetiformis in the UK over two decades: population‐based study. Am J Gastroenterol 2014; 109: 757–768. [DOI] [PMC free article] [PubMed] [Google Scholar]
- 5. Clarke AT, Johnson PC, Hall GC, Ford I, Mills PR. High dose atorvastatin associated with increased risk of significant hepatotoxicity in comparison to simvastatin in UK GPRD cohort. PLoS One 2016; 11: e0148349. [DOI] [PMC free article] [PubMed] [Google Scholar]
- 6. Dodd CN, Romio SA, Black S, et al. International collaboration to assess the risk of Guillain Barré syndrome following influenza A (H1N1) 2009 monovalent vaccines. Vaccine 2013; 31: 4448–4458. [DOI] [PubMed] [Google Scholar]
- 7. Smeeth L, Cook C, Fombonne E, et al. MMR vaccination and pervasive developmental disorders: a case–control study. Lancet 2004; 364: 963–969. [DOI] [PubMed] [Google Scholar]
- 8. Stowe J, Andrews N, Bryan P, Seabroke S, Miller E. Risk of convulsions in children after monovalent H1N1 (2009) and trivalent influenza vaccines: a database study. Vaccine 2011; 29: 9467–9472. [DOI] [PubMed] [Google Scholar]
- 9. Johansson S, Wallander MA, de Abajo FJ, García Rodríguez LA. Prospective drug safety monitoring using the UK Primary‐Care General Practice Research Database. Drug Saf 2010; 33: 223–232. [DOI] [PubMed] [Google Scholar]
- 10. Leite A, Andrews NJ, Thomas SL. Near real‐time vaccine safety surveillance using electronic health records—a systematic review of the application of statistical methods. Pharmacoepidemiol Drug Saf 2016; 25: 225–237. [DOI] [PMC free article] [PubMed] [Google Scholar]
- 11. Donegan K, Beau‐Lejdstrom R, King B, Seabroke S, Thomson A, Bryan P. Bivalent human papillomavirus vaccine and the risk of fatigue syndromes in girls in the UK. Vaccine 2013; 31: 4961–4967. [DOI] [PubMed] [Google Scholar]
- 12. Greene SK, Kulldorff M, Yin R, et al. Near real‐time vaccine safety surveillance with partially accrued data. Pharmacoepidemiol Drug Saf 2011; 20: 583–590. [DOI] [PubMed] [Google Scholar]
- 13. Sammon CJ, Petersen I. Backdating of events in electronic primary health care data: should one censor at the date of last data collection. Pharmacoepidemiol Drug Saf 2016; 25: 378–384. [DOI] [PubMed] [Google Scholar]
- 14. Crooks CJ, Card TR, West J. Defining upper gastrointestinal bleeding from linked primary and secondary care data and the effect on occurrence and 28 day mortality. BMC Health Serv Res 2012; 12: 1–9. [DOI] [PMC free article] [PubMed] [Google Scholar]
- 15. Herrett E, Shah AD, Boggon R, et al. Completeness and diagnostic validity of recording acute myocardial infarction events in primary care, hospital care, disease registry, and national mortality records: cohort study. BMJ 2013; 346: f2350. [DOI] [PMC free article] [PubMed] [Google Scholar]
- 16. Millett ERC, Quint JK, De Stavola BL, Smeeth L, Thomas SL. Improved incidence estimates from linked vs. stand‐alone electronic health records. J Clin Epidemiol 2016; 75: 66–69. [DOI] [PMC free article] [PubMed] [Google Scholar]
- 17. Health and Social Care Information Centre. Hospital Episode Statistics . 2015. http://www.hscic.gov.uk/hes (accessed 25 July 2016).
- 18. Maro JC, Brown JS, Dal Pan GJ, Kulldorff M. Minimizing signal detection time in postmarket sequential analysis: balancing positive predictive value and sensitivity. Pharmacoepidemiol Drug Saf 2014; 23: 839–848. [DOI] [PMC free article] [PubMed] [Google Scholar]
- 19. Lewis JD, Bilker WB, Weinstein RB, Strom BL. The relationship between time since registration and measured incidence rates in the General Practice Research Database. Pharmacoepidemiol Drug Saf 2005; 14: 443–451. [DOI] [PubMed] [Google Scholar]
- 20. Gallagher AM, Williams T, Leufkens HG, de Vries F. The impact of the choice of data source in record linkage studies estimating mortality in venous thromboembolism. PLoS One 2016; 11: e0148349. [DOI] [PMC free article] [PubMed] [Google Scholar]
Associated Data
This section collects any data citations, data availability statements, or supplementary materials included in this article.
Supplementary Materials
Appendix A. Code lists
Appendix B. Sensitivity analysis—specific codes stand‐alone CPRD
Appendix C. Sensitivity analysis—data accrual per year
Appendix D. Sensitivity analysis—including patients with a previous record in CPRD
Appendix E. Sensitivity analysis—specific codes linked data