Abstract
Physicochemical properties of cationic dioxa 1, azaoxa 2 and diaza 3 [6]helicenes demonstrate a much higher chemical stability of diaza adduct 3 (pKR+ 20.4, −0.72 V) compared to azaoxa 2 (pKR+ 15.2, −0.45 V) and dioxa 1 (pKR+ 8.8, −0.12 V) analogues. The fluorescence of these cationic chromophores was established and ranges from the orange to the far-red regions. From 1 to 3, a bathochromic shift of the lowest energy transitions (up to 614 nm in acetonitrile) and an enhancement of the fluorescence quantum yields and lifetimes (up to 31% and 9.8 ns at 658 nm) are observed. The triplet quantum yields and the circularly polarized luminescence are also reported. Finally, fine tuning of the optical properties of the diaza [6]helicene core was achieved through selective and orthogonal post-functionalization reactions (12 examples, compounds 4-15). The electronic absorption is modulated from the orange to far-red spectral range (560-731 nm) while fluorescence is observed from 591 to 755 nm with enhanced quantum efficiency up to 70% (619 nm). The influence of the peripheral auxochrome substituents is rationalized by first-principles calculations.
Keywords: helicene, carbocation, electrochemistry, fluorescence, time-resolved spectroscopy, circularly polarized luminescence, TD-DFT
Graphical abstract
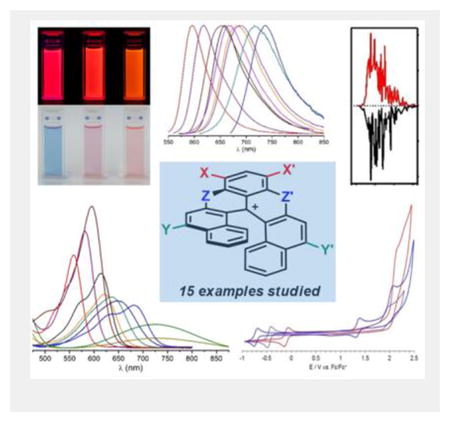
Physicochemical properties of cationic dioxa, azaoxa and diaza [6]helicenes demonstrate (i) a remarkably high chemical stability of these cationic adducts, (ii) fluorescence from the orange to the far-red regions with non-negligible quantum yields and lifetimes, (iii) circularly polarized luminescence in the same ranges. Selective post-functionalization of the diaza [6]helicene introduces peripheral auxochrome substituents (12 examples). Their influence on the optical properties is rationalized by first-principles calculations.
Introduction
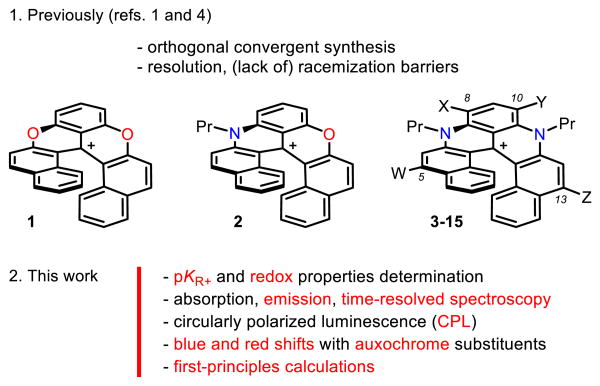
Previously, cationic dioxa, azaoxa and diaza [6]helicenes 1-3 have been reported (Figure 1, W,X,Y,Z=H).[1],[2] Their preparation involves five straightforward steps to reach a common late-stage intermediate and then divergent procedures to afford the final products.[3] Compounds 1-3 are effective chromophores and can be isolated as single enantiomers (M or P configurations). Pronounced chiroptical properties have been obtained e.g., electronic circular dichroism (ECD) in both UV and visible spectral windows.[4] Furthermore, regioselective post-functionalization of diaza [6]helicene 3 is possible with both electrophilic and nucleophilic reagents enabling the introduction of auxochromes in either positions 8 and 10, or 5 and 13 respectively (helicenes 4 to 15, see Figures 1 and 7).
Figure 1.
Cationic [6]helicenes (only P enantiomers shown): dioxa 1, azaoxa 2 and diaza 3-15 (W,X,Y,Z=H, halogens, NO2, CN, aryl or amines, see Figure 7 for details).
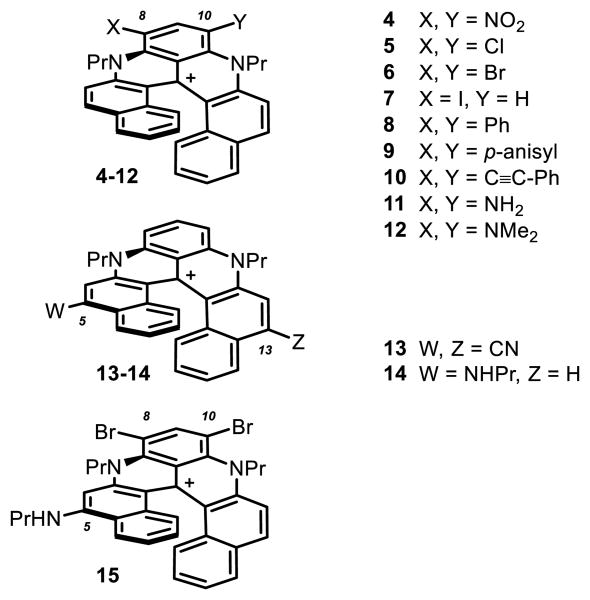
Figure 7.
Substituted diaza [6]helicenes 4-15 carrying auxochrome substituents at positions 5, 8, 10 or 13. The BF4– counterion is omitted for clarity.
Herein, core properties of cationic helicenes 1 to 3 are reported. Remarkable chemical stabilities are evidenced by measurements of highly positive pKR+ values (up to +20.4) and low one-electron reduction potentials. In-depth studies also demonstrate low-energy emissions for 1-3 accompanied by large fluorescence quantum yields and lifetimes at unusual wavelengths for purely organic helicenes (e.g., 3 at 658 nm: ϕfl = 31% and τ = 9.8 ns in acetonitrile).[5] Transient absorption measurements of 1-3 indicate that fluorescence and internal conversion are the main decay processes of the lowest singlet excited state. However upon substitution with a heavy atom, such as iodine, intersystem crossing to the triplet state becomes dominant. Circularly polarized luminescence (CPL) of enantiopure samples of 1-3 is also reported at low energy (e.g., 2 at ∼ 614 nm: glum values of ‐0.0021/+0.0020). Finally and importantly, with modified helicenes 4-15, both absorption and emission properties can be adjusted by the nature of substituents introduced at the periphery of the helical core. A maximum fluorescence quantum yield of 70% is obtained for 14 (619 nm, W=NHPr; X,Y,Z=H) and the lowest energy emission is observed for 13 (730 nm, ϕfl 1%, W,Z=CN; X,Y=H). The influence on the electronic properties of the different substitution patterns is further rationalized thanks to in silico modeling.
Results and Discussion
Core structures (1-3)
Derivatives 1-3 are [6]helicenes and triaryl methyl carbenium moieties at the same time.[6] In principle, they can react with nucleophiles in SN1-like addition processes. Their existence as cations was consequently debatable under neutral and/or basic or reductive conditions. To establish their chemical stability, pKR+ values and one-electron reduction potentials were thus measured.
Carbenium stability
As electrophiles, triaryl methyl carbenium ions are in fact expected to react with water and form carbinol derivatives after proton loss (equation 1). This reaction and the corresponding equilibrium constant can be used to characterize the chemical stability of carbocationic structures (equation 2). For instance, highly stable carbenium ions present a low reactivity and hence highly positive pKR+ values.[2k]
| (1) |
| (2) |
| (3) |
Experimentally, the equilibrium can be monitored by UV/vis absorption spectroscopy as cationic compounds 1-3 are colorful dyes and the corresponding carbinols essentially colorless (equation 3).[1,4] In the case of the most reactive 1, measurements were performed in 0.1 M sodium borate buffered aqueous solutions using NaOH as base (see ESI).[7] However with 2 and 3, equimolar concentrations of carbenium and carbinol species, [R+] = [ROH], were never reached in aqueous solutions, even at pH = 14. For these dyes, the measurements were therefore performed in mixtures of DMSO/water/Me4N+OH- for which the DMSO:water ratio modulates the basicity beyond pH 14.[8] For the calculations, it was then necessary to use the C_ acidity function defined by Laursen and co-workers instead of the regular pH scale.[9] For each carbenium ion, the log([ROH]/[R+]) is plotted vs. C_ (Figure 2 and ESI for details). The intercepts with the origin of the linear fitted lines indicate when equimolar concentrations of [R+] and [ROH] are obtained and hence the pKR+ values.[10] In fine, values of 8.8, 15.2 and 20.4 were determined for 1, 2 and 3, respectively.[11] Clearly and as expected, compound 1 is the most electrophilic. Replacing the oxygen atoms at bridge positions by more electron-donating nitrogen leads to a substantial increase in chemical stability for carbenium ions 2 and 3. An analogous trend has been previously observed for cationic [4]helicenes[8,12] as well as for related structures.[2k]
Figure 2.
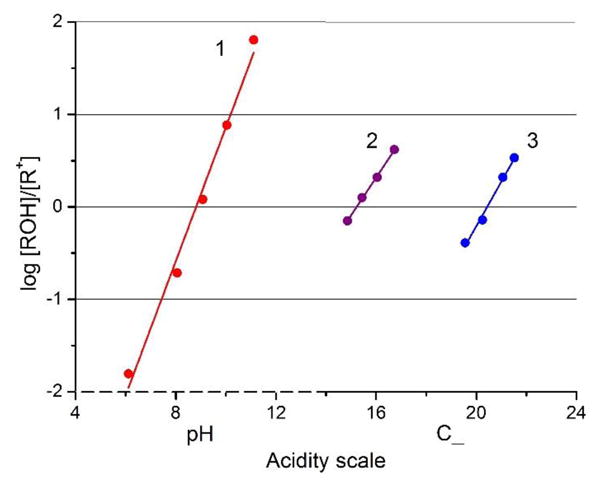
log([ROH]/[R+]) vs. acidity plots for dioxa 1 (red), azaoxa 2 (purple) and diaza[6]helicene 3 (blue).
Electrochemical properties
To further assess the stability of the cationic species, the redox properties of compounds 1-3 were characterized. The electrochemical behavior of these species was analyzed by cyclic voltammetry (CV). The CV curves presented in Figure 3 were recorded in degassed acetonitrile solutions that contained 1 mM of each [6]helicenes and n-tetrabutylammonium hexafluorophosphate (TBAPF6) as the supporting electrolyte (data are gathered in Table 1).[13] Diaza [6]helicene 3 exhibits a relatively simple redox behavior (Figure 3). This compound is typically reduced at = −0.72 V vs. Fc/Fc+ with a peak to peak separation (ΔEpeaks) of ∼ 57 mV evidencing a reversible monoelectronic transfer generating a neutral species from the cation. The first oxidation also shows a reversible behavior with = 1.40 V vs. Fc/Fc+ and ΔEpeaks ∼ 62 mV. The peak to peak separation deviates slightly from ideal but still points out to a reversible one electron mechanism. The scan rate was varied in the range 0.1 to 1 V.s-1 and the study of the current peak shows a linear evolution with respect to the square root of scan rate (data not shown), which is perfectly consistent with a diffusion controlled process. A second oxidation is observed at a more anodic potential ca. 2 V, and the irreversibility of this process can be assigned to an irreversible oxidative decomposition of the [6]helicene core which was not further investigated.
Figure 3.
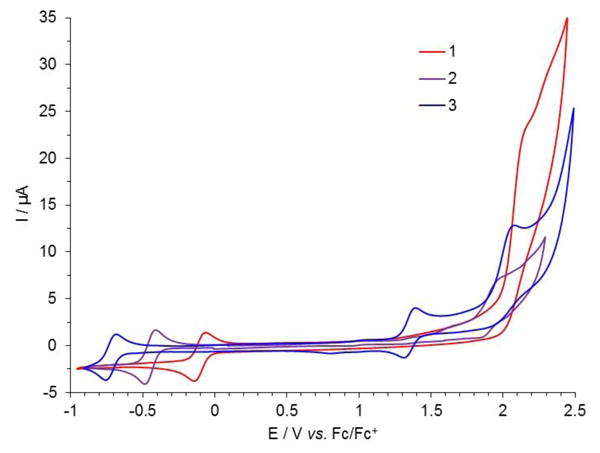
Cyclic voltammograms of 1 mM dioxa (1, red), azaoxa (2, purple) and diaza (3, blue) [6]helicenes, recorded in degassed CH3CN solution containing 0.1 M TBAPF6 as supporting electrolyte (ν = 0.1 V.s-1). The potential is scanned first towards positive values and then towards negative ones.
Table 1.
Anodic and cathodic half-wave potentials (E1/2) values measured by CV for 1-3 in acetonitrile (0.1 M TBAPF6) at a Pt electrode (ν = 0.1 V.s-1), E vs. Fc/Fc+. Fundamental gaps and optical gaps for 1-3.
| Compound | (V) | (V) | Fund. gap (eV)[b] | Opt. gap (eV)[c] |
|---|---|---|---|---|
| 1 | −0.12 | 2.14[a] | 2.26 | 2.15 |
| 2 | −0.45 | 1.93[a] | 2.38 | 2.11 |
| 3 | −0.72 | 1.40 | 2.12 | 1.95 |
The anodic process is partially irreversible for 2 and fully irreversible for 1 and therefore the reported value corresponds to the oxidation peak potential for these compounds.
Fundamental (Fund.) . For the compounds characterized by irreversible oxidation, the value of is replaced by the peak potential in a first approximation.
Optical (Opt.) gap = 0-0 energy.
With azaoxa 2, the reductive behavior is apparently unchanged with a single reversible one-electron reduction, however occurring at a much less cathodic potential ( = −0.45 V vs. Fc/Fc+ and ΔEpeaks ∼ 58 mV). On the other hand a partially irreversible oxidation process is observed occurring at large anodic overpotentials ( = 1.93 V vs. Fc/Fc+). Finally, the electrochemical characterization of dioxa [6]helicene 1 reveals an even easier reduction process ( = −0.12 V vs. Fc/Fc+ with ΔEpeaks ∼ 60 mV) but also a very large value (2.14 V vs. Fc/Fc+) for the fully irreversible oxidation. No improvement of reversibility was noticed by increasing the scan rate (data not shown). This indicates that the replacement of nitrogen atoms by oxygen atoms irreversibly perturbs the oxidation pathways as the “substitution” clearly destabilizes the corresponding dicationic structures. It is noteworthy that a similar structure–activity relationship was previously observed on cationic triangulene dyes.[14] Not surprisingly, the reduction behavior of 2 stands in-between compounds 1 and 3 as a one-to-one comparison reveals cathodic shift of 0.33 V and 0.27 V respectively. As evidenced through the measurement of the pKR+ values of compounds 1-3 (vide supra) or observed in the case of other cationic helicenes the introduction of amino groups in place of the O atoms in the core structures clearly stabilizes the carbocations [2k,12b,12d] Overall, the CV investigation reveals for all three cationic [6]helicenes a reversible monoelectronic reduction whereas the oxidation could be either reversible (diaza 3) or irreversible (dioxa 1 and azaoxa 2).
From the recorded voltammograms of 1, 2 and 3, the corresponding fundamental gaps were estimated in a first approximation (Table 1).[15] In fact, for the irreversible oxidation waves, the peak potentials may shift depending on the scan rate, on the concentration and on the kinetics of the subsequent chemical reactions. Even if the peak potential could not be considered as the standard potential for the oxidation of 1 and 2, we used this value to estimate the fundamental gap and to compare the resulting values with those from the optical experiments. Taking into account this approximation, only a minor contribution of the N atom can be seen when comparing dioxa 1 and azaoxa 2. Diaza 3 stands apart with a fundamental gap energy substantially lower compared to the two other carbocationic species. In an effort to get more insights into the electronic properties of compounds 1-3, we investigated their optical properties and determined their optical gap.
Absorption and fluorescence
The electronic absorption and fluorescence properties of [6]helicenes 1-3 were recorded in acetonitrile (Figure 4 and Table 2). The absorption spectrum of diaza [6]helicene 3 shows an intense (ε = 14700 M-1 cm-1) lowest energy transition centered at 614 nm presenting a shoulder at higher energy, reminiscent of its parent diaza [4]helicene cation.[5a] Compounds 1 and 2 both exhibit a blue-shifted absorption maximum at 562 nm. While the absorption profiles and the molar extinction coefficients are comparable for 1 and 3, noticeable broadening and hypochromic shift of the absorption peak are highlighted for the azaoxa derivative 2 (ε = 10700 M-1 cm-1). Optical gaps of 2.15, 2.11 and 1.95 eV were determined for 1, 2 and 3 respectively (Table 1). The difference in energy between the fundamental gap and the optical gap, i.e. the electron-hole pair binding energy, is rather low for 1 (0.11 eV) compared to 2 and 3 (0.27 and 0.17 eV respectively).[15b],[16]
Figure 4.
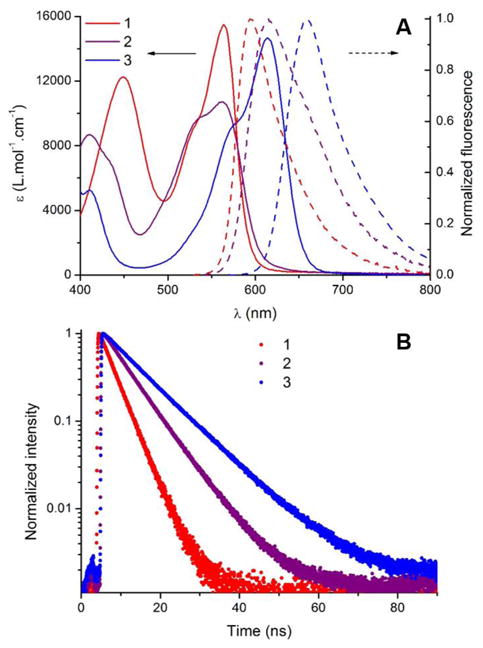
A) absorption (plain lines) and normalized fluorescence spectra (dash lines) of dioxa (1, red), azaoxa (2, purple) and diaza [6]helicene (3, blue) in acetonitrile (2.10-5 mol.L-1). B) intensity normalized fluorescence time profiles.
Table 2.
Spectroscopic properties of 1-3 and substituted diaza[6]helicenes 4 – 15 in acetonitrile.
| Cpd. | Substituents: positions | λabs (nm) | ε (103 M‐1 cm‐1) | λem (nm) | ϕfl (%) | τ (ns) | kR (106 s‐1)[a] | kNR (106 s‐1)[b] | |
|---|---|---|---|---|---|---|---|---|---|
| 1 | - | 562 | 15.5 | 595 | 12[c] | 9[e] | 4.0 | 30.0 | 220 |
| 2 | - | 562 | 10.7 | 614 | 22[c] | 19[e] | 6.8 | 32.3 | 115 |
| 3 | - | 614 | 14.7 | 658 | 31[c] | 20[d] | 9.8 | 31.6 | 70.4 |
| 4 | NO2: 8,10 | 560 | 18.2 | 591 | 46[c] | 50[e] | 10.9 | 42.2 | 49.5 |
| 5 | Cl: 8,10 | 630 | 14.4 | 690 | 13[c] | 8[d] | 6.1 | 31.3 | 143 |
| 6 | Br: 8,10 | 622 | 10.5 | 678 | 6.5[c] | 4[d] | 3.0 | 21.7 | 312 |
| 7 | I: 8 | 620 | 13.4 | 675 | 2.6[c] | 1.5[d] | 1.0 | 26.0 | 974 |
| 8 | Ph: 8,10 | 642 | 9.8 | 711 | 1.6[d] | 2.0 | 8.0 | 492 | |
| 9 | p-anisyl: 8,10 | 657 | 8.9 | 755 | <1[d] | 0.3[f] | 6.7 | 3330 | |
| 10 | PhC≡C: 8,10 | 650 | 8.3 | 740 | <1[d] | 0.6[f] | 5.0 | 1660 | |
| 11 | NH2: 8,10 | 731 | 1.9 | - | - | - | - | - | |
| 12 | NMe2: 8,10 | 724 | 4.6 | - | - | - | - | - | |
| 13 | CN: 5,13 | 682 | 8.2 | 731 | 1.0[d] | 0.7[f] | 14.3 | 1410 | |
| 14 | NHPr: 5 | 582 | 22.9 | 619 | 70[c] | 12.3 | 56.9 | 24.4 | |
| 15 | NHPr: 5, Br: 8,10 | 598 | 27.4 | 645 | 5.0[c] | 5.0[d] | 0.9[f] | 55.6 | 1060 |
kR=ϕ/τ.
kNR=(1- ϕ)/τ.
Relative to cresyl violet (MeOH, ϕfl = 54%).
Relative to oxazine 725 (EtOH, ϕfl = 11%).
Relative to sulforhodamine 101 (EtOH, ϕfl = 95%).
Fluorescence lifetimes measured by fluorescence upconversion technique. All the fluorescence decays were fitted as mono exponential functions. Lifetimes are given with an error of +/- 0.1 ns for the TCSPC data and +/- 0.3 ps for the upconversion data.
In terms of emission, helicene 3 displays a fluorescence covering the whole orange-red range with a maximal peak intensity at 658 nm. Dioxa 1 and azaoxa 2 present blue-shifted emission maxima centered at 595 and 614 nm, respectively. Considering their luminescence located around or beyond 600 nm, 1, 2 and 3 possess relatively high fluorescence quantum yields of 12, 22 and 31%, respectively (with cresyl violet as reference, see Table 2). It is worthy to underline that the introduction of N atom(s) within the cationic scaffold progressively red-shifts the emission band and enhances the fluorescence quantum yield. The corresponding lifetimes follow the same trend with relatively high values of 4.0, 6.8 and 9.8 ns for 1, 2 and 3, respectively. As shown in Table 2, the radiative rate constants calculated from the fluorescence quantum yields and lifetimes, are essentially the same for 1, 2 and 3, pointing to differences in internal conversion and/or intersystem-crossing efficiencies (vide infra). Interestingly, although 1 and 2 feature similar absorption maxima, their fluorescence spectra are not concomitant (excitation spectra are provided in Figures S9-S11).
The influence of different solvents on the optical properties of 1-3 was also investigated (9 solvents, see Tables S1-S3 and Figures S12-S20). Globally, the absorption and emission maxima of 1-3 exhibit only minor dependence on the selected solvent and the profiles, i.e., shape and intensity of the spectra did not change significantly. However a non-monotonic evolution of the optical properties is noticed regarding the wide range of different polarities, refractive indexes and viscosities of the solvents tested. Compounds 1-3 exhibit larger Stokes-shifts in DMSO than in any other solvents (946, 1653 and 1069 cm-1 for 1, 2 and 3 respectively). For 1, it was found that the helicene degraded during the measurements in THF, methanol and pentanol, which is unsurprising considering its lower chemical stability as depicted by the pKR+ value of 8.8 (vide supra). It is worth mentioning that 1-3 conserve a non-negligible fluorescence quantum yield in water (from 7% for 2 up to 10% for 3) which is of importance for possible uses as red bio-imaging probes.[5b,17]
Transient absorption and triplet quantum yields
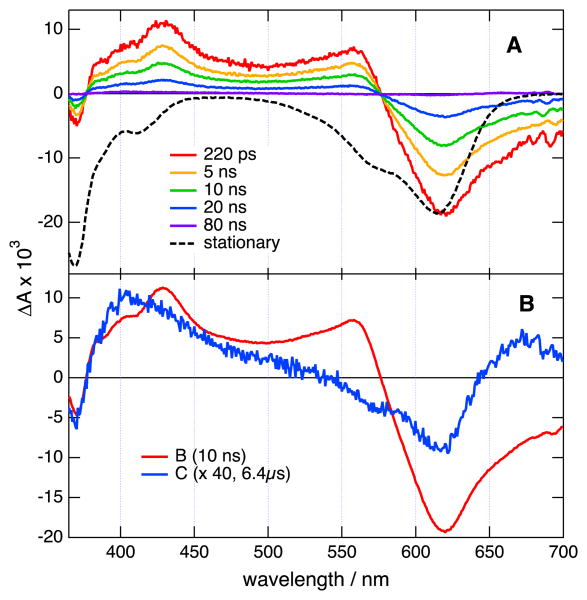
Transient absorption measurements were carried out in two temporal windows: 0-2 ns with 150 fs instrument response function[18] and 400 nm excitation (2 and 3, Figures S22 and S24) and 0-100 μs with 350 ps instrument response function and 355 nm excitation (1-3, Figures 5, S21 and S23).[19] The early transient spectra exhibit both negative and positive bands. The negative bands coincide with the stationary electronic spectra and can thus be attributed to both the bleach of the ground-state absorption and the stimulated S1→S0 emission. The positive bands can be ascribed to Sn←S1 absorption.
Figure 5.
A) Transient absorption spectra measured at several time delays after 355 nm excitation of 3 in acetonitrile and inverted stationary absorption spectrum (dashed). B) Species associated difference absorption spectra obtained from a global target analysis assuming a B→C→ scheme (the A→B corresponding to the equilibration of the S1 state occurs on the ps timescale (fig. S24).
Small spectral changes that are probably due to the dissipation of the excess excitation energy can be observed during the first few picoseconds (Figures S22 and S24). Afterward, the intensity of all spectral features decreases on the 5-10 ns timescale. This results in a spectrum with very small amplitude still containing the negative band due to the bleach of ground-state absorption and decaying on the microsecond timescale (Figures 5, S21 and S23). These transient spectra were analyzed globally assuming a series of successive exponential steps.[20] Three steps, i.e. an A→B→C→ scheme, had to be used to reproduce the 0-2 ns and 0-100 μs data. The first one associated with a picosecond time constant can be ascribed to the equilibration of the lowest singlet excited state. The time constant of the B→C step coincides with the fluorescence lifetime measured by time-correlated single photon counting (TCSPC) and, consequently, B can be interpreted as the S1 state. Finally, based on the fact that the C→D step occurs on the 10 μs timescale in N2 bubbled solutions and is faster in the presence of air, species C is assigned to the triplet state. By comparing the relative amplitude of the bleach in the spectra associated with species B and C, the triplet yields of 1-3 can be estimated to be smaller than 5%. One can thus conclude that the main deactivation pathways of the S1 state of 1-3 are fluorescence and internal conversion to the ground state.
Circularly polarized luminescence
As already mentioned, [6]helicenes 1-3 are chiral and can be isolated as single enantiomers via ion pairing strategies (eg, 3) or, more generally, via Chiral Stationary Phase (CSP) HPLC resolution.[1],[4] Strong chiroptical properties are recorded in the visible range of the light spectrum, as evidenced by the intense Cotton effects observed in the electronic circular dichroism spectra.[4] As such, it was deemed interesting to investigate their circularly polarized luminescence. The CPL spectra presented in Figure 6 have been recorded in dichloromethane and show opposite signals for (+) vs. (−) enantiomers of 1-3.
Figure 6.
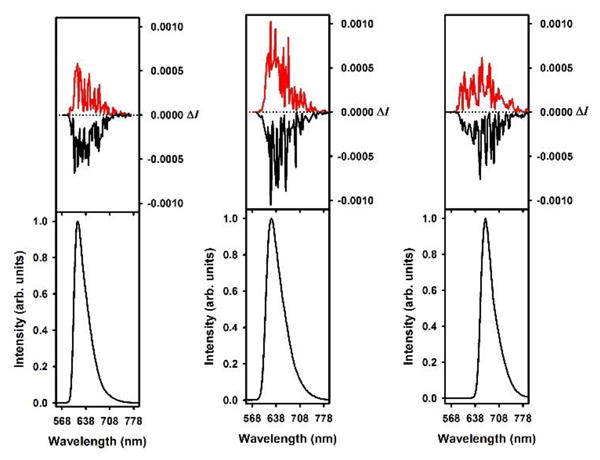
Circularly polarized luminescence (upper curve) and total luminescence (lower curve) spectra of (+) and (−)-1 (left), 2 (middle), and 3 (right) in 2 mM degassed dichloromethane solutions at 295 K, upon excitation at 435/435, 442/435, and 473/472 nm, respectively (black for (+) and red for (−)).
The glum values are estimated to −0.00032/+0.00041, −0.0021/+0.0020, and −0.0012/+0.0010 at the vicinity of the maximum emission wavelength for (+) and (−)-1, 2 and 3 respectively (i.e. 595, 614 and 658 nm respectively). Those values are in the same order of magnitude than that of other examples of organic CPL active helicenes.[5c,21] In a general fashion the CPL properties are only marginally influenced by the replacement of O atom(s) by more electron donating amino group(s) in 1 to 3. This points to the fact that the chiral structures are more or less equivalent in terms of generating similar CPL activities and the replacement did not affect the chiral properties at least from a CPL standpoint.
Tuning properties through chemical substitutions (4-15)
Absorption and fluorescence
Previously, the ability of cationic diaza [6]helicene 3 to react regioselectively with both electrophilic and nucleophilic reagents was evidenced.[1] Typically, in one step, substituents like NO2 (4), Cl (5), Br (6) and I (7) were introduced in positions 8 (and 10) while CN functional groups were added to positions 5 and 13 (helicene 13). Dibromo derivative 6 was furthermore engaged into palladium-catalyzed cross-coupling reactions yielding bis(phenyl) 8 and bis(ethynyl) 10 helicenes. Reduction of dinitro 4 provided the corresponding bis amino 11. Care was taken to prepare three new functionalized derivatives, namely bis(p-anisyl) 9, bis(dimethylamino) 12 and propylamino 14 (Figure 7).[22] The absorption and fluorescence properties of these compounds carrying electron-donating (EDG), electron-withdrawing (EWG) and possibly a combination of both types of groups were investigated. Selected spectra are presented in Figure 8. The results are compiled in Table 2.
Figure 8.

Selected absorption spectra (A), normalized fluorescence spectra (B) and normalized fluorescence decays (C) of post-functionalized [6]helicenes in acetonitrile.
The influence of the substitution pattern in positions 8 and 10 was first analyzed (4-12). The presence of strongly EWG such as nitro moieties induces very important blue-shifts of both absorption and emission spectra of the whole series compared to 3. Chromophore 4 possesses the lowest transition energy (560 nm, ε = 18200 M‐1 cm‐1) and is particularly fluorescent (ϕfl = 46%) at 591 nm. The effect of halogen atoms on the absorption properties is less pronounced: the lowest energy absorption bands are slightly red-shifted compared to 3 (Δλ = 6-16 nm) in the order Cl > Br > I and the extinction coefficients remain mostly unchanged, with the exception of the dibromo derivative 6 (ε = 10500 M‐1 cm‐1). However in this series, going from 5 to 7, a decrease of both the fluorescence quantum yields and lifetimes is noticed, this being attributed to heavy atom effects (vide infra).[23] Introduction of phenyl or phenylethynyl moieties (8 and 10) induces a red-shift of the absorption and emission bands, along with a decrease of the absorption molar extinction coefficient. The adjunction of electron donating methoxy groups on the aryl substituents (9) further enhances this red shift for both absorption and emission. From the smaller kR value of 8-10 and the larger Stokes shifts, it seems like the excited state has a substantial charge transfer (CT) character that increases by going from 8 to 9 and 10. In addition, an enhanced non-radiative de-excitation through the rotation of the aryl groups can be considered.
The introduction of strong EDG in the amino (11) and dimethylamino (12) derivatives induces larger bathochromic and hypochromic shifts of absorption spectra, along with a broadening of the bands. These compounds are however non-fluorescent, this being probably due to an intramolecular charge transfer along with a strong influence of the energy gap law that quench the fluorescence (see computational study below).[23] [24]
The effect of substitutions by EWG and EDG at positions 5 and/or 13 was also studied. The presence of EWG in positions 5,13 induces a bathochromic shift of the optical properties. Bis(cyano) derivative 13 exhibits a lower energy absorption band centered at 682 nm and a weak fluorescence in the far-red (λem = 731 nm, with ϕfl < 1%). Alternatively, EDG such as amino NHPr group in position 5 leads to hypsochromic and hyperchromic shifts in absorption, with 14 absorbing at 582 nm (ε = 27400 M‐1 cm‐1) and emitting at 619 nm with a remarkable quantum efficiency of 70%. To the best of our knowledge, this is the first time that such a strong fluorescence is measured for an organic helicene in the orange-red region.[5] The reverse influence of EWG and EDG in positions 8 and 10, or 5 and 13 is worth noticing. In fact, while EWG groups in positions 8 and 10 induce blue-shift of the optical properties, EDG in the same positions lead to red-shift. The opposite trend is evidenced in positions 5 and 13. Finally, [6]helicene 15 was investigated; this compound bearing both EWG bromo and EDG NHPr substituents at positions 8, 10 and 5 respectively. The comparison with 14 clearly indicates a moderate influence of the bromine atoms in terms of absorption (λabs = 598 vs. 582 nm, respectively) but a drastic lowering of the emission properties (ϕfl = 5% vs. 70%, respectively). The same trend is observed when comparing unsubstituted 3 with dibromo 6.
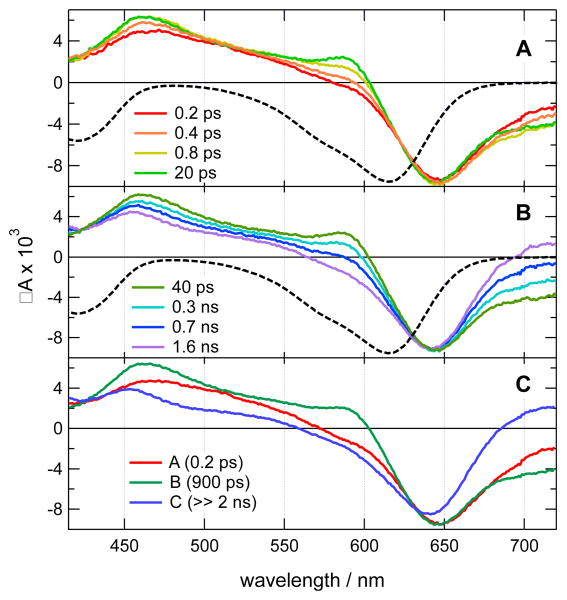
Transient absorption measurements in the 0-2 ns time window have been carried out with iodo derivative 7 (Figure 9AB). The early spectra are dominated by a negative band at 650 nm and a positive band peaking at 460 nm. The negative band is due to the bleach of the ground-state absorption and its red edge to stimulated emission. The positive band can be assigned to Sn←S1 absorption. The negative band is red shifted relative to the S1←S0 band, suggesting partial overlap of the excited-state absorption. During the first ps, the positive band changes its shape and acquires a shoulder around 600 nm and the red side of the negative band increases. Given the substantial amount of excess excitation energy, these effects can be assigned to the equilibration of the S1 state. Afterward, the transient spectra remain essentially unchanged up to about 100 ps and then evolve on the hundreds of ps timescale into a long-lived spectrum where the 600 nm shoulder and the stimulated emission are absent. These data could be reproduced assuming a A→B→C scheme with the first and second steps associated with a 0.2 and 900 ps time constant, respectively (Figure 9C). The short time constant agrees with the equilibration of the S1 state, whereas the second one is similar to the fluorescence lifetime. Given the small fluorescence quantum yield of 7 and the presence of the iodine substituent, the long-lived transient C is interpreted as the triplet state. As the absorption of both the S1 and T1 states partially overlaps with the bleach, a precise determination of the triplet quantum yield from the relative intensity of the bleach in the spectra associated with species B and C is difficult. However, assuming similar absorption of both S1 and T1 states in the overlapping region, the triplet quantum yield can be estimated to be of the order of 80-90%.
Figure 9.
(A,B) Transient absorption spectra recorded at various time delays after 400 nm excitation of 7 in acetonitrile and inverted stationary absorption spectrum (dashed). C) Species associated difference absorption spectra obtained from a global target analysis assuming an A→B→C→ scheme.
Rationalization through computational analysis
To obtain further insights into the nature of the electronic excited-states, we have performed first-principles calculations. They relied on an hybrid CC2/TD-DFT protocol that allows to obtain reliable 0-0 energies.[25] These energies can be directly compared to the crossing point between the absorption and emission spectra.[26] The results of this theoretical investigation are listed in Table 3. As can be seen, the agreement between the CC2/TD-DFT values and experiment is very satisfying with an average absolute deviation as small as 12 nm. The uncorrected TD-DFT approach nicely restores the auxochromic trends but delivers too small wavelengths. Experimentally, both 11 and 12 were found to be non-fluorescent, and this can be understood from the calculations. Indeed, the computed CC2 emission energies for these two compounds are 1416 and 1446 nm, indicating a very strong relaxation at the excited-state. Such wavelengths correspond to a gap lower than 1 eV, which is clearly not favorable for the emission according to the energy gap law.
Table 3.
Comparison between experimental and theoretical 0-0 energies for the treated dyes. Note that during the theoretical calculations the alkyl chains have been substituted by methyl groups. All values are in nm.
| Compound | Exp. | Theory (CC2/TD-DFT) | Theory (TD-DFT) |
|---|---|---|---|
| 1 | 578 | 574 | 493 |
| 2 | 589 | 592 | 507 |
| 3 | 635 | 634 | 535 |
| 4 | 577 | 569 | 490 |
| 11[a] | 731 | 738 | 634 |
| 12[a] | 724 | 748 | 610 |
| 13 | 708 | 730 | 600 |
| 14 | 599 | 595 | 513 |
Experimental λmax and theoretical vertical absorption.
Experimentally, it was found that strong EWG induces hypsochromic/bathochromic shifts when located on position 8,10/5,13 whereas EDG groups yield the opposite trend. As TD-DFT revealed that the lowest energy transitions present a strongly dominant HOMO-LUMO contribution, we have plotted these orbitals in Figure 10 for compound 3. As can be seen the HOMO presents significant density at positions 8 and 10, meaning that the addition of an EWG (EDG) stabilizes (unstabilizes) its energy and hence increases (decreases) the gap as the LUMO is almost unaffected. In contrast, the LUMO displays significant contributions at 5 and 13 positions, so that adding a EWG (EDG) stabilizes (unstabilizes) its energy and hence decreases (increases) the gap. By playing with these positions, one can therefore tune (almost) independently the levels of the two frontier orbitals. This perfectly fits the measured evolutions.
Figure 10.
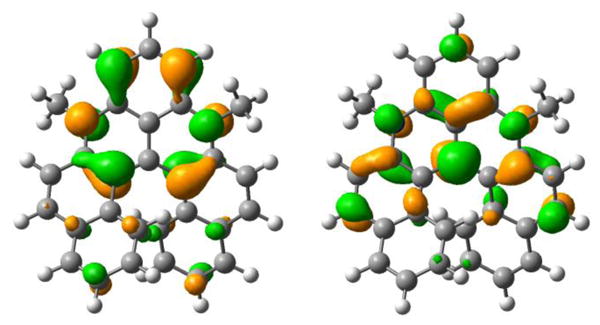
HOMO (left) and LUMO (right) of 3.
The computed and convoluted absorption lineshapes are represented in Figure 11 for compounds 1-3. As in the experimental spectra, 1 does not exhibit a clear-cut broadening feature while both 2 and 3 present a shoulder. Interestingly, the relative intensities for 1 and 3 are highly similar while the intensity of 2 is lower by 24 %; a fact also observed in the experimental data (decrease of the extinction coefficient of 27 %).
Figure 11.
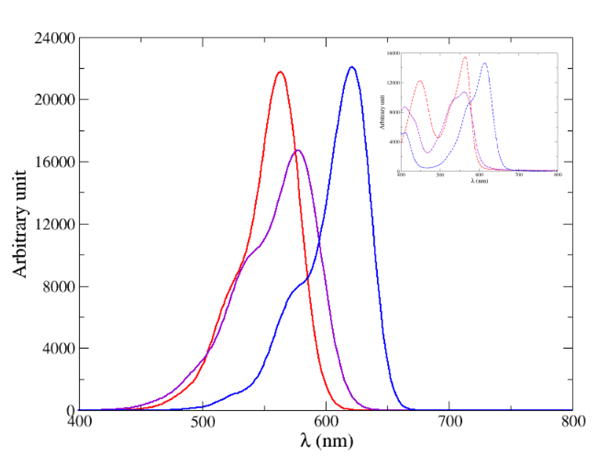
Computed vibronic absorption spectrum of 1 (red), 2 (purple) and 3 (blue). For their convolution, a HWHM of 0.06 eV was employed for 1 and 2 while a HWHM of 0.04 eV was set for 3. The inset represents the experimental data.
To gain further insights into the origins of specific band shapes, we identified the key vibronic contributions for the three dyes. Figure S25 in the ESI shows the normalized experimental and theoretical absorption and fluorescence lineshapes together with the stick vibronic contributions. Overall a good agreement between theory and experiment is observed for both positions and bandshapes. Nevertheless, the position of the maximum bands in the absorption spectra are red-shifted for 2 and 3 while it is slightly blue-shifted for 1. The computed fluorescence spectra are systematically blue-shifted. We observe a significant difference in bandshapes that is due to the substitution of oxygen by N-CH3. Table S4 and Figure S26 in the ESI list the key vibrational modes explaining band broadening and the presence of shoulders. In 1, the maximum band involves, beyond the 0-0 transition, three intense vibronic couplings related to the low-frequency vibrations of the naphthalene subunits with scissoring/bending (mode 3) and distortions involving C-C twisting and rocking vibrations (mode 8 and 11). In addition, the small shoulder observed in the spectra mainly arises from the contribution of the high-frequency C-C asymmetric stretching (breathing) mode of the entire structure (mode 91 in Table S4). Replacing one oxygen atom by a N-CH3 moiety modifies the vibronic contributions of the main band due to the introduction of a certain asymmetry of the molecule inducing three vibronic contributions with equivalent intensity (0.34). Each of these mode includes the rocking of the naphthalene located on the N-CH3-substituted ring (Na(N)) while the rest of the conjugated molecules undergoes a wagging (mode 1) or a twisting (mode 5 and 14) vibration. Similarly to 1, a high-frequency mode corresponding to the breathing of the structure is responsible for the shoulder. The vibronic modes of 3 are highly similar to 2, more particularly modes 1, 5, 40 and 105 of 3 corresponds to mode 1, 5, 14 and 98 of 2 (see the ESI). Nevertheless, two supplementary modes appears, i.e., the CH3 rotation (mode 12) and the asymmetric C-C stretching of the conjugated moiety between the N-CH3 substituted rings (mode 119). Mode 105 and 119 combine to give the shoulder.
Conclusions
Chemical stability, electrochemical and optical properties of a series of cationic hetero [6]helicenes have been studied to reveal a drastic influence (i) of the heteroatoms within the helical core and (ii) of auxochrome substituents introduced at the periphery. In fact, an increasing chemical stability is evidenced for cationic dioxa 1, azaoxa 2 and diaza 3 [6]helicenes through the measurement of (large) pKR+ values of 8.8, 15.2 and 20.4 respectively. Clearly the replacement of the O atom(s) by more electron donating amino group(s) going from dioxa (1) to diaza (3) is beneficial for the chemical stability. The same trend is observed by electrochemistry where the reduction and oxidation potentials of the cations are substantially lowered from 1 to 3 (i.e., from −0.12 to −0.72 V for the ). In terms of optical properties, the influence the internal atom(s) substitution (O→N) is again prominent inducing a bathochromic shift in absorption and emission from 1 to 3. Interestingly, both quantum yields (12, 22 and 31% for 1, 2 and 3) and fluorescence lifetimes (4.0, 6.8 and 9.8 ns for 1, 2 and 3) increase in this order. Moreover, those fluorophores exhibit only marginal solvatochromism (absorption and emission). Transient absorption measurements indicate that the first singlet excited state of 1, 2 and 3 decay mostly via fluorescence and internal conversion to the ground state, intersystem-crossing being much less efficient, with a triplet quantum yield smaller than 5%. However, upon substitution with a heavy atom, such as iodine, intersystem crossing to the triplet state becomes the dominant decay pathway. Isolated as single enantiomers, 1-3 emit circularly polarized light, the most efficient CPL emitter being the non-symmetrical azaoxa 2 (glum −0.0021/+0.0020). Further tuning of the electronic properties was achieved through the addition of electron-donating or electron-withdrawing substituents at the periphery of 3. Highly efficient luminophores (ϕfl up to 70%) or far-red absorbers (λmax up to 730 nm) are now accessible. Interestingly, the influence of EWG in positions 8 and 10 is opposite to that in positions 5 and 13 (blue shift vs. red shift) and vice versa for EDG. This was rationalized through computational studies revealing significant differences in the topology of the frontier orbitals. Applications in several fields of chemistry can be foreseen, from bio-imaging to polarized emitting devices.[17,27]
Supplementary Material
Acknowledgments
We thank the University of Geneva, the Swiss National Science Foundation and the NCCR chemical biology funded by the Swiss National Science Foundation. We also acknowledge the contributions of the Sciences Mass Spectrometry (SMS) platform at the Faculty of Sciences, University of Geneva. H. L. acknowledges the China Scholarship Council for his PhD fellowship. D. J. acknowledges the European Research Council (ERC) and the Région des Pays de la Loire for financial support in the framework of a starting grant (Marches-278845) and the LumoMat project, respectively. This research used the resources of (1) the GENCI- CINES/IDRIS, (2) CCIPL (Centre de Calcul Intensif des Pays de Loire), and (3) a local Troy cluster. G. M. thanks the NIH, Minority Biomedical Research Support (grant 1 SC3 GM089589-07) and the Henry Dreyfus Teacher-Scholar Award for financial support, whereas R. C. T. thanks the SJSU RISE program (NIH grant 5R25GM71381) for a research fellowship.
Footnotes
Supporting information for this article is given via a link at the end of the document.
References
- 1.Torricelli F, Bosson J, Besnard C, Chekini M, Bürgi T, Lacour J. Angew Chem Int Ed. 2013;52:1796–1800. doi: 10.1002/anie.201208926. [DOI] [PubMed] [Google Scholar]
- 2.a) Shen Y, Chen CF. Chem Rev. 2011;112:1463–1535. doi: 10.1021/cr200087r. [DOI] [PubMed] [Google Scholar]; b) Gingras M. Chem Soc Rev. 2013;42:968–1006. doi: 10.1039/c2cs35154d. [DOI] [PubMed] [Google Scholar]; c) Gingras M, Felix G, Peresutti R. Chem Soc Rev. 2013;42:1007–1050. doi: 10.1039/c2cs35111k. [DOI] [PubMed] [Google Scholar]; d) Gingras M. Chem Soc Rev. 2013;42:1051–1095. doi: 10.1039/c2cs35134j. [DOI] [PubMed] [Google Scholar]; e) Urbano A. Angew Chem Int Ed. 2003;42:3986–3989. doi: 10.1002/anie.200301667. [DOI] [PubMed] [Google Scholar]; f) Hoffmann N. J Photochem Photobiol C: Photochem Rev. 2014;19:1–19. [Google Scholar]; g) Rajca A, Miyasaka M. In: Functional Organic Materials. Müller TJJ, Bunz UHF, editors. Wiley-VCH; Weinheim: 2007. pp. 543–577. [Google Scholar]; h) Stará IG, Starý I. In: Science of Synthesis. Siegel JS, Tobe Y, editors. Vol. 45. Thieme; Stuttgart: 2010. pp. 885–953. [Google Scholar]; i) Dumitrascu F, Dumitrascu DG, Aaron I. Arkivoc. 2010:1–32. [Google Scholar]; j) Narcis MJ, Takenaka N. Eur J Org Chem. 2014;2014:21–34. [Google Scholar]; k) Bosson J, Gouin J, Lacour J. Chem Soc Rev. 2014;43:2824–2840. doi: 10.1039/c3cs60461f. [DOI] [PubMed] [Google Scholar]
- 3.All along this report, the BF4- anionic counterions that are present to balance the positive charges are omitted for clarity reasons. The influence of the side chains is not investigated.
- 4.Labrador GM, Bosson J, Breitbach ZS, Lim Y, Francotte ER, Sabia R, Villani C, Armstrong DW, Lacour J. Chirality. 2016;28:282–289. doi: 10.1002/chir.22579. [DOI] [PubMed] [Google Scholar]
- 5.a) Kel O, Sherin P, Mehanna N, Laleu B, Lacour J, Vauthey E. Photochem Photobiol Sci. 2012;11:623–631. doi: 10.1039/c2pp05361f. [DOI] [PubMed] [Google Scholar]; b) Li M, Niu Y, Zhu X, Peng Q, Lu HY, Xia A, Chen CF. Chem Commun. 2014;50:2993–2995. doi: 10.1039/c3cc49680e. [DOI] [PubMed] [Google Scholar]; c) Sawada Y, Furumi S, Takai A, Takeuchi M, Noguchi K, Tanaka K. J Am Chem Soc. 2012;134:4080–4083. doi: 10.1021/ja300278e. [DOI] [PubMed] [Google Scholar]; d) Sakai H, Shinto S, Araki Y, Wada T, Sakanoue T, Takenobu T, Hasobe T. Chem Eur J. 2014;20:10099–10109. doi: 10.1002/chem.201402426. [DOI] [PubMed] [Google Scholar]; e) Oyama H, Nakano K, Harada T, Kuroda R, Naito M, Nobusawa K, Nozaki K. Org Lett. 2013;15:2104–2107. doi: 10.1021/ol4005036. [DOI] [PubMed] [Google Scholar]; f) Matsuno T, Koyama Y, Hiroto S, Kumar J, Kawai T, Shinokubo H. Chem Commun. 2015 doi: 10.1039/c5cc00764j. [DOI] [PubMed] [Google Scholar]; g) Delgado IH, Pascal S, Wallabregue A, Duwald R, Besnard C, Guenee L, Nancoz C, Vauthey E, Tovar RC, Lunkley JL, Muller G, Lacour J. Chem Sci. 2016;7:4685–4693. doi: 10.1039/c6sc00614k. [DOI] [PMC free article] [PubMed] [Google Scholar]
- 6.a) Nair V, Thomas S, Mathew SC, Abhilash KG. Tetrahedron. 2006;62:6731–6747. [Google Scholar]; b) Duxbury DF. Chem Rev. 1993;93:381–433. [Google Scholar]
- 7.This type of reactivity with NaOH corresponds to a nucleophilic attack rather than a Brønsted acid-base reaction as observed with azahelicenes for instance. See Vacek Chocholoušová J, Vacek J, Andronova A, Míšek J, Songis O, Šámal M, Stará IG, Meyer M, Bourdillon M, Pospíšil L, Starý I. Chem Eur J. 2014;20:877–893. doi: 10.1002/chem.201204410.
- 8.Laursen BW, Krebs FC. Chem Eur J. 2001;7:1773–1783. doi: 10.1002/1521-3765(20010417)7:8<1773::aid-chem17730>3.0.co;2-f. [DOI] [PubMed] [Google Scholar]
- 9.Laursen BW, Krebs FC. Angew Chem Int Ed. 2000;39:3432–3434. doi: 10.1002/1521-3773(20001002)39:19<3432::aid-anie3432>3.0.co;2-s. [DOI] [PubMed] [Google Scholar]
- 10.For 1, 2 and 3, the R2 coefficients of determination are 0.9925, 0.9989 and 0.9891 respectively. Upon immediate acidification after measurements, the absorption spectra of the carbenium species are recovered.
- 11.The slope of the trendlines being different from unity, competitive reactions could not be ruled out. See Supporting Information.
- 12.a) Herse C, Bas D, Krebs FC, Buergi T, Weber J, Wesolowski T, Laursen BW, Lacour J. Angew Chem, Int Ed. 2003;42:3162–3166. doi: 10.1002/anie.200351443. [DOI] [PubMed] [Google Scholar]; b) Sørensen TJ, Nielsen MF, Laursen BW. ChemPlusChem. 2014;79:1030–1035. [Google Scholar]; c) Sørensen TJ, Madsen AØ, Laursen BW. Chem Eur J. 2014;20:6391–6400. doi: 10.1002/chem.201400082. [DOI] [PubMed] [Google Scholar]; d) Gouin J, Bürgi T, Guénée L, Lacour J. Org Lett. 2014;16:3800–3803. doi: 10.1021/ol501692r. [DOI] [PubMed] [Google Scholar]; e) Guin J, Besnard C, Lacour J. Org Lett. 2010;12:1748–1751. doi: 10.1021/ol1003466. [DOI] [PubMed] [Google Scholar]; f) Sørensen TJ, Madsen AØ, Laursen BW. Tetrahedron Lett. 2013;54:587–590. [Google Scholar]
- 13.Repetitive cleaning and polishing of the electrode surface is mandatory to record accurate and reproducible CVs as these compounds have a strong tendency to adsorb at the surface of the working electrode.
- 14.Adam C, Wallabregue A, Li H, Gouin J, Vanel R, Grass S, Bosson J, Bouffier L, Lacour J, Sojic N. Chem Eur J. 2015;21:19243–19249. doi: 10.1002/chem.201501738. [DOI] [PubMed] [Google Scholar]
- 15.a) Janietz S, Bradley DDC, Grell M, Giebeler C, Inbasekaran M, Woo EP. Appl Phys Lett. 1998;73:2453–2455. [Google Scholar]; b) Bredas JL. Mater Horiz. 2014;1:17–19. [Google Scholar]
- 16.As already mentioned, the oxidation process is almost completely irreversible for 1 and 2 and the calculated fundamental gaps are just approximated values for these 2 compounds. Yet, the trend observed with the lower values calculated from the CV curves for 3 in comparison to 1 and 2 correlates with the optical gap (Table 1). Thus it validates the approximation used for the calculation of the fundamental gap.
- 17.Kel O, Fürstenberg A, Mehanna N, Nicolas C, Laleu B, Hammarson M, Albinsson B, Lacour J, Vauthey E. Chem Eur J. 2013;19:7173–7180. doi: 10.1002/chem.201203915. [DOI] [PubMed] [Google Scholar]
- 18.Banerji N, Duvanel G, Perez-Velasco A, Maity S, Sakai N, Matile S, Vauthey E. J Phys Chem A. 2009;113:8202–8212. doi: 10.1021/jp903572r. [DOI] [PubMed] [Google Scholar]
- 19.Lang B, Mosquera-Vázquez S, Lovy D, Sherin P, Markovic V, Vauthey E. Rev Sci Instrum. 2013;84:073107. doi: 10.1063/1.4812705. [DOI] [PubMed] [Google Scholar]
- 20.van Stokkum IHM, Larsen DS, van Grondelle R. Biochim Biophys Acta, Bioenerg. 2004;1657:82–104. doi: 10.1016/j.bbabio.2004.04.011. [DOI] [PubMed] [Google Scholar]
- 21.a) Phillips KES, Katz TJ, Jockusch S, Lovinger AJ, Turro NJ. J Am Chem Soc. 2001;123:11899–11907. doi: 10.1021/ja011706b. [DOI] [PubMed] [Google Scholar]; b) Field JE, Muller G, Riehl JP, Venkataraman D. J Am Chem Soc. 2003;125:11808–11809. doi: 10.1021/ja035626e. [DOI] [PubMed] [Google Scholar]; c) Hassey R, Swain EJ, Hammer NI, Venkataraman D, Barnes MD. Science. 2006;314:1437–1439. doi: 10.1126/science.1134231. [DOI] [PubMed] [Google Scholar]; d) Kaseyama T, Furumi S, Zhang X, Tanaka K, Takeuchi M. Angew Chem Int Ed. 2011;50:3684–3687. doi: 10.1002/anie.201007849. [DOI] [PubMed] [Google Scholar]; e) Nakamura K, Furumi S, Takeuchi M, Shibuya T, Tanaka K. J Am Chem Soc. 2014;136:5555–5558. doi: 10.1021/ja500841f. [DOI] [PubMed] [Google Scholar]; f) Shen C, Anger E, Srebro M, Vanthuyne N, Deol KK, Jefferson TD, Muller G, Williams JAG, Toupet L, Roussel C, Autschbach J, Reau R, Crassous J. Chem Sci. 2014;5:1915–1927. doi: 10.1039/C3SC53442A. [DOI] [PMC free article] [PubMed] [Google Scholar]; g) Saleh N, Moore B, Srebro M, Vanthuyne N, Toupet L, Williams JAG, Roussel C, Deol KK, Muller G, Autschbach J, Crassous J. Chem Eur J. 2015;21:1673–1681. doi: 10.1002/chem.201405176. [DOI] [PMC free article] [PubMed] [Google Scholar]; h) Saleh N, Srebro M, Reynaldo T, Vanthuyne N, Toupet L, Chang VY, Muller G, Williams JAG, Roussel C, Autschbach J, Crassous J. Chem Commun. 2015;51:3754–3757. doi: 10.1039/c5cc00453e. [DOI] [PMC free article] [PubMed] [Google Scholar]; i) Pascal S, Besnard C, Zinna F, Di Bari L, Le Guennic B, Jacquemin D, Lacour J. Org Biomol Chem. 2016;14:4590–4594. doi: 10.1039/c6ob00752j. [DOI] [PubMed] [Google Scholar]
- 22.See Schemes S1-S6 and details in the Electronic Supplementary Information.
- 23.Valeur B. Molecular Fluorescence. Wiley-VCH Verlag GmbH; 2001. pp. 34–71. [Google Scholar]
- 24.Englman R, Jortner J. Mol Phys. 1970;18:145–164. [Google Scholar]
- 25.Jacquemin D, Duchemin I, Blase X. J Chem Theory Comput. 2015;11:5340–5359. doi: 10.1021/acs.jctc.5b00619. [DOI] [PMC free article] [PubMed] [Google Scholar]
- 26.a) Jacquemin D, Planchat A, Adamo C, Mennucci B. J Chem Theory Comput. 2012;8:2359–2372. doi: 10.1021/ct300326f. [DOI] [PubMed] [Google Scholar]; b) Goerigk L, Grimme S. J Chem Phys. 2010;132:184103. [Google Scholar]
- 27.a) Reetz MT, Sostmann S. Tetrahedron. 2001;57:2515–2520. [Google Scholar]; b) Honzawa S, Okubo H, Anzai S, Yamaguchi M, Tsumoto K, Kumagai I. Bioorg Med Chem. 2002;10:3213–3218. doi: 10.1016/s0968-0896(02)00175-x. [DOI] [PubMed] [Google Scholar]; c) Xu Y, Zhang YX, Sugiyama H, Umano T, Osuga H, Tanaka K. J Am Chem Soc. 2004;126:6566–6567. doi: 10.1021/ja0499748. [DOI] [PubMed] [Google Scholar]; d) Passeri R, Gaetano Aloisi G, Elisei F, Latterini L, Caronna T, Fontana F, Natali Sora I. Photochem Photobiol Sci. 2009;8:1574–1582. doi: 10.1039/b9pp00015a. [DOI] [PubMed] [Google Scholar]; e) Latterini L, Galletti E, Passeri R, Barbafina A, Urbanelli L, Emiliani C, Elisei F, Fontana F, Mele A, Caronna T. J Photochem Photobiol, A. 2011;222:307–313. [Google Scholar]; f) Rajapakse A, Gates KS. J Org Chem. 2012;77:3531–3537. doi: 10.1021/jo3004748. [DOI] [PMC free article] [PubMed] [Google Scholar]; g) Hu Y, Wex B, Perkovic MW, Neckers DC. Tetrahedron. 2008;64:2251–2258. [Google Scholar]; h) Shi L, Liu Z, Dong G, Duan L, Qiu Y, Jia J, Guo W, Zhao D, Cui D, Tao X. Chem Eur J. 2012;18:8092–8099. doi: 10.1002/chem.201200068. [DOI] [PubMed] [Google Scholar]; i) Reyes-Gutierrez PE, Jirasek M, Severa L, Novotna P, Koval D, Sazelova P, Vavra J, Meyer A, Cisarova I, Saman D, Pohl R, Stepanek P, Slavicek P, Coe BJ, Hajek M, Kasicka V, Urbanova M, Teply F. Chem Commun. 2015;51:1583–1586. doi: 10.1039/c4cc08967g. [DOI] [PubMed] [Google Scholar]; j) Wallabregue A, Sherin P, Guin J, Besnard C, Vauthey E, Lacour J. Eur J Org Chem. 2014;2014:6431–6438. [Google Scholar]
Associated Data
This section collects any data citations, data availability statements, or supplementary materials included in this article.


