Abstract
MicroRNAs (miRNAs) regulate the expression of protein-coding genes and represent potential biomarkers for childhood acute lymphoblastic leukemia (ALL). However, information linking miRNAs with their messenger RNA (mRNA) target genes modulating white blood cell (WBC) count is lacking. Here, we analyzed miRNAs and gene expression data from pediatric patients with ALL to identify a signature of miRNAs involved in ALL and their mRNA target genes, molecular networks, and biological pathways modulating WBC. We discovered a signature of miRNAs differentially expressed in ALL and a signature of mRNA target genes distinguishing patients with high WBC from patients with low WBC. In addition, we identified molecular networks and biological pathways, among them PI3/AKT, JAK/STAT, IL-17, TGF-β, apoptosis, IL-15, STAT3, IGF-1, FGF, mTOR, VEGF, NF-kB, and P53 signaling pathways, enriched for or targeted by miRNAs. The discovered miRNAs and their target genes and pathways represent potential clinically actionable biomarkers and therapeutic targets.
Keywords: White blood cell count, miRNA, gene expression, leukemia
Introduction
Acute lymphoblastic leukemia (ALL) is the most common childhood cancer and the leading cause of cancer-related death in children in the United States.1,2 Current treatment regimens result in 5-year event-free survival rates that exceed 90% in children (aged 1-21).3–6 These therapeutic advances have been achieved through the progressive intensification of chemotherapy and the development of risk classification schemes that target children to more intensive therapies based on their relative relapse risk.3–6 Current risk classification protocols incorporate pretreatment clinical characteristics which include white blood cell (WBC) count, age, sex, and the presence of extramedullary disease, the presence or absence of recurring cytogenetic abnormalities, and measures of minimal residual disease at the end of induction therapy.6,7 This risk stratification allows tailoring therapy to individual patients. Historically, WBC at diagnosis has been one of the strongest independent predictors of induction failure, resistant disease, and risk of relapse in pediatric ALL and has accordingly been used for patient stratification to guide treatment options.8 However, the molecular mechanisms modulating low or high WBC are poorly understood. As a consequence, current risk stratification protocols do not include molecular information.
Advances in microarray technology have enabled the use of gene expression profiling to improve molecular and risk classification of pediatric ALL.6,7,9,10 Gene expression profiling has also enabled prediction of clinical outcomes.9,10 However, despite these innovative refinements, significant challenges remain. First-time induction therapy fails in approximately 20% of pediatric cases,11 and 20% to 30% of children who undergo treatment for ALL experience a relapse in disease.12 Moreover, current chemotherapy treatment regimens are neurotoxic and have the potential to impair patient’s short-term and long-term quality of life.13 In clinical practice, WBC is one of the strongest predictors of induction failure and relapse.8 Thus, discovery of the molecular markers modulating WBC could potentially have significant impact on predicting disease prognosis, stratifying patients and guiding treatment decisions in pediatric ALL.
Recently, a new class of biomarkers called microRNAs (miRNAs) have come into research focus in pediatric ALL.14–19 MicroRNAs control the expression of protein-coding genes20 and represent potential clinically actionable biomarkers.19 For example, the expression of certain miRNAs has been shown to be correlated with prognosis,21 drug resistance,22 and predictors of relapse in pediatric ALL.23 Several studies have reported integrative analysis of miRNA and gene expression data in pediatric ALL.20,24 Hezaveh et al20 investigated alterations of miRNA and miRNA-regulated mRNA expression in germinal center B-cell lymphomas. Mesrian Tanha et al24 conducted an integrative computational in-depth analysis of dysregulated miRNA-mRNA interactions in drug-resistant pediatric ALL cells in an attempt to identify miRNA-mediated gene pathways modulating response to treatment. Overall, accumulating evidence from the literature indicates that miRNAs play an important role in the pathogenesis of childhood ALL17–22 by functioning as tumor suppressors, oncogenes, or both.25 However, to date, there is little information linking miRNAs to their mRNA target genes and biological pathways to modulating WBC.
The objective of this exploratory study was to identify a signature of miRNAs differentially expressed in pediatric ALL and a signature of their mRNA target genes distinguishing pediatric patients diagnosed with high WBC from patients with low WBC. A second, but equally important objective was to identify potential miRNA-mediated molecular networks and biological pathways dysregulated in response to increased WBC. We addressed these objectives using 2 publicly available miRNA and gene expression data sets.
Materials and Methods
MiRNA expression data
We used publicly available miRNA expression data from pediatric patients diagnosed with ALL and controls.22 The data were downloaded from the National Center for Biomedical Informatics (NCBI) Gene Expression Omnibus (GEO) accession number GSE23024.22 The methods for experimental protocols and data processing have been previously described by the data originators.22 Briefly, the data set consisted of a total of 98 peripheral blood or bone marrow samples distributed as follows: patients diagnosed with leukemia (N = 81) and controls (N = 17). For sample preparation, mononuclear cells were isolated from peripheral blood or bone marrow samples using sucrose density centrifugation.26,27 The percentage of leukemic cells was determined using May-Grünwald Giemsa–stained (Merck, Darmstadt, Germany) cytospins. If the percentage of leukemic cells was below 90%, samples were enriched by eliminating nonmalignant cells with immunomagnetic beads as described in the work by Den Boer et al26 and Stam et al.27 Samples were collected with informed consent from parents or guardians with local institutional review board approval. The immunophenotype and genetic subtype were determined by routine diagnostic procedures, including flow cytometry for lineage detection (T-cell ALL [T-ALL] or precursor B-cell ALL [B-ALL]), fluorescence in situ hybridization (FISH), and reverse transcription polymerase chain reaction for genetic subtype and conventional karyotyping to determine the ploidy status of ALL cases. The distribution of leukemia samples was as follows: MLL (N = 10), TELAML1 (N = 14), BCR-ABL (N = 10), E2A-PBX1 (N = 9), hyperdiploid (N = 13) and “other” B-ALL (negative for the 5 previously listed genetic abnormalities; N = 14) and T-ALL (N = 11). These cases were retrospectively selected based on the availability of material and the patients were treated with different protocols. The BCR-ABL samples were excluded as the BCR-ABL subtype has a different course of treatment compared with the others. In addition, the T-ALL samples were also excluded because it is not a subtype of B-ALL. These exclusions resulted in a data set of 60 ALL patient samples and 17 control samples used for analysis in this study. MicroRNA expression data did not include information on WBC as clinical information was not available. MicroRNA expression data were normalized and transformed to log2.
Gene expression data
We used publicly available gene expression data downloaded from the GEO accession number GSE11877.6,7 The details about sample processing and experimental protocol have been provided by the data originators.6,7 Here, we provide a brief but detailed description of the data used in this study. The patient samples and clinical information were obtained from the Children’s Oncology Group (COG) Clinical Trial P9906 involving 272 eligible high-risk B-precursor ALL patients enrolled between March 15, 2000, and April 25, 2003. All patients were treated uniformly with a modified augmented Berlin-Frankfurt-Münster Study Group (BFM) regimen6,7 which was also used for treating patients used to generate miRNA data.22
This trial targeted a subset of newly diagnosed high-risk ALL patients, which historically have experienced a poor outcome (44% relapse-free survival at 4 years) in prior studies.6,7 Patients with central nervous system disease or testicular leukemia were eligible for the trial, regardless of age or WBC count at diagnosis. Patients with very high-risk features (BCR-ABL1 or hypodiploidy) were excluded, whereas those with low-risk features (trisomies of chromosome 4 or 10; t(12;21) [ETV6-RUNX1]) were included unless they had central nervous system disease or testicular leukemia. Specifically, for this study, previously cryopreserved residual pretreatment leukemia specimens were available on a representative cohort of 207 with gene expression data. Of the 207 ALL patients evaluated, 108 patients had high WBC, whereas 99 had low WBC. The gene expression data set contained 54 674 probes. The data were processed using the Affymetrix Human Genome U133 Plus 2.0 Array chip using standard Affymetrix protocol. The probes from the U133 Plus 2.0 chip were mapped to gene names using the batch query as implemented in the Affymetrix NetAffx database to obtain the gene symbols matching the probes. The gene expression data set was not generated on the same population samples as miRNA data. However, both data sets were derived from pediatric patients and used similar diagnostic and treatment protocols. Currently, miRNA expression data from these samples are not available. Gene expression data were normalized and transformed to log2.
Data Analysis
The overall design and data analysis workflow are presented in Figure 1. First, we performed analysis comparing expression levels of the 365 miRNAs between 60 ALL patients and 17 control samples. The goal here was to identify a signature of miRNAs which are involved in pediatric ALL. Significant differences in miRNA expression levels between patients with ALL and controls were determined using a permutation t test as implemented in the software package Pomelo II.28 We used the false discovery rate (FDR) procedure to correct for multiple hypothesis testing.29 A P value (P < .05) was used as evidence of significant difference in expression between the 2 sample groups. The miRNAs were ranked on P values and FDR, and significantly differentially expressed miRNAs were selected.
Figure 1.
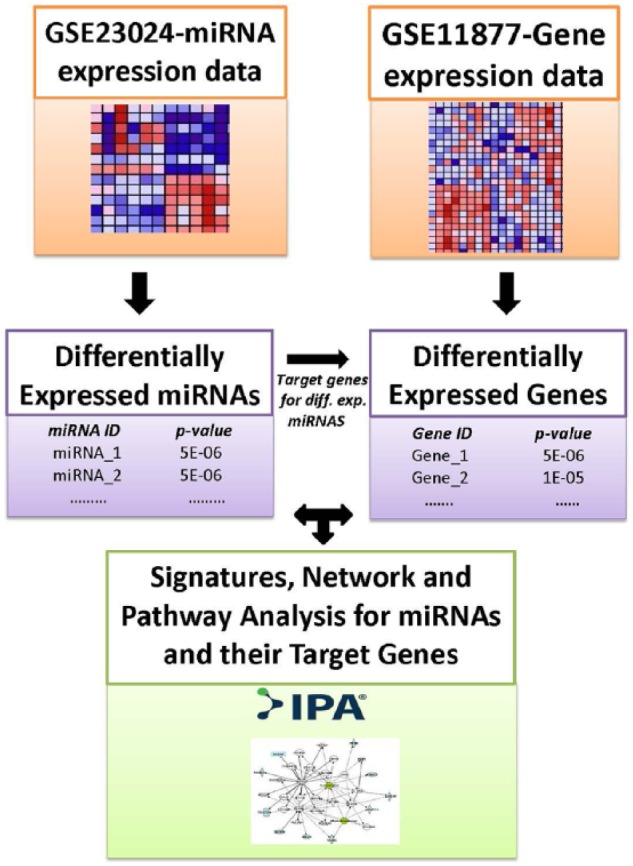
The workflow showing the design and analysis steps performed on microRNA (miRNA) and gene expression data to identify differentially expressed miRNAs and their messenger RNA target genes, molecular networks, and biological pathways dysregulated in patients with high and low white blood cell count in childhood acute lymphoblastic leukemia.
Next, we performed whole-genome analysis comparing expression levels of the genes between the 108 ALL patients with high WBC and the 99 patients with low WBC. The goal was to identify all significantly differentially expressed genes between the 2 patient groups and to use this information to identify all putative mRNA targets for each of the significant miRNAs and to assess the potential effects of miRNAs on mRNA data. A secondary but equally important goal was to identify differentially expressed nontarget genes. The rationale was that as the number of miRNAs was small, focusing only on target genes could miss important information.
Significant differences in expression levels between patients with high WBC and low WBC were determined using a permutation t test as implemented in the software package Pomelo II.28 We used the FDR procedure to correct for multiple hypothesis testing.29 A P value (P < .05) was used as evidence of significant differences in gene expression levels between the 2 patient groups. The genes were ranked on P values and FDR, and significantly differentially expressed genes were selected.
For both miRNA and gene expression data, we used the leave-one-out cross-validation procedure as our prediction and validation model to identify miRNAs and genes with predictive power.30 This approach has been used successfully in gene expression data analysis with limited sample size and data sets to eliminate bias and for validation.30
We performed enrichment analysis using Ingenuity Pathway Analysis (IPA)31 package using the miRNA-mRNA target link module to link the discovered significantly differentially expressed miRNAs with their mRNA target genes. After linking the miRNAs with their mRNA target genes, we filtered out the mRNA target genes which were not significantly differentially expressed between patients with high WBC and patients with low WBC. The IPA miRNA-mRNA target link module derives information from TargetScan,32 a database containing miRNAs and their predicted target genes, along with prediction scores and the experimental conformation from the literature. Because IPA does not include prediction scores, to validate the miRNA target genes, we performed additional computational analysis using TargetScan to identify target genes with good predicted scores. In addition, we used IPA to identify miRNA-mRNA target genes which have been experimentally confirmed.
We performed hierarchical clustering (separately) on sets of differentially expressed miRNAs and target genes distinguishing patients with high WBC from patients with low WBC to identify clusters of miRNAs and genes with similar expression profiles. Prior to clustering, miRNA and gene expression values were normalized, standardized, and centered.33 Hierarchical clustering was performed using GenePattern.34 We performed network and pathway enrichment analysis on miRNA target genes distinguishing the 2 patients groups using the IPA31 to identify molecular networks and biological pathways enriched for or targeted by miRNAs. We performed Gene Ontology (GO) analysis to characterize the molecular functions and biological processes in which the discovered mRNA target genes are involved.
Results
Association of miRNAs with ALL phenotypes
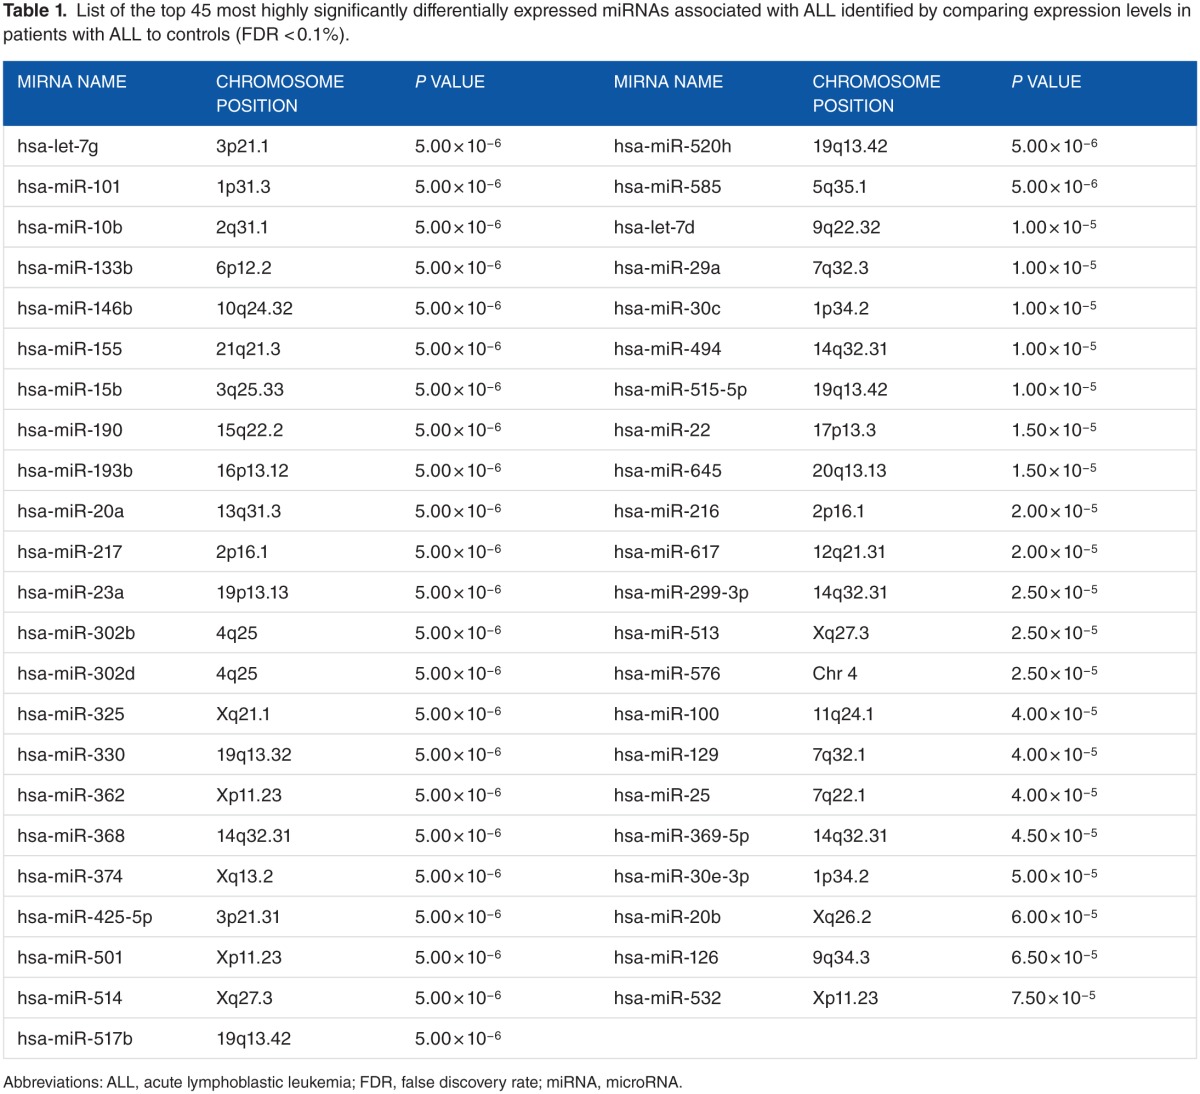
To identify miRNAs differentially expressed in pediatric ALL, we compared the expression levels of the 365 miRNAs between pediatric ALL patients and control samples. We hypothesized that the expression levels of miRNAs significantly differ between pediatric patients diagnosed with ALL and the control samples. After correcting for multiple hypothesis testing using the FDR procedure, the analysis revealed a signature of 136 significantly (P < .05) differentially expressed miRNAs distinguishing pediatric patients with ALL from controls. A signature of the top 45 most highly significantly (P < 10−5) differentially expressed miRNAs distinguishing ALL patients from controls is presented in Table 1. Interestingly, the signature included 12 miRNAs—miR-92a, miR-100, miR-125a, miR-128a, miR-146, miR-181b, miR-196, let-7e, miR-532, miR-155, miR-29a, and miR-494—previously reported to be associated with pediatric ALL17 (Table 1). The remaining 32 miRNAs were novel discoveries not previously reported. A signature with all the 136 significantly differentially expressed miRNAs along with their estimates of P values and FDR are presented in Table S1 provided as supplementary data to this report. This analysis confirmed our hypothesis that miRNAs are involved in pediatric ALL.
Table 1.
List of the top 45 most highly significantly differentially expressed miRNAs associated with ALL identified by comparing expression levels in patients with ALL to controls (FDR < 0.1%).
Differential expression of target genes
To identify significantly differentially expressed genes distinguishing patients with high WBC from patients with low WBC, we performed whole-genome analysis comparing gene expression levels between the 2 patient groups. We hypothesized that molecular perturbation significantly differs between pediatric patients with high WBC and patients with low WBC and that some of the differentially expressed genes between the 2 patient groups are targets of miRNAs. Whole-genome analysis revealed 5420 significantly (P < .05) differentially expressed genes distinguishing the 2 groups and confirming our hypothesis.
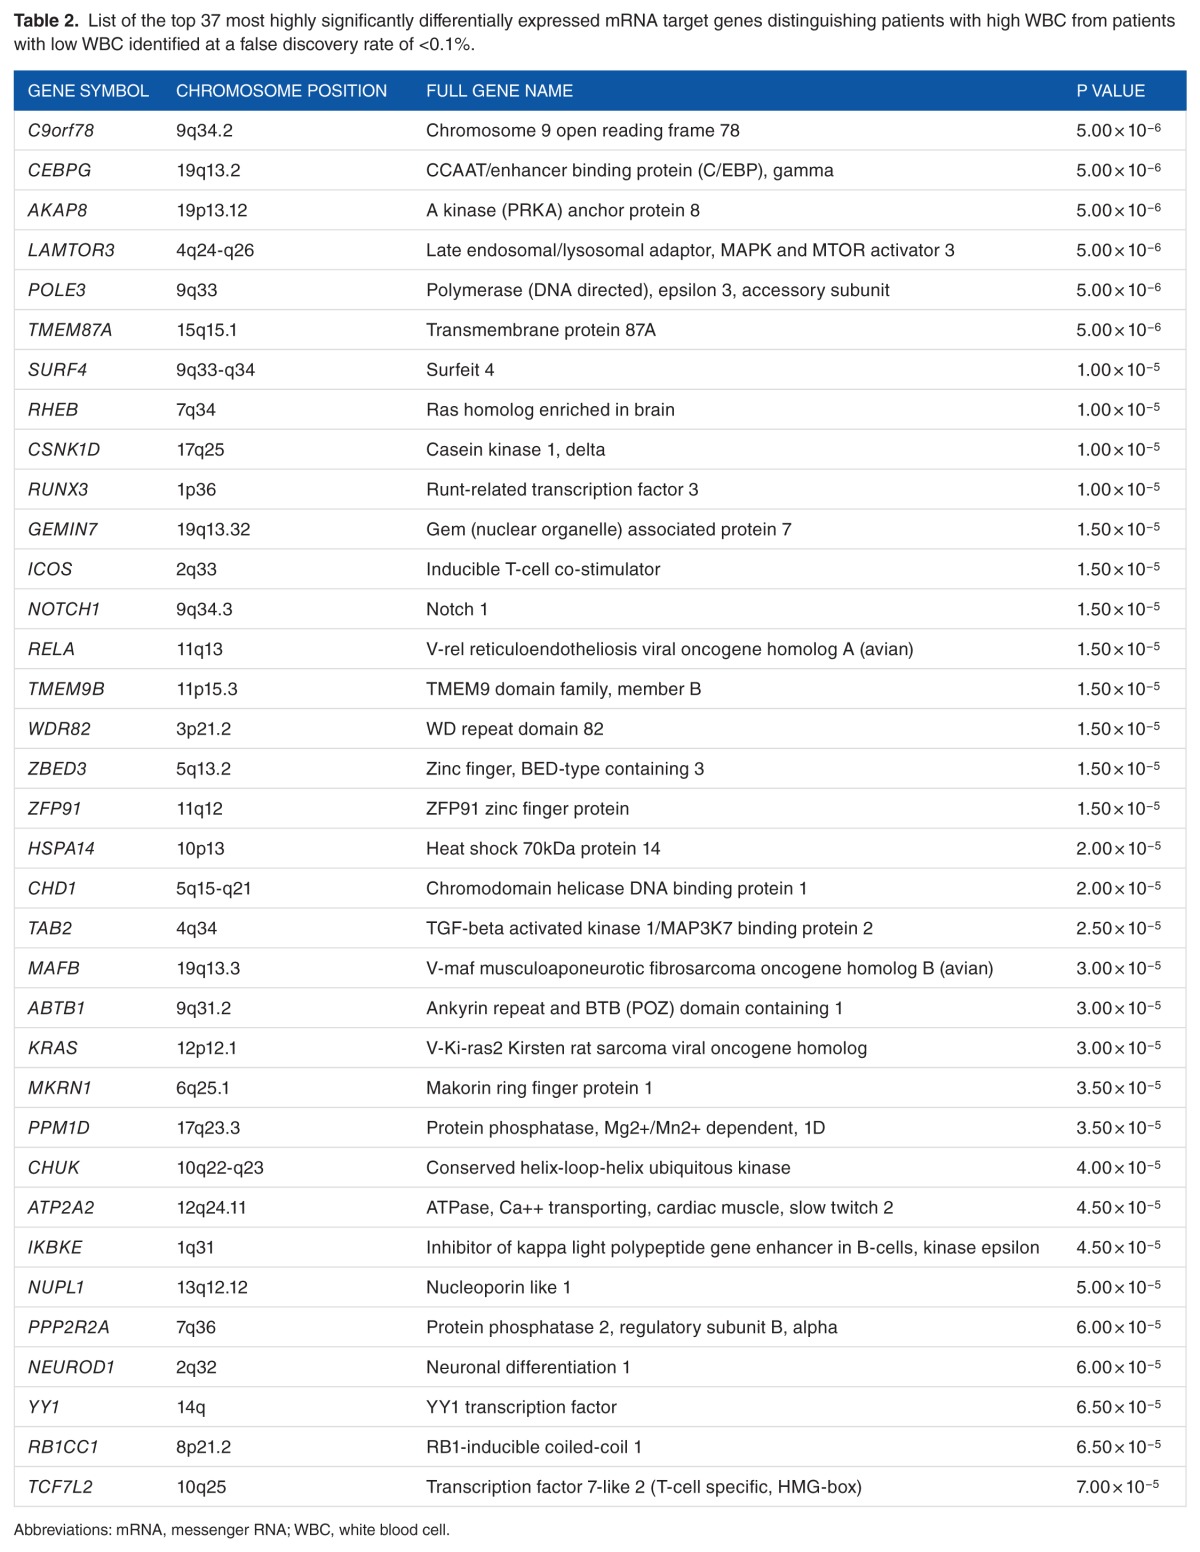
Comparison of the expression levels of 1160 validated and experimentally confirmed mRNA target genes between patients with high WBC and patients with low WBC revealed a signature of 349 significantly (P < .05) differentially expressed genes. A signature of the top 37 most highly significantly (P < 10−5) differentially expressed mRNA target genes distinguishing the 2 patient groups is presented in Table 2. The top list included the genes GEMIN7, ABTB1, KRAS, IKBKE, and NEUROD1 which were upregulated in patients with high WBC. Also included in the top list were the genes 9orf78, CEBPG, AKAP8, LAMTOR3, POLE3, TMEM87A, SURF4, RHEB, CSNK1D, RUNX3, ICOS, NOTCH1, RELA, TMEM9B, WDR82, ZBED3, ZFP91, HSPA14, CHD1, TAB2, MAFB, MKRN1M, PPM1D, CHUK, ATP2A2, NUPL1, PPP2R2A, YY1, RB1CC1, TCF7L2, SIRT1, and TNRC6A which were downregulated. A complete list of the 349 significantly (P < .05) differentially expressed target genes along with their estimates of P values and FDR are presented in Table S2 provided as supplementary data to this report.
Table 2.
List of the top 37 most highly significantly differentially expressed mRNA target genes distinguishing patients with high WBC from patients with low WBC identified at a false discovery rate of <0.1%.
Differential expression of nontarget genes
A concern in our analysis was the limited number of miRNAs evaluated. As noted in the preceding section, we performed whole-genome analysis of gene expression data. We reasoned that by focusing only on limited miRNA target genes, we could miss important genes which modulate WBC and potentially have the power to accurately discriminate patients with high WBC from patients with low WBC. To address this issue, we evaluated the nontarget genes using the same analysis strategy and hypothesis as applied to target genes. Evaluating the whole genome revealed 5071 significantly (P < .05) differentially expressed nontarget genes at an FDR of 22%. Further evaluation of the nontarget genes using a more stringent threshold of P < 10−5 and FDR of <2% revealed a signature of 455 nontarget genes. Interestingly, 144 nontarget genes had more power of discriminating patients with high WBC from patients with low WBC (P < 10−6, FDR <1%). A list of all the 455 highly significantly (P < 10−5) differentially expressed nontarget genes distinguishing patients with high WBC from patients with low WBC along with their estimates of P values and FDR are presented in Table S3 provided as supplementary data to this report.
Patterns of expression profiles for miRNAs
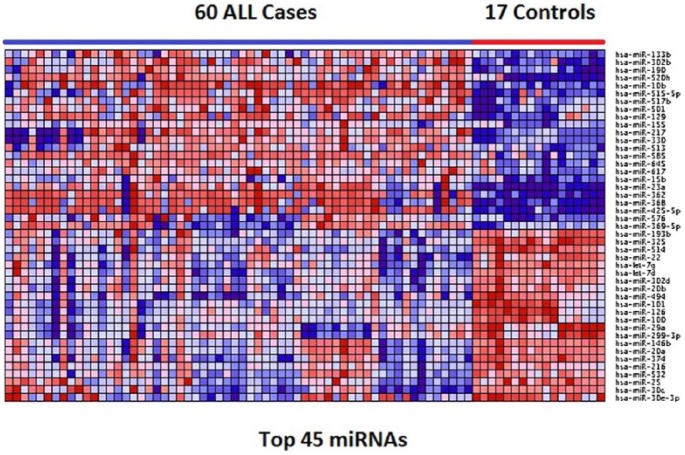
To gain insights about the potential functional relationships of the identified miRNAs and their mRNA target and nontarget genes, we performed hierarchical clustering on differentially expressed miRNAs, first on all the 136 miRNAs and then on the top 45 miRNAs. We hypothesized that the differentially expressed miRNAs are likely to have similar patterns of expression. The results of hierarchical clustering for the 45 most highly significantly (P < 10−5) differentially expressed miRNAs are presented in Figure 2. Cluster analysis revealed a signature of upregulated and downregulated miRNAs with similar and consistent patterns of expression. Twenty-three miRNAs among them, namely, mir-133b, mir-302, mir-190, mir-520, mir-10b, mir-515-5p, mir-517b, mir-501, mir-129, mir-155, mir-217, mir-330, mir-513, mir-585, mir-645, mir-617, mir-15b, mir-23a, mir-362, mir-368, mir-425-5p, mir-576, and mir-369-5p, were upregulated in ALL. The other 22 miRNAs, namely, mir-193b, mir-325, mir-514, mir-22, mir-7g, mir-7d, mir-302d, mir-206, mir-494, mir-101, mir-126, mir-100, mir-29a, mir-299-3p, mir-146, mir-20a, mir-374, mir-216, mir-532, mir-25, mir-30c, and mir-30e-3p, were downregulated. The results for all the 136 miRNAs are presented in Supplementary Figure SF2. As expected, the results exhibited significant heterogeneity in patterns of expression profiles. Pediatric ALL is inherently a heterogeneous disease entity encompassing many subtypes as documented in the “Materials and Methods” section; therefore, such outcome is expected.
Figure 2.
Patterns of expression profiles for the top 45 most highly significantly (P < 10−5) differentially expressed miRNAs distinguishing pediatric patients from control samples. The pediatric patients and controls are represented in columns and the miRNAs are represented in the rows. The color red and blue in the heat map indicate upregulation and downregulation, respectively. ALL indicates acute lymphoblastic leukemia; miRNA, microRNA.
Patterns of expression profiles for mRNA target and nontarget genes
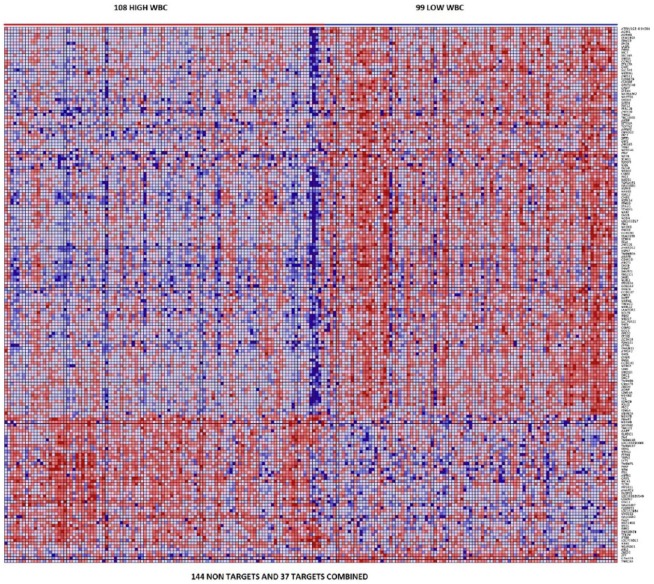
To investigate whether mRNA target genes are coexpressed and have similar patterns of expression profiles among themselves and with nontarget genes, we performed hierarchical clustering using expression data on the top 37 mRNA target genes (P < 10−5) and the top 144 nontarget genes (P < 10−6) distinguishing patients with high WBC from patients with low WBC. We hypothesized that mRNA target genes are coexpressed and have similar patterns of expression with one another and with nontarget genes. Figure 3 shows the patterns of expression profiles for the 181 gene signature. The analysis revealed that miRNA target genes are coexpressed and have similar patterns of expression profiles (Figure 3). In addition, the analysis revealed that miRNA target genes are coexpressed and have similar patterns of expression profiles with nontarget genes, confirming our hypothesis. The patterns of expression profiles for the top 37 target genes are shown in Figure SF3 provided as supplementary data to this report. As expected, there was significant variation in patterns of expression profiles. This can partially be explained by the genetic and phenotypic heterogeneity inherent in pediatric ALL and the many subtypes of ALL included in this analysis as documented in the “Materials and Methods” section. Under these conditions, such outcome is expected.
Figure 3.
Patterns of expression profiles for the top 37 messenger RNA (mRNA) target genes (P < 10−5) and the top 144 most highly significantly (P < 10−6) differentially expressed mRNA nontarget genes distinguishing the 108 samples with high white blood cell (WBC) count from the 99 samples with low WBC count. The samples are shown in the columns and the mRNAs are represented in the rows. The color red and blue in the heat map indicate upregulation and downregulation, respectively.
To gain insights about the molecular functions and the biological processes that the identified target and nontarget genes are involved, we performed GO analysis. The analysis revealed that target and nontarget genes are functionally related and involved in similar biological processes. The list of target genes, along with information on molecular functions and biological processes in which they are involved, is presented in Table S5 provided as supplementary data. The results showing the molecular functions and biological processes in which target and nontarget genes are involved are presented in Table S6 provided as supplementary data to this report. MicroRNA target genes and nontarget genes were predicted to be functionally related and to be involved in the same biological processes.
Network and pathway analysis
To gain insights about the broader biological context in which the discovered miRNAs and their mRNA target genes operate, we performed network using significantly differentially expressed miRNAs and their target and nontarget genes. We hypothesized that miRNAs and their mRNA targets affect entire molecular networks modulating WBC. We sought to identify molecular networks enriched for or targeted by miRNAs involved in pediatric ALL.
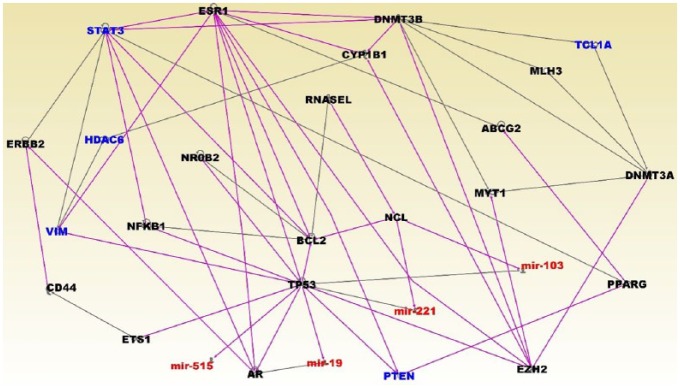
The results of network analysis are presented in Figure 4. Interestingly, the analysis revealed molecular networks enriched for or targeted by miRNAs involved in pediatric ALL. The networks contained genes predicted to be involved in cellular development, cellular growth and proliferation, cell cycle, DNA replication, recombination, and repair. The networks included ESR1, STAT3, HDAC6, VIM, PTEN, and TCL1A (Figure 4). Several miRNAs mir-515, mir-19, mir-221 and mir-103 were found to be targeting the P53 gene (Figure 4). Other miRNA targeted genes in the network included AR and NCL (Figure 4).
Figure 4.
Molecular networks linking microRNAs (miRNAs) and highly differentially expressed messenger RNA (mRNA) target genes and nontarget genes between patients with high white blood cell (WBC) count and patients with low WBC count. Differentially expressed miRNAs are in red fonts, their mRNA target genes are in blue fonts, and nontarget genes are in black fonts.
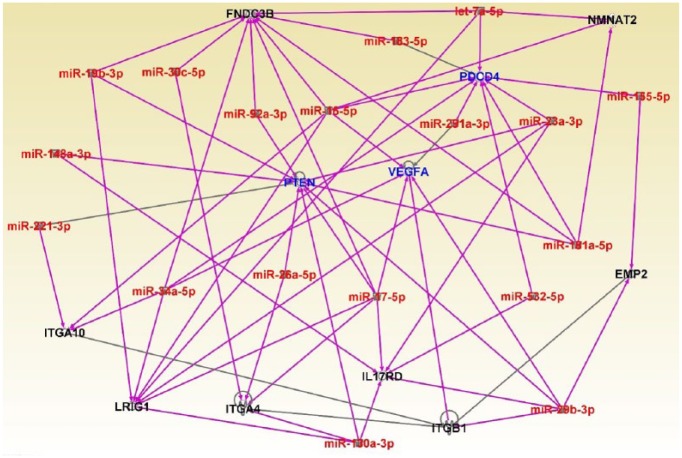
Additional results showing interactions between miRNAs and their mRNA target genes are shown in Figure 5. The analysis revealed significant interactions and functional relationships among the miRNAs and between the miRNAs and their mRNA target genes (Figure 5). The miRNAs mir-130a, mir-20b, mir-532, mir-181a, mir-17, mir-26a, mir-34a, mir-221, mir148a, mir19b, mir-30c, mir-92a, mir-85, mir-183, let-7a, mir-291a, mir-28a, and mir-155 were found to be interacting with one another and with their miRNA target genes (Figure 5). Among the mRNA target genes interacting with miRNAs were genes predicted to be involved in gene expression, cell cycle, cell death and survival, cellular growth and proliferation, and cellular cycle development. MicroRNA target genes included PDCD4, PTEN, and VEGFA.
Figure 5.
Molecular networks showing interactions among acute lymphoblastic leukemia (ALL)-associated miRNAs and interactions between microRNA (miRNAs) and highly differentially expressed messenger RNA target genes and nontarget genes between patients with high white blood cell (WBC) count and patients with low WBC count. ALL-associated miRNAs are in red fonts, target genes are in blue fonts, and nontarget genes are in black fonts.
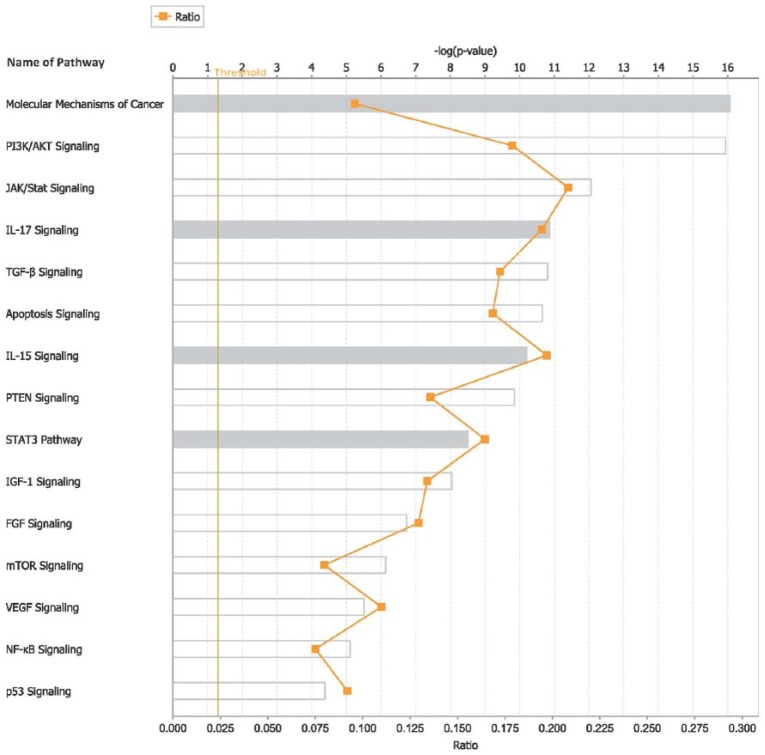
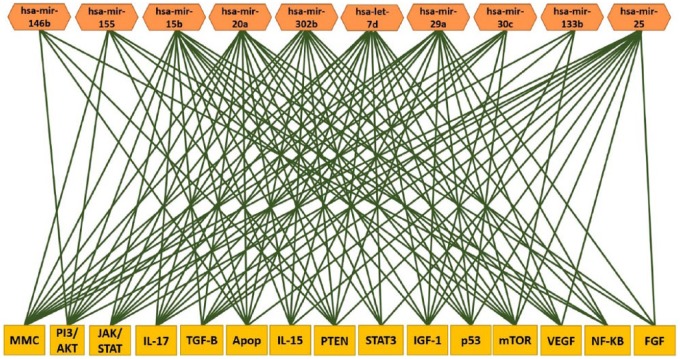
To further gain insights about the broader context in which the miRNAs operate, we performed pathway analysis. The results showing the top 15 most highly significant pathways targeted by miRNAs are presented in Figure 6. Discovered pathways included the molecular mechanisms of cancer, PI3/AKT, JAK/STAT, IL-17, TGF-β, apoptosis, IL-15, PTEN, STAT3, IGF-1, FGF, mTOR, VEGF, NF-kB, and P53 signaling pathways (Figure 6). Interestingly, the analysis further revealed that miRNAs target multiple biological pathways modulating WBC (Figure 7), suggesting that miRNAs may be involved in regulating pathway cross talk. Overall, the results establish putative functions bridges between miRNAs and their target genes, molecular networks, and biological pathways modulating WBC in pediatric ALL.
Figure 6.
List of the top 15 most highly significant biological pathways targeted by microRNAs (miRNAs) highly differentially expressed and their messenger RNA (mRNA) target genes and nontarget genes distinguishing patients with high white blood cell (WBC) count from patients with low WBC count. The y-axis shows the names of the pathways indicated by bars in the chart. The x-axis shows the ratio of assigned molecules to the total molecules in that pathway. The vertical yellow line indicates the threshold as assessed by the log P value (of chart) for declaring the pathway significantly enriched for miRNAs and mRNA target genes.
Figure 7.
Multiple biological pathways (bottom yellow boxes) targeted by multiple microRNAs (upper orange boxes) highly significantly differentially expressed between pediatric patients with acute lymphoblastic leukemia and controls. Complete names of the pathways and estimates of P values presented in the form of log P value are presented in Figure 6.
Discussion
In this study, we analyzed the expression levels of 365 miRNAs in pediatric patients and controls and expression levels of their mRNA target genes measured in pediatric patients with high WBC and patients with low WBC. The important findings are the following:
MicroRNAs were differentially expressed between patients with ALL and control samples, suggesting that miRNAs have the potential to function as clinically actionable biomarkers. The differences in expression in miRNA expression levels between pediatric patients diagnosed with ALL and controls observed in this study are consistent with literature reports.19
The investigation revealed a signature of 349 mRNA target genes which distinguished patients with high WBC from patients with low WBC. To the extent that miRNAs control the expression of protein-coding genes,18 regulate many biological pathways,15 are involved in disease prognosis,21 provide resistance to disease,22 and are predictors of relapse,23 this is a significant finding. Importantly, WBC is a well-known, strong, and independent predictor of both relapse and disease prognosis,8 which have also been associated with miRNAs.21–23 Therefore, discovery of miRNAs that are potentially involved in regulating genes modulating WBC could have significant impact in improving treatment protocols and development of novel therapeutics. To our knowledge, this is the first study to link miRNAs to their mRNA target genes distinguishing patients with high WBC from patients with low WBC. Although we did not directly investigate the role of miRNAs in patients with high and low WBC (due to lack of data), the results in this study show the feasibility and provide a testable hypothesis and a framework for conducting such an investigation in future.
The clinical significance and potential therapeutic application of the results
The potential impact and how clinicians might take advantage of the results from our study can be summarized as follows:
The discovery of miRNAs significantly differentially expressed between pediatric patients and controls suggests that miRNAs represent potential clinically actionable biomarkers.
The discovery of target and nontarget genes distinguishing patients with high WBC from patients with low WBC provides a framework for developing a prognostic index and treatment protocols that combine molecular and clinical information. The integration of both clinical information on WBC and molecular markers could provide a basis for individualized patient care through riskadapted therapy of pediatric ALL.
Because pediatric ALL is inherently a heterogeneous disease entity and encompasses many subtypes which respond differently to treatment, molecular stratification of patients may be an important strategy for guiding treatment options at the point of care. Although we did not investigate the correlation of miRNAs and their mRNA target genes with treatment response and disease prognosis, the correlation of miRNAs with treatment response and prognosis in pediatric ALL has been reported.21
MicroRNAs are relatively stable and can be accurately measured from relatively small tissue samples, including body fluids such as blood, saliva, and urine.22 Therefore, they represent ideal prognostic markers that can be assessed using either noninvasive or minimally invasive techniques.
The discovery of molecular networks and biological pathways enriched for miRNAs is of particular interest as these pathways could potentially serve as targets for the development of novel and less toxic therapeutics. Although we did not investigate the role of miRNAs discovered in this study in drug treatment, miRNA involvement in pathways modulating drug resistance has been reported.35 The discovery of multiple pathways enriched or targeted by miRNAs, such as the apoptosis, P53, IGF-1 and mTOR signaling pathways, suggests the potential involvement of miRNAs in regulating pathway cross talk. Cooperative control of tumor suppressor genes such as P53 discovered here by a network of oncogenic miRNAs has been reported.36 Most notably, the miRNA100/99a discovered in this study has been shown to suppress proliferation and promote apoptosis by regulating the FKBP51 and IFG1R/mTOR signing pathways discovered in this study.37 In a clinical setting, the apoptosis pathway is targeted for chemotherapy and thus represents a potential therapeutic target.37 The P53 pathway which was targeted by the miRNAs mir-19, mir-221, mir-515 and mir-103 in this study is a tumor suppressor pathway suggesting that these miRNAs could potentially have tumor-suppressive or oncogenic roles.
Limitations of this exploratory study
In this study, we discovered miRNAs involved in pediatric ALL and established a link between the discovered miRNAs and their mRNA target genes, molecular networks, and biological pathways modulating WBC in ALL. Although these results are very promising, the limitations of the study must be acknowledged. There are several limitations which we readily acknowledge:
The first limitation is the lack of miRNA expression data from patients with high and low WBC in pediatric ALL. Availability of such data would have undoubtedly strengthened our manuscript by providing information to compute the correlations between miRNAs and their mRNA target genes. However, although we did not take that step, our analysis establishes putative functional bridges between miRNAs and their mRNA target genes, molecular networks, and biological pathways dysregulated in patients with high or low WBC. This creates a framework for a future study to identify aberrant miRNAs that distinguish patients with high WBC from patients with low WBC in childhood ALL.
The second, but equally important limitation of our integrative analysis approach used in this study is that gene and miRNA expression data came from different pediatric patients. Although this could potentially be viewed as a limitation because both gene and miRNA expression can be population-specific, the approach used here is consistent with other studies on pediatric ALL integrating gene expression with miRNA expression data.24,38 Although we wish to acknowledge these limitations, we wish to note that our study and other studies38 relied on publicly available data, which is a necessary and cost-effective way for hypothesis generation and knowledge discovery through data mining which was the case in this exploratory study. Indeed, use of publicly available data has other limitations, including errors inherent in experimental protocols, in the processing of data itself as well as missing clinical information, but those are beyond the scope of this report. We do, however, view the limitations acknowledged in this study as subjects of future investigations.
Conclusions
The study demonstrates that integrative analysis integrating miRNA and gene expression data provides a powerful approach for the discovery of miRNAs involved in pediatric ALL and linking them to their mRNA target genes, molecular networks, and biological pathways modulating WBC levels in pediatric patients with ALL. Further studies to evaluate the expression levels of miRNAs and their mRNA target genes in patients with high and low WBC in different subtypes of pediatric ALL are warranted.
Footnotes
PEER REVIEW: Six peer reviewers contributed to the peer review report. Reviewers’ reports totaled 1500 words, excluding any confidential comments to the academic editor.
FUNDING: The author(s) disclosed receipt of the following financial support for the research, authorship, and/or publication of this article: This work was financially supported by Louisiana University Health Sciences Center-School of Medicine in New Orleans, the University of Alabama at Birmingham’s Center for Clinical and Translational Sciences, the Hyundai Hope on Wheels foundation, the CHEW Foundation, and the University of Mississippi Medical Center’s Children’s Cancer Center and Cancer Institute.
DECLARATION OF CONFLICTING INTERESTS: The author(s) declared no potential conflicts of interest with respect to the research, authorship, and/or publication of this article.
Author Contributions
CH and RR carried out the bioinformatics and genomic analysis and visualization; CH, GM, JS, SV, VV and CK contributed to design and defining the medical and clinical aspects of the study. GM, VV, SV and JS helped in defining the clinical question. CH, GM, JS, CK and RR designed the manuscript, data and figure presentation. All the authors contributed to the interpretation of the results, writing and preparation of the manuscript. All authors read and approved the final manuscript.
REFERENCES
- 1.Mullighan CG. The molecular genetic makeup of acute lymphoblastic leukemia. Hematology. 2012:389–395. doi: 10.1182/asheducation-2012.1.389. [DOI] [PubMed] [Google Scholar]
- 2.Cancer Facts and Figures . Annual Report. American Cancer Society; 2014. https://www.cancer.org/research/cancer-facts-statistics/all-cancer-facts-figures/cancer-facts-figures-2014.html. [Google Scholar]
- 3.Pui CH, Evans WE. Drug therapy: treatment of acute lymphoblastic leukemia. N Engl J Med. 2006;354:166–178. doi: 10.1056/NEJMra052603. [DOI] [PubMed] [Google Scholar]
- 4.Pui CH, Robinson LL, Look AT. Acute lymphoblastic leukemia. Lancet. 2008;371:1030–1043. doi: 10.1016/S0140-6736(08)60457-2. [DOI] [PubMed] [Google Scholar]
- 5.Pui CH, Pei DQ, Sandlund JT, et al. Risk of adverse events after completion of therapy for childhood acute lymphoblastic leukemia. J Clin Oncol. 2005;23:7936–7941. doi: 10.1200/JCO.2004.01.0033. [DOI] [PubMed] [Google Scholar]
- 6.Harvey RC, Mullighan CG, Wang X, et al. Identification of novel cluster groups in pediatric high-risk B-precursor acute lymphoblastic leukemia with gene expression profiling: correlation with genome-wide DNA copy number alterations, clinical characteristics, and outcome. Blood. 2010;116:4874–4884. doi: 10.1182/blood-2009-08-239681. [DOI] [PMC free article] [PubMed] [Google Scholar]
- 7.Kang H, Chen IM, Wilson CS, et al. Gene expression classifiers for relapse-free survival and minimal residual disease improve risk classification and outcome prediction in pediatric B-precursor acute lymphoblastic leukemia. Blood. 2010;115:1394–1405. doi: 10.1182/blood-2009-05-218560. [DOI] [PMC free article] [PubMed] [Google Scholar]
- 8.Vaitkevičienė G, Forestier E, Hellebostad M, et al. High white blood cell count at diagnosis of childhood acute lymphoblastic leukaemia: biological background and prognostic impact. Results from the NOPHO ALL-92 and ALL-2000 studies. Eur J Haematol. 2011;86:38–46. doi: 10.1111/j.1600-0609.2010.01522.x. [DOI] [PubMed] [Google Scholar]
- 9.Silveira VS, Scrideli CA, Moreno DA, et al. Gene expression pattern contributing to prognostic factors in childhood acute lymphoblastic leukemia. Leuk Lymphoma. 2013;54:310–314. doi: 10.3109/10428194.2012.710330. [DOI] [PubMed] [Google Scholar]
- 10.Sitthi-Amorn J, Herrington B, Megason G, et al. Molecular basis of minimal residual disease in subtypes of pediatric B-cell acute lymphoblastic leukemia. Blood. 2013;122:1390. doi: 10.4137/CMO.S17049. [DOI] [PMC free article] [PubMed] [Google Scholar]
- 11.Conter V, Bartram CR, Valsecchi MG, et al. Molecular response to treatment redefines all prognostic factors in children and adolescents with B-cell precursor acute lymphoblastic leukemia: results in 3184 patients of the AIEOP-BFM ALL 2000 study. Blood. 2010;115:3206–3214. doi: 10.1182/blood-2009-10-248146. [DOI] [PubMed] [Google Scholar]
- 12.Moricke A, Zimmermann M, Reiter A, et al. Long-term results of five consecutive trials in childhood acute lymphoblastic leukemia performed by the ALL-BFM study group from 1981 to 2000. Leukemia. 2010;24:265–284. doi: 10.1038/leu.2009.257. [DOI] [PubMed] [Google Scholar]
- 13.Pui CH. Genomic and pharmacogenetic studies of childhood acute lymphoblastic leukemia. Front Med. 2015;9:1–9. doi: 10.1007/s11684-015-0381-3. [DOI] [PubMed] [Google Scholar]
- 14.Volinia S, Galasso M, Costinean S, et al. Reprogramming of miRNA networks in cancer and leukemia. Genome Res. 2010;20:589–599. doi: 10.1101/gr.098046.109. [DOI] [PMC free article] [PubMed] [Google Scholar]
- 15.Leichter AL, Sullivan MJ, Eccles MR, Chatterjee A. MicroRNA expression patterns and signalling pathways in the development and progression of childhood solid tumours. Mol Cancer. 2017;16:15. doi: 10.1186/s12943-017-0584-0. [DOI] [PMC free article] [PubMed] [Google Scholar]
- 16.Lu L, Chen XM, Tao HM, Xiong W, Jie SH, Li HY. Regulation of the expression of zinc finger protein genes by microRNAs enriched within acute lymphoblastic leukemia-derived microvesicles. Genet Mol Res. 2015;14:11884–11895. doi: 10.4238/2015.October.5.2. [DOI] [PubMed] [Google Scholar]
- 17.Duyu M, Durmaz B, Gunduz C, et al. Prospective evaluation of whole genome microRNA expression profiling in childhood acute lymphoblastic leukemia. Biomed Res Int. 2014;2014:967585. doi: 10.1155/2014/967585. [DOI] [PMC free article] [PubMed] [Google Scholar]
- 18.Schotte D, Chau JC, Sylvester G, et al. Identification of new microRNA genes and aberrant microRNA profiles in childhood acute lymphoblastic leukemia. Leukemia. 2009;23:313–322. doi: 10.1038/leu.2008.286. [DOI] [PubMed] [Google Scholar]
- 19.De Oliviera JC, Scrideli CA, Brassesco MS, et al. Differential miRNA expression in childhood acute lymphoblastic leukemia and association with clinical and biological features. Leuk Res. 2012;36:293–298. doi: 10.1016/j.leukres.2011.10.005. [DOI] [PubMed] [Google Scholar]
- 20.Hezaveh K, Kloetgen A, Bernhart SH, et al. Alterations of microRNA and microRNA-regulated messenger RNA expression in germinal center B-cell lymphomas determined by integrative sequencing analysis. Haematologica. 2016;101:1380–1389. doi: 10.3324/haematol.2016.143891. [DOI] [PMC free article] [PubMed] [Google Scholar]
- 21.Nemes K, Csóka M, Nagy N, et al. Expression of certain leukemia/lymphoma related microRNAs and its correlation with prognosis in childhood acute lymphoblastic leukemia. Pathol Oncol Res. 2015;21:597–604. doi: 10.1007/s12253-014-9861-z. [DOI] [PubMed] [Google Scholar]
- 22.Schotte D, De Menezes RX, Akbari Moqadam F, et al. MicroRNA characterize genetic diversity and drug resistance in pediatric acute lymphoblastic leukemia. Haematologica. 2011;96:703–711. doi: 10.3324/haematol.2010.026138. [DOI] [PMC free article] [PubMed] [Google Scholar]
- 23.Avigad S, Verly IR, Lebel A, et al. miR expression profiling at diagnosis predicts relapse in pediatric precursor B-cell acute lymphoblastic leukemia. Genes Chromosomes Cancer. 2016;55:328–339. doi: 10.1002/gcc.22334. [DOI] [PubMed] [Google Scholar]
- 24.Mesrian Tanha H, Mojtabavi Naeini M, Rahgozar S, Moafi A, Honardoost MA. Integrative computational in-depth analysis of dysregulated miRNA-mRNA interactions in drug-resistant pediatric acute lymphoblastic leukemia cells: an attempt to obtain new potential gene-miRNA pathways involved in response to treatment. Tumour Biol. 2016;37:7861–7872. doi: 10.1007/s13277-015-4553-1. [DOI] [PubMed] [Google Scholar]
- 25.Mocellin S, Pasquali S, Pilati P. Oncomirs: from tumor biology to molecularly targeted anticancer strategies. Mini Rev Med Chem. 2009;9:70–80. doi: 10.2174/138955709787001802. [DOI] [PubMed] [Google Scholar]
- 26.Den Boer ML, Harms DO, Pieters R, et al. Patient stratification based on prednisolone-vincristine-asparaginase resistance profiles in children with acute lymphoblastic leukemia. J Clin Oncol. 2003;21:3262–3268. doi: 10.1200/JCO.2003.11.031. [DOI] [PubMed] [Google Scholar]
- 27.Stam RW, Den Boer ML, Schneider P, et al. Targeting FLT3 in primary MLL-gene-rearranged infant acute lymphoblastic leukemia. Blood. 2005;106:2484–2490. doi: 10.1182/blood-2004-09-3667. [DOI] [PubMed] [Google Scholar]
- 28.Morrissey ER, Diaz-Uriarte R, Pomelo II. Finding differentially expressed genes. Nucleic Acids Res. 2009;37:W581–W586. doi: 10.1093/nar/gkp366. [DOI] [PMC free article] [PubMed] [Google Scholar]
- 29.Benjamini Y, Hochberg Y. Controlling the false discovery rat: a practical and powerful approach to multiple testing. J Royal Stat Soc Series B. 1995;57:289–300. [Google Scholar]
- 30.Ramacher MD, Mcshane LM, Simon R. A paradigm for class prediction using gene expression profiles. J Comput Biol. 2002;9:505–511. doi: 10.1089/106652702760138592. [DOI] [PubMed] [Google Scholar]
- 31.Ingenuity Pathways Analysis (IPA) system. Redwood, CA: Ingenuity Systems, Inc; http://www.ingenuity.com/ [Google Scholar]
- 32.TargetScan (Human) Prediction of miRNA targets. Release 7.1. Jun, 2016. http://www.targetscan.org/vert_71/
- 33.Eisen MB, Spellman PT, Brown PO, Botstein D. Cluster analysis and display of genome-wide expression patterns. Proc Nat Acad Sci U S A. 1998;95:14863–14868. doi: 10.1073/pnas.95.25.14863. [DOI] [PMC free article] [PubMed] [Google Scholar]
- 34.Reich M, Liefeld T, Gould J, Lerner J, Tamayo P. GenePattern 2.0. Nat Genet. 2006;38:500–501. doi: 10.1038/ng0506-500. [DOI] [PubMed] [Google Scholar]
- 35.Han BW, Feng DD, Li ZG, et al. A set of miRNAs that involve in the pathways of drug resistance and leukemic stem-cell differentiation is associated with the risk of relapse and glucocorticoid response in childhood ALL. Hum Mol Genet. 2011;20:4903–4915. doi: 10.1093/hmg/ddr428. [DOI] [PMC free article] [PubMed] [Google Scholar]
- 36.Mavrakis KJ, Leslie CS, Wendel HG. Cooperative control of tumor suppressor genes by a network of oncogenic miRNAs. Cell Cycle. 2011;10:2845–2849. doi: 10.4161/cc.10.17.16959. [DOI] [PMC free article] [PubMed] [Google Scholar]
- 37.X-J Li, X-Q Luo, B-W Han, et al. MicroRNA-100/99a, deregulated in acute lymphoblastic leukaemia, suppress proliferation and promote apoptosis by regulating the FKBP51 and IGF1R/mTOR signalling pathways. Br J Cancer. 2013;109:2189–2198. doi: 10.1038/bjc.2013.562. [DOI] [PMC free article] [PubMed] [Google Scholar]
- 38.Hu Y, Xiong Q, Yang Y, et al. Integrated analysis of gene expression and microRNA regulation in three leukemia-related lymphoblastic cell lines. Gene. 2015;564:39–52. doi: 10.1016/j.gene.2015.03.039. [DOI] [PubMed] [Google Scholar]


