

Abstract
Recently we have shown that co-expression of hMet and mutant-β-catenin using sleeping beauty transposon/transposase leads to HCC in mice that represents around 10% of human HCC. In the current study, we investigate if Ras activation, which can occur downstream of Met signaling, is sufficient to cause HCC in association with mutant-β-catenin. We also tested therapeutic efficacy of targeting β-catenin in HCC model. We show that mutant-K-Ras (G12D), which leads to Ras activation, cooperates with β-catenin mutants (S33Y, S45Y) to yield HCC in mice. Affymetrix microarray shows >90% similarity in gene expression in mutant-K-Ras-β-catenin and Met-β-catenin HCC. K-Ras-β-catenin tumors showed upregulation of β-catenin targets like Glutamine Synthetase (GS), Lect2, Regucalcin and Cyclin-D1 and of K-Ras effectors including p-ERK, p-AKT, p-mTOR, p-EIF4E, p-4E-BP1 and p-S6 Ribosomal protein. Inclusion of dominant-negative TCF4 at the time of K-Ras-β-catenin injection prevented HCC and downstream β-catenin and Ras signaling. To address if targeting β-catenin has any benefit post-establishment of HCC, we administered K-Ras-β-catenin mice with EnCore lipid nanoparticle (LNP) loaded with a Dicer substrate siRNA targeting CTNNB1 (CTNNB1-LNP), scrambled sequence (Scr-LNP) or PBS for multiple cycles. A significant decrease in tumor burden was evident in CTNNB1-LNP group versus all controls, which was associated with dramatic decreases in β-catenin targets and some K-Ras effectors, leading to reduced tumor cell proliferation and viability. Intriguingly, in few mice, non-GS-positive tumors, which were evident as a small subset of overall tumor burden, were not affected by β-catenin suppression. In conclusion, we show that Ras activation downstream of c-Met is sufficient to induce clinically relevant HCC in cooperation with mutant β-catenin. β-Catenin suppression by a clinically relevant modality is effective in treatment of β-catenin-positive, GS-positive HCCs.
Keywords: Liver tumors, Wnt signaling, mutations, molecular targeting, precision medicine, lipid nanoparticle, siRNA
INTRODUCTION
Hepatocellular cancer (HCC) is the most common primary tumor of the liver accounting for 85% of all primary malignant tumors. It remains a major cancer in less developed regions of the world where 83% of the estimated 782,000 new cancer cases worldwide occurred in 2012. HCC is the second most common cause of death from cancer worldwide (1). A disturbing trend however has surfaced in HCC incidence and mortality more recently (2). While the incidence and mortality from many cancers is decreasing worldwide, the incidence rates and death rates associated with HCC are increasing in many parts of the world, including North America, Latin America, and central Europe (3). In fact, HCC incidence rates have increased by 3.1% per year from 2008 to 2012. HCC incidence rates increased from 2008 to 2012 among non-Hispanic whites, non-Hispanic blacks, and American Indian/Alaska Natives, while a decrease was evident among non-Hispanic Asians and Pacific Islanders. More worrisome is also the fact that in contrast to the declining death rates in many common cancers, death rates from HCC have increased by 2.8 percent per year in men and by 3.4 percent per year in women. These rising trends in both incidence and mortality, and in both men and women, makes it particularly important to understand molecular and cellular mechanisms of HCC for improved understanding and therapies, which remain limited currently. The most effective therapy for HCC continues to be surgery, in the form of liver resection or liver transplantation. Sorafenib is the only effective drug for unresectable HCC with some survival benefit. Thus overall there is an urgent need to both identify molecular targets and perform preclinical studies in relevant animal models that represent human disease.
Activation of Ras signaling pathway due to several molecular aberrations is evident in significant subsets of HCC cases (4, 5). Mutations in K-RAS in HCC are rare and reported in around 7% of cases (6). However K-ras mutation in p53 null background or in cooperation with isocitrate dehydrogenase 1 (IDH1) leads to cholangiocarcinoma (7, 8). Activation of Wnt/β-catenin signaling is also well known in HCC (9). The chief mechanism of this activation is missense mutations in exon-3 region of β-catenin gene, which deem it resistant to ubiquitin-proteosome degradation leading to constitutive activation of the pathway. However, β-catenin activation alone does not induce spontaneous HCC (10) and only occasionally will cause tumors by itself, for example if it is expressed in progenitor cells (11). We have previously shown that expression of hMet, which is the cognate receptor tyrosine kinase (RTK) for Hepatocyte growth factor (HGF), along with mutant-β-catenin, leads to HCC in mice (12). Moreover, around 10% of human HCC overexpress hMet and have CTNNB1 mutations simultaneously. In fact, we showed that gene expression profile from tumors that occurred in hMet-mutant-β-catenin mice was 70% similar to human HCCs, which had Met activation and β-catenin mutations. The tumor-bearing livers in this model showed enhanced expression of both β-catenin targets and Met effectors like ERK/MAPK, Ras and AKT/mTOR.
In the current study, we chose to express mutant-β-catenin (serine 33 to tyrosine or S33Y-β-catenin and S45Y-β-catenin) and mutant K-Ras (G12D) to address cooperative activation of β-catenin and Ras signaling in HCC using sleeping beauty (SB) transposon/transposase and hydyrodynamic tail vein injection (13). This led to notable HCC in both G12D-K-Ras-S45Y-β-catenin and G12D-K-Ras-S33Y-β-catenin models, which histologically mimicked tumors in the Met-β-catenin model (12). Further, gene expression from tumor-bearing livers was almost 100% concordant between the K-Ras-β-catenin and Met-β-catenin model suggesting Ras activation downstream of hMet signaling to be a major contributor of HCC in cooperation with β-catenin signaling. We show the importance of β-catenin signaling in tumor initiation in the K-Ras-β-catenin model as introduction of dominant-negative TCF4 (dnTCF) at the time of delivery of K-Ras and β-catenin, completely prevented HCC while impairing p-ERK and partially impairing AKT/mTOR signaling. Lastly, we inhibited β-catenin in G12D-K-Ras-S45Y-β-catenin model after establishing HCC through use of EnCore lipid nanoparticle (LNP) loaded with a Dicer substrate siRNA targeting CTNNB1 (CTNNB1-LNP). Such treatment led to a significant decrease in tumor burden, which was associated with impaired β-catenin signaling, modest decrease in p-ERK and p-mTOR, and decreased cell proliferation and increased cell death. Thus this study demonstrates the efficacy of β-catenin suppression in a clinically relevant HCC model.
MATERIALS AND METHODS
Constructs and reagents
The constructs used for mouse injections pT3-EF5α-S33Y-mutant-β-catenin-Myc-Tag, pT3-EF5α-S45Y-mutant-β-catenin-Myc-tag, pT3-EF5α-dnTCF4 and pCMV-sleeping beauty (SB) transposase have been described previously (12). The construct pT3-EF5α-G12D-mutant-K-Ras was obtained from Dr. Xin Chen, UCSF and subcloned into pT3-EF5α plasmid via the Gateway PCR cloning strategy (Invitrogen, Carlsbad, CA). All the plasmids used for in vivo experiment were purified using the Endotoxin free Maxi prep kit (Sigma-Aldrich, St. Louis, MO).
Additional methods are available in an online supplement.
RESULTS
Concomitant expression of mutant K-Ras and mutant β-catenin in liver leads to development of HCC in mice
Mutations in K-RAS or activation of RTKs such as hMet, can lead to stimulation of Ras-Raf-MEK-ERK signaling. Since hMet-mutant-β-catenin co-expression in mice led to HCC that represented around 10% of human HCC, we next asked if Ras activation downstream of hMet could also cooperate with mutant β-catenin to cause HCC. We delivered via hydrodynamic tail vein injection in around 6 week old FVB male mice either constitutively active G12D-K-Ras alone (n=3), S45Y-β-catenin alone (n=11), S33Y-β-catenin alone (n=10), G12D-K-Ras-S45Y-β-catenin (n=8) or G12D-K-Ras-S33Y-β-catenin (n=8). Increased morbidity and mortality due to enlarged abdominal girth and excessive hepatic tumor burden was evident in both G12D-K-Ras-S45Y-β-catenin and G12D-K-Ras-S33Y-β-catenin groups, while none of the individual groups showed any compromise in survival (Figure 1A and 1B). Almost the entire livers were filled grossly with tumors at 7 weeks in G12D-K-Ras-S45Y-β-catenin group and at 8 weeks in G12D-K-Ras-S33Y-β-catenin group (Figure 1C and 1D). Histologically, the tumors between the two groups were indistinguishable and were well-differentiated HCCs composed of tumor cells basophilic cytoplasm, limited nuclear atypia and mild lipid accumulation, very similar to what was reported for Met-mutant-β-catenin model (Figure 1C and 1D). Areas of normal eosinophil staining hepatocytes were seen compressed in between the tumors nodules. The HCC nodules also stained positive for known HCC markers such as Glypican-3 and α-fetoprotein (Figure 1C and 1D).
Figure 1. Survival and tumorigenesis in G12D-K-Ras-S45Y-β-catenin and G12D-K-Ras-S33Y-β-catenin mice.
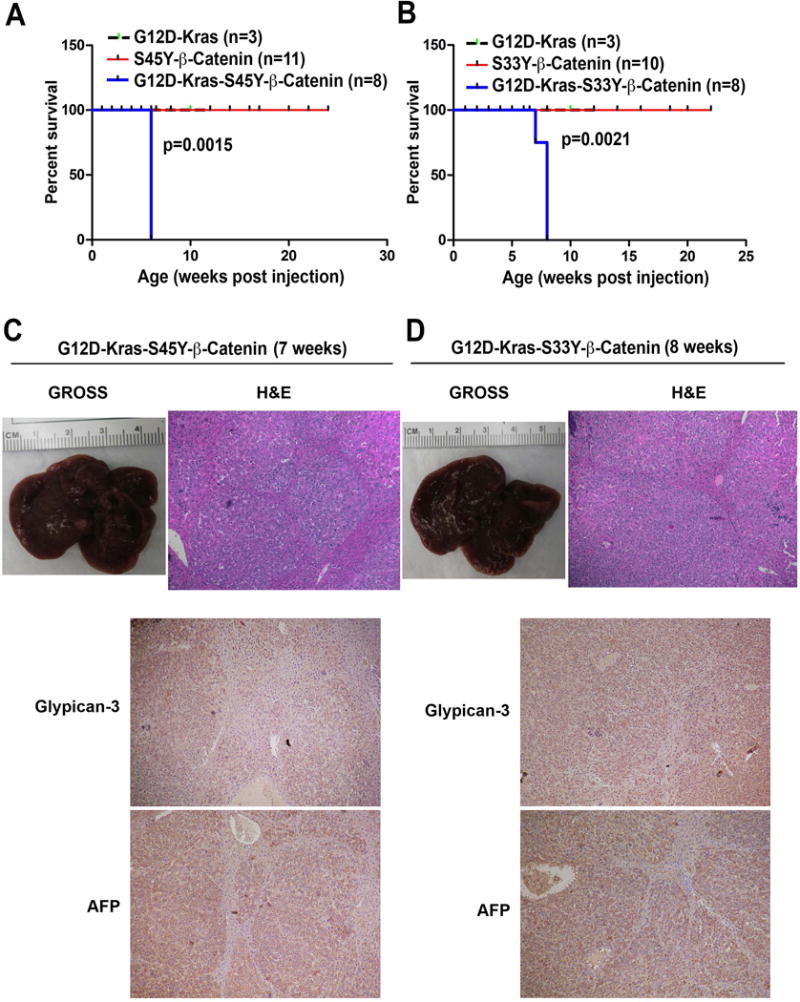
(A) Kaplan-Meier curve comparing survival of FVB mice injected with pT3-EF5α-G12D-K-Ras only, pT3-EF5α-S45Y-β-catenin-Myc-Tag only or combination of pT3-EF5α-G12D-K-Ras and pT3-EF5α-S45Y-β-catenin-Myc-Tag. G12D-K-Ras-S45Y-β-catenin injected mice showed significantly reduced survival owing to increased abdominal girth and associated morbidity compared to the other two groups (p=0.0015).
(B) Kaplan-Meier curve comparing survival of FVB mice injected with pT3-EF5α-G12D-K-Ras alone, pT3-EF5α-S33Y-β-catenin-Myc-Tag alone or combination of pT3-EF5α-G12D-K-Ras and pT3-EF5α-S33Y-β-catenin-Myc-tag. G12D-K-Ras-S33Y-β-catenin injected mice showed significantly reduced survival compared to the other groups (p=0.0021).
(C) Gross image of liver and Hematoxylin and Eosin staining of representative liver section from the G12D-K-Ras-S45Y-β-catenin group at 7 weeks. (Magnification ×100.)
(D) Gross image of liver and Hematoxylin and Eosin staining, Glypican-3 and α-fetoprotein of representative liver sections from the G12D-K-Ras-S33Y-β-catenin group at 7 weeks. (Magnification ×100.)
Tumor development in G12D-K-Ras-S45Y-β-catenin and G12D-K-Ras-S33Y-β-catenin mice
Since, mutant-β-catenin SB plasmid had a Myc tag, we followed the evolution of tumors in K-Ras-β-catenin model. At 1 week after tail vein injection, Myc-positive isolated hepatocytes were visible in pericentral regions in both G12D-K-Ras-S45Y-β-catenin and G12D-K-Ras-S33Y-β-catenin group (Figure 2A and 2B). Only around 1% of hepatocytes showed Myc-positivity at this time. By 2 weeks, focal expansion of Myc-positive hepatocytes to a few cells were evident in G12D-K-Ras-S45Y-β-catenin group whereas mostly Myc-positive single hepatocytes were still evident in the G12D-K-Ras-S33Y-β-catenin group. At 3 weeks in the G12D-K-Ras-S45Y-β-catenin group, several islands of Myc-positive hepatocytes were evident while only a few isolated clones of Myc-positive cells were visible in the G12D-K-Ras-S33Y-β-catenin group at this time. At 4 weeks in the G12D-K-Ras-S45Y-β-catenin group and at 6 weeks in the G12D-K-Ras-S33Y-β-catenin group, large areas composed of Myc-positive tumor cells were evident throughout liver sections (Figure 2A and 2B).
Figure 2. Immunohistochemistry for Myc-tag shows tumor initiation and evolution in G12D-K-Ras-S45Y-β-catenin and G12D-K-Ras-S33Y-β-catenin mice.
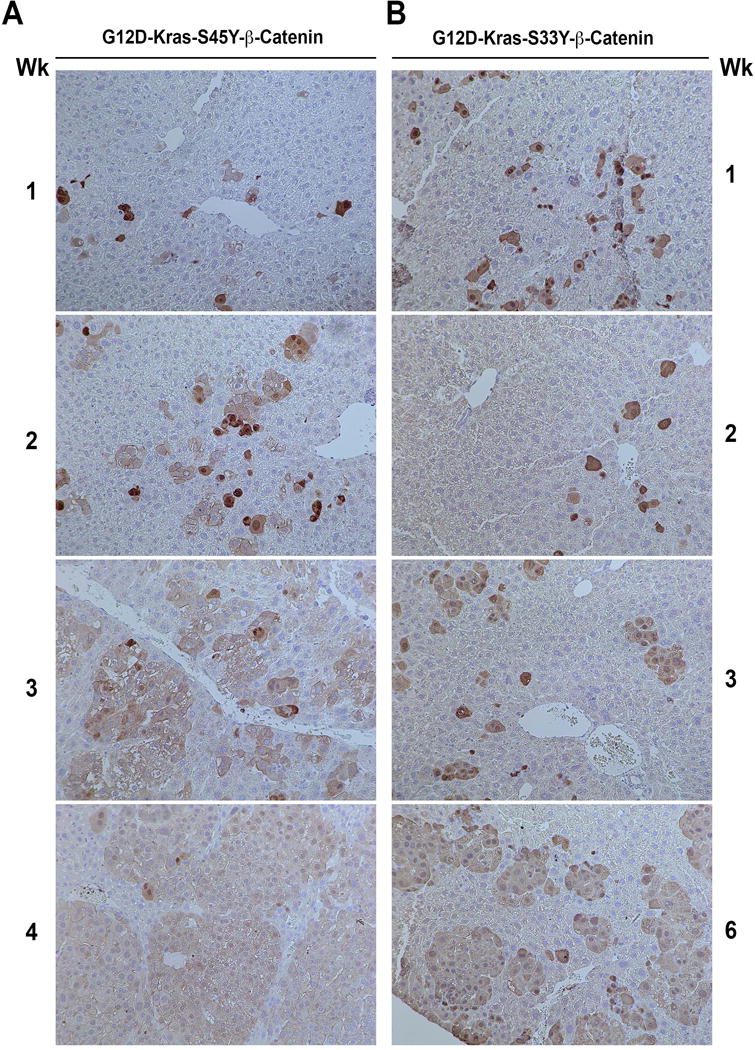
(A) In G12D-K-Ras-S45Y-β-catenin livers, one week after injection, isolated hepatocytes are positive for antibody against Myc-tag. These cells continue to expand to form foci at 2 and 3 weeks and by 4 weeks almost the entire liver is filled with large areas that are positive for Myc-tag with non-transformed hepatocytes pushed in between the nodules.
(B) In G12D-K-Ras-S33Y-β-catenin livers, 1 week and 2 weeks after injection, isolated hepatocytes are positive for Myc-tag. A small expansion in Myc-positive foci is evident at 3 weeks followed by further expansion at 6 weeks.
High molecular similarity between K-Ras-β-catenin and hMet-β-catenin tumors
Since the tumors in K-Ras-β-catenin model histologically resembled HCCs that occurred in the previously published hMet-β-catenin model and we hypothesized that Ras activation downstream of hMet may be cooperating with mutant β-catenin in hepatocarcinogenesis, we next performed microarray analysis on RNA isolated from tumor-bearing livers in the K-Ras-β-catenin model. We first compared gene expression profiles of tumor-bearing livers from G12D-K-Ras-S45Y-β-catenin and G12D-K-Ras-S33Y-β-catenin mice. The correspondence between fold change in the two models is depicted as a scatter plot (Online Figure 1). Changes in both models were qualitatively similar but there were 82 genes that were significantly different (Q-value FDR <0.2) between the two models (Pearson correlation coefficient = 0.91; p<1e-16). There is a general trend towards the G12D-K-Ras-S45Y-β-catenin model producing changes of smaller magnitude. All significantly different genes are marked orange and the top 30 are labeled.
Further, greater than 90% concordance between the gene expression of tumor-bearing livers from G12D-K-Ras-S45Y-β-catenin and G12D-K-Ras-S33Y-β-catenin mice, and tumor-bearing livers from hMet-S45Y-β-catenin and hMet-S33Y-β-catenin mice was observed as reflected by the Pearson correlation coefficient of 0.9124766 (p=2.2e-16) (Figure 3A). However, there were there were 873 genes that were significantly different (Q-value FDR <0.2) between the two though most of these differences were small in magnitude. The genes that were significantly different between the two are marked in orange and the top 50 are labeled (Figure 3A).
Figure 3. RNA and protein expression analysis of tumor-bearing G12D-K-Ras-S45Y/S33Y-β-catenin and hMet-S45Y/S33Y-β-catenin livers.
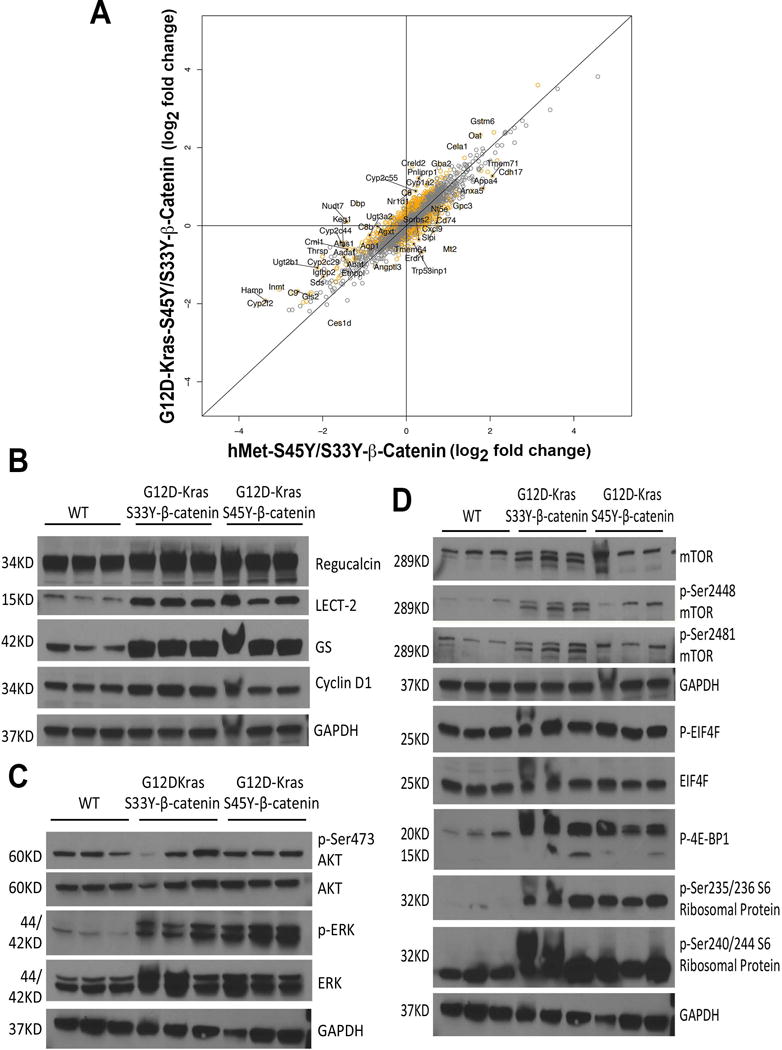
(A) Comparison of log2 fold changes in gene expression between G12D-K-Ras-S45Y/S33Y-β-catenin and hMet-S45Y/S33Y-β-catenin livers shows that the expression programs in these groups are highly similar, with a Pearson correlation of 0.9124766 (p=2.2e-16). While the changes in G12D-K-Ras-S45Y/S33Y-β-catenin and hMet-S45Y/S33Y-β-catenin livers were very similar, there were 873 genes that were significantly different (Q-value FDR <0.2) between the two though most of these differences were small in magnitude. The correspondence between fold change in the G12D-K-Ras-S45Y/S33Y-β-catenin and hMet-S45Y/S33Y-β-catenin models is depicted in the scatter plot. All genes that were significantly different between the two are marked orange and the top 50 are labeled.
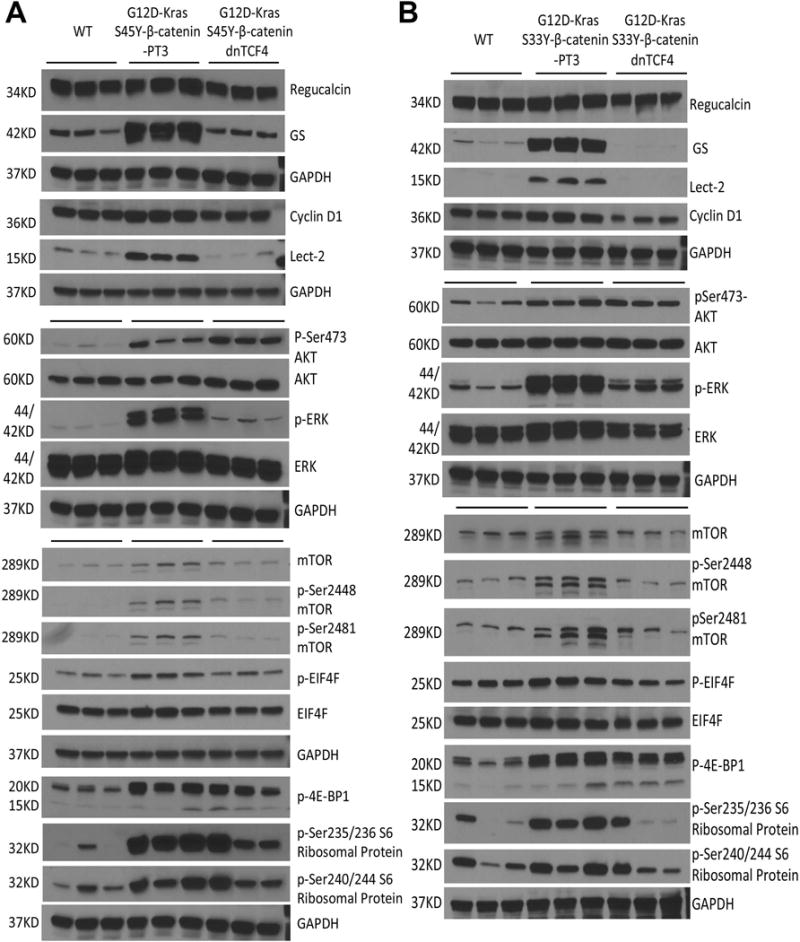
(B) Whole-cell lysates from G12D-K-Ras-S45Y-β-catenin and G12D-K-Ras-S33Y-β-catenin livers showed dramatic increase in the levels of Lect2 and GS, and modest increase in the levels of regucalcin and cyclin-D1 as compared to age-matched wild type control (WT) FVB livers. Comparable loading was confirmed by GAPDH.
(C) Whole-cell lysates from G12D-K-Ras-S45Y-β-catenin and G12D-K-Ras-S33Y-β-catenin livers showed increased levels of P-ERK and comparable levels of ERK, p-Ser473-AKT and AKT compared to WT livers. Comparable loading was confirmed by GAPDH.
(D) Western analysis of liver whole-cell lysates from G12D-K-Ras-S45Y-β-catenin and G12D-K-Ras-S33Y-β-catenin mice showed modest increases in the levels of p-Ser2448- and p-Ser2481-mTOR, while total mTOR remained unchanged. Meanwhile, increased levels of p-4E-BP1 and p-Ser235/236 Ribosomal Protein and p-Ser240/244 Ribosomal Protein were observed in whole-cell lysates from the livers of G12D-K-Ras-S45Y-β-catenin and G12D-K-Ras-S33Y-β-catenin mice as compared to WT controls, whereas both p-EIF4E and EIF4E were comparable. Comparable loading was verified by GAPDH.
Activation of β-catenin, mTOR and ERK signaling evident in K-Ras-β-catenin livers
To elucidate the molecular mechanisms mediating tumor development in K-Ras-β-catenin model, we analyzed the key downstream signaling pathways of both β-catenin and Ras signaling cascades in tumor bearing livers. As compared to age-matched FVB control livers, both G12D-K-Ras-S45Y-β-catenin and G12D-K-Ras-S33Y-β-catenin livers showed an increase in multiple β-catenin targets by representative western blots. While modest increases in Regucalcin and cyclin-D1 were observed, dramatic increases were evident in levels of Lect2 and GS, which are considered surrogate targets of Wnt signaling in the liver (Figure 3B).
Next we examined the status of AKT/mTOR signaling in livers of G12D-K-Ras-S45Y-β-catenin and G12D-K-Ras-S33Y-β-catenin mice. No changes in total AKT or p-Ser473-AKT were observed when comparing control livers to G12D-K-Ras-S45Y-β-catenin and G12D-K-Ras-S33Y-β-catenin livers (Figure 3C). However, a notable increase in p-ERK was observed in K-Ras-β-catenin livers as compared to controls (Figure 3C). Despite no changes in AKT, we next looked at mTOR signaling. While total mTOR remained unchanged, a modest increase in p-Ser2448- and p-Ser2481-mTOR was observed in both G12D-K-Ras-S45Y-β-catenin and G12D-K-Ras-S33Y-β-catenin livers (Figure 4D). Also, no change in p-EIF4E or total EIF4E were observed but both p-4E-BP1 and p-Ser235/236- and p-Ser240/244-S6 Ribosomal Protein were evident in G12D-K-Ras-S45Y-β-catenin and G12D-K-Ras-S33Y-β-catenin group as compared to control livers (Figure 3D).
Figure 4. Survival and tumorigenesis in G12D-K-Ras-S45Y-β-catenin-dnTCF4 and G12D-K-Ras-S33Y-β-catenin-dnTCF4 mice.
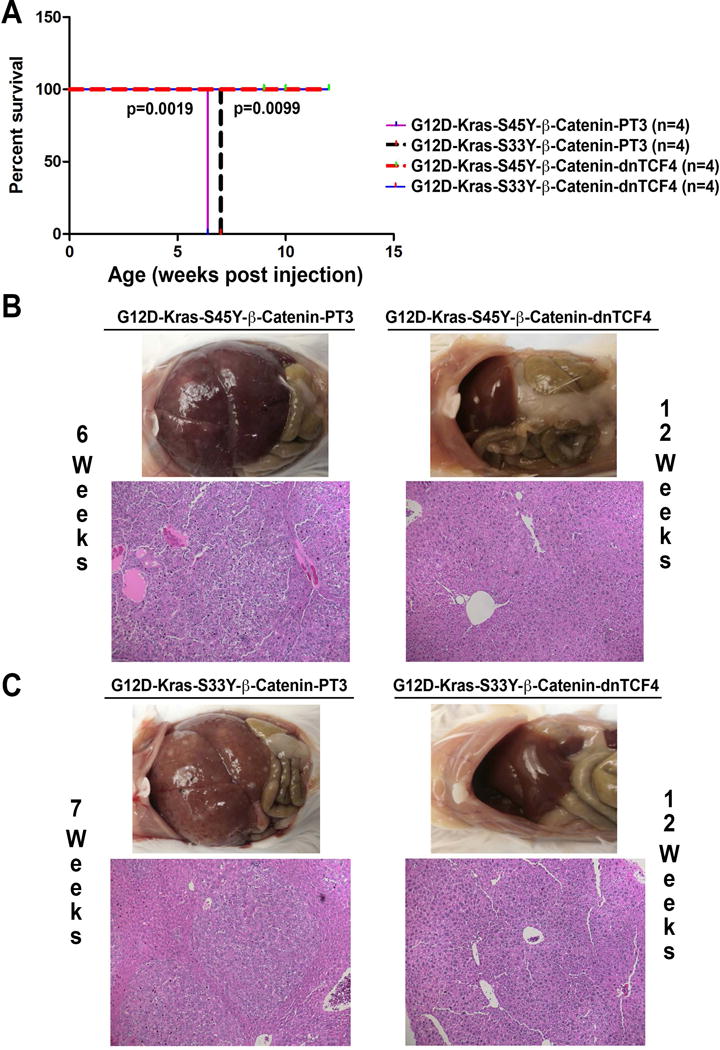
(A) Kaplan-Meier curve comparing survival of FVB mice injected with G12D-K-Ras-S45Y-β-catenin, G12D-K-Ras-S33Y-β-catenin, G12D-K-Ras-S45Y-β-catenin-dnTCF4 or G12D-K-Ras-S33Y-β-catenin-dnTCF4. G12D-K-Ras-S45Y-β-catenin-dnTCF4 and G12D-K-Ras-S33Y-β-catenin-dnTCF4 mice showed no overt phenotype up to 12 weeks after injection by which time 100% mortality was evident in G12D-K-Ras-S45Y-β-catenin and G12D-K-Ras-S33Y-β-catenin mice.
(B) G12D-K-Ras-S45Y-β-catenin mice showed notable gross and histological tumor burden by 6 weeks, whereas G12D-K-Ras-S45Y-β-catenin-dnTCF4 mice showed absence of gross or microscopic disease even at 12 weeks.
(C) While G12D-K-Ras-S33Y-β-catenin mice showed notable gross or microscopic tumor burden by 7 weeks, G12D-K-Ras-S33Y-β-catenin-dnTCF4 mice showed absence of gross or microscopic disease even at 12 weeks.
Thus, while β-catenin and ERK activation was unequivocally evident in K-Ras-β-catenin model, activation of AKT/mTOR was also evident although with minor discrepancies.
Transcriptionally active β-catenin is essential for hepatocarcinogenesis in association with K-Ras
As a transcriptional co-activator, β-catenin functions via interacting with a panel of transcription factors, such as TCF family to promote gene expression. To determine whether TCF4 is the transcription factor required for K-Ras-β-catenin induced tumors, we co-delivered K-Ras-mutant-β-catenin (S45Y or S33Y) along with dominant-negative TCF4 (dnTCF4), which lacks the ability to bind to the promoter of its target genes, to the mice liver through hydrodynamic tail vein injection. Administration of G12D-K-Ras-S45Y-β-catenin-dnTCF4 or G12D-K-Ras-S33Y-β-catenin-dnTCF4 completely prevented tumor development in mice even up to 12 weeks post injection by which time 100% mortality was evident in G12D-K-Ras-S45Y-β-catenin and G12D-K-Ras-S33Y-β-catenin groups (Figure 4A). As expected, G12D-K-Ras-S45Y-β-catenin mice showed enormous tumor burden by 6 weeks, while G12D-K-Ras-S45Y-β-catenin-dnTCF4 mice showed absence of gross or microscopic disease even at 12 weeks (Figure 4B). Similarly, by 7 weeks, G12D-K-Ras-S33Y-β-catenin livers showed notable gross and histological evidence of notable tumor burden, while G12D-K-Ras-S33Y-β-catenin-dnTCF4 livers were completely devoid of tumors grossly or microscopically even at 12 weeks after injection (Figure 4C).
We next assessed livers from G12D-K-Ras-S45Y-β-catenin and G12D-K-Ras-S45Y-β-catenin-dnTCF4 mice as well as G12D-K-Ras-S33Y-β-catenin and S33Y-β-catenin-dnTCF4 mice to address molecular changes specifically interrupted by lack of β-catenin-TCF4 activation. A modest decrease in Regucalcin and cyclin-D1 and a dramatic decrease in Lect2 and GS were evident in dnTCF4-injected cohorts in both forms of β-catenin mutants (Figure 5). Intriguingly, we were unable to find any differences in either AKT or p-Ser473-AKT in the presence of dnTCF4. A dramatic decrease in p-ERK in the presence of dnTCF4 suggests a true cooperation of β-catenin and K-Ras in this model of HCC (Figure 5). To determine if mTOR signaling could be impacted despite lack of changes in AKT, we examined mTOR levels, its phosphorylation and downstream effectors. We observed modest decreases in both total and p-Ser2448- and p-Ser2481-mTOR in G12D-K-Ras-S45Y-β-catenin-dnTCF4 and G12D-K-Ras-S33Y-β-catenin-dnTCF4 as compared to their respective non-TCF4 counterparts (Figure 5). Consistent with these observations a modest decrease in p-EIF4E, p-4E-BP1, p-Ser235/236 S6 Ribosomal Protein and p-Ser240/244 S6 Ribosomal Protein were evident in livers that were dnTCF4-injected (Figure 5)
Figure 5. Molecular changes associated with lack of β-catenin activation in G12D-K-Ras-S45Y-β-catenin-dnTCF4 and G12D-K-Ras-S33Y-β-catenin-dnTCF4 livers.
(A) Whole-cell lysates from G12D-K-Ras-S45Y-β-catenin-dnTCF4 livers showed decreased levels of β-catenin targets, of which Lect2 and GS were decreased dramatically and regucalcin and cyclin-D1 were decreased modestly as compared to G12D-K-Ras-S45Y-β-catenin-PT3 to become comparable to FVB wild-type (WT) control livers. Also a dramatic decrease in P-ERK was observed while the total ERK was comparable to controls. No changes in the levels of both p-Ser473-AKT and total AKT were found in G12D-K-Ras-S45Y-β-catenin-dnTCF4 lysates. Also observed in these livers were modest decreases in total and p-Ser2448-mTOR, p-Ser2481-mTOR, p-EIF4E, p-4E-BP1, p-Ser235/236 S6 Ribosomal Protein and p-Ser240/244 S6 Ribosomal Protein. Comparable loading was confirmed by GAPDH
(B) Whole-cell lysates from G12D-K-Ras-S33Y-β-catenin-dnTCF4 livers showed decreases in β-catenin targets, p-ERK, total and p-Ser2448- and p-Ser2481-mTOR, p-EIF4E, p-4E-BP1, p-Ser235/236 S6 Ribosomal Protein and p-Ser240/244 S6 Ribosomal Protein as compared to G12D-K-Ras-S33Y-β-catenin-PT3 controls. No changes in total ERK, p-Ser473-AKT or total AKT in G12D-K-Ras-S33Y-β-catenin-dnTCF4 lysates as compared to controls. Equal loading was verified by GAPDH.
These observations indicate that the interaction of β-catenin-TCF4 is critical to cooperate with K-Ras in inducing liver tumors in mice and that disruption of β-catenin-TCF4 activity completely impairs β-catenin and Ras-Raf-MEK-ERK signaling and partially blocks AKT/mTOR activation.
β-Catenin suppression in established HCC is effective in significantly decreasing tumor burden
To determine the efficacy of therapeutically targeting β-catenin in HCC, we next investigated the use of Lipid nanoparticles (LNP) to enable tumor-selective delivery of a Dicer-substrate siRNA targeting CTNNB1 (CTNNB1-LNP). Tumor-specific uptake of the LNP has been enabled by a specific chemical composition and manufacturing process as described (14). Since tumors were identical between the G12D-K-Ras-S45Y-β-catenin and G12D-K-Ras-S33Y-β-catenin mice, we selected G12D-K-Ras-S45Y-β-catenin model to investigate therapeutic effect of β-catenin suppression. Five weeks after hydrodynamic injection of G12D-K-Ras-S45Y-β-catenin, mice were stratified into 3 groups, which received intravenously either CTNNB1-LNP or Scrambled LNP (Scr. LNP) or PBS alone. The intravenous injections were given via tail vein and for three cycles each of 3 injections given every 24 hours followed by a 4-day rest period as shown in Figure 6A. Mice were sacrificed 4 days after the end of 1st cycle, 2nd cycle or 3rd cycle. A significant decrease in liver weight/body ratio (LW/BW) as an indicator of tumor burden was evident in CTNNB1-LNP group at all stages when compared to either PBS or Scr. LNP group (Figure 6B). This difference was appreciable grossly as as shown in Figure 6C lacked overt tumors in CTNNB1-LNP treated group for 3 cycles versus the Scr. LNP treatment for same duration (Figure 6C). To determine the effect of β-catenin suppression on HCCs, we stained livers from animals in Scr. LNP and CTNNB1-LNP after 2 or 3 cycles for Myc-tag, since all tumors in K-Ras-β-catenin model were Myc-tag-positive (Figure 2). As shown in representative tiled images, a dramatic decrease in numbers of Myc-tag-positive tumor nodules were evident after both 2 cycles and 3 cycles of CTNNB1-LNP as compared to Scr. LNP (Figure 6D).
Figure 6. Suppression of β-catenin by CTNNB1-LNP in G12D-K-Ras-S45Y-β-catenin mouse model with established HCC relieved tumor burden.
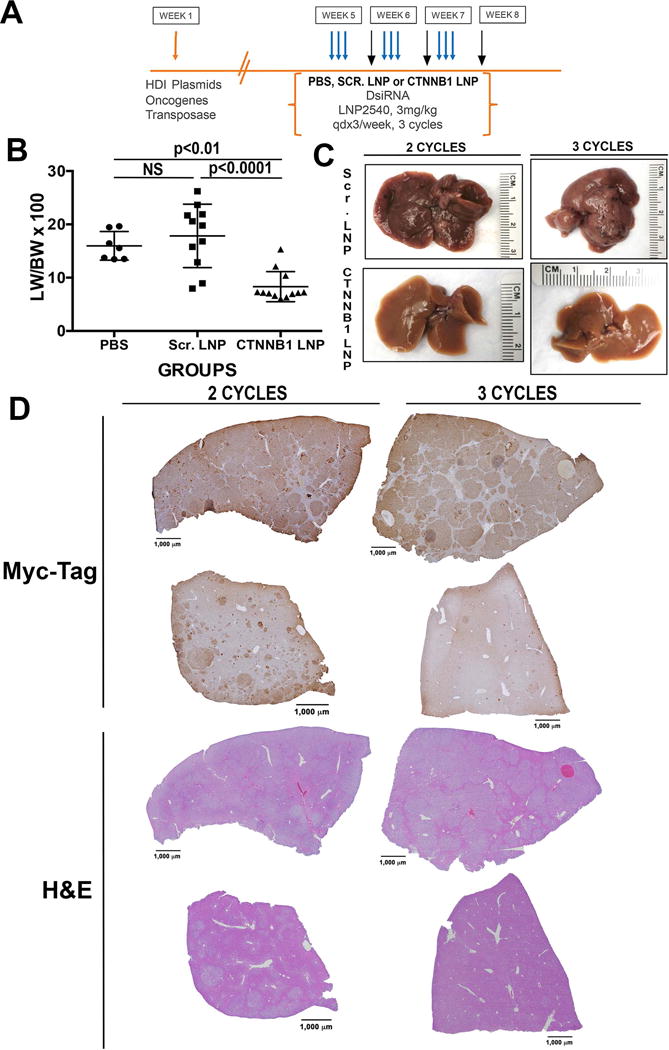
(A) Dosing regimen in G12D-K-Ras-S45Y-β-catenin mice. Five weeks after injection of plasmids, mice were randomized into three groups which received 1, 2 or 3 cycles of either PBS, EnCore-LNP carrying DsiRNA against scrambled sequence (Scr. LNP) or EnCore-LNP carrying DsiRNA against β-catenin gene (CTNNB1-LNP). Each cycle consisted of 3 consecutive tail vein injections spread 24 hours apart (indicated by the blue arrows) followed by a 4-day rest period. Mice were sacrificed 4 days after the end of 1st cycle, 2nd cycle or 3rd cycle (indicated by the black arrows).
(B) Bar graph showing a significant decrease in tumor burden in CTNNB1-LNP injected group as compared to PBS (p<0.01) and Scr. LNP (p<0.0001) controls as reflected in liver weight/body weight ratios (LW/BW).
(C) Gross images of exposed livers in G12D-K-Ras-S45Y-β-catenin mice after 3 cycles treatment of either Scr. LNP or CTNNB1-LNP shows a notable decreases in tumor burden in CTNNB1-LNP group.
(D) Representative tiled images for immunohistochemical stain with Myc-tag from after 2 or 3 cycles of treatment, along with corresponding H&E images, showing dramatic decrease in the numbers of tumor nodules in the CTNNB1-LNP group as compared to Scr. LNP treatment.
Since GS is a surrogate target of mutant β-catenin, we next compared GS by immunohistochemistry in livers from G12D-K-Ras-S45Y-β-catenin mice after 1, 2 and 3 cycles of either CTNNB1-LNP or Scr. LNP. A dramatic decrease in GS-positive areas was observed after β-catenin suppression after any and all cycles of CTNNB1-LNP as compared to Scr. LNP (Figure 7A). Further, cyclin-D1, which is also regulated by β-catenin in the liver (15), although its regulation can be promiscuous, was strongly positive in tumor nodules after 1, 2 or 3 cycles of Scr. LNP delivery to G12D-K-Ras-S45Y-β-catenin (Figure 7B). However, a dramatic decrease in cyclin-D1 staining was evident after 1 and 2 cycles of CTNNB1-LNP while it’s staining was more midzonal after 3 cycles, similar to its normal localization in adult mice (Figure 7B) (16).
Figure 7. Decrease in β-catenin targets is evident after CTNNB1-LNP treatment of G12D-K-Ras-S45Y-β-catenin mice.
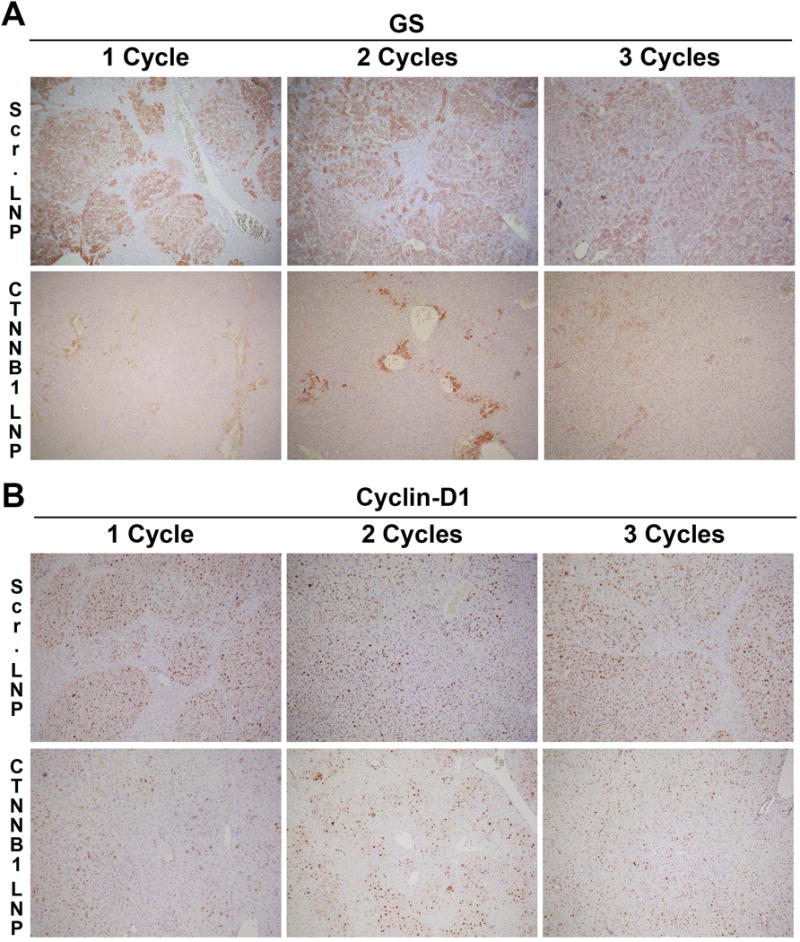
(A) Representative immunohistochemical staining of liver sections from G12D-K-Ras-S45Y-β-catenin mice showed a dramatic decrease in GS in CTNNB1-LNP treatment as compared to Scr. LNP in all cycles of treatment.
(B) Representative immunohistochemical staining of the same liver sections with cyclin-D1 also showed a dramatic decrease in cyclin-D1 as compared to Scr. LNP group. During progressive cycles, cyclin-D1 localization became more normalized showing midzonal staining.
Rare mouse shows incomplete response to CTNNB1-LNP due to tumor heterogeneity and expansion of GS-negative tumors in K-Ras-β-catenin
We next wanted to address if tumors occurring in G12D-K-Ras-S45Y-β-catenin mouse model were homogeneous. This was due to the fact that occasional mouse in the CTNNB1-treatment cohort lacked a comparably pronounced response to treatment as majority of animals as observed by a modest decrease in LW/BW. To address any tumor heterogeneity, we carefully surveyed tumors in G12D-K-Ras-S45Y-β-catenin livers at 6 and 7 weeks for GS-positivity. Intriguingly, while predominant HCC nodules in this model were strongly GS-positive, there were occasional nodules that lacked any GS staining (Online Figure 2A). These GS-negative nodules ranged from 1–5% in frequency over all animals tested. Since GS in HCC is regulated exclusively by β-catenin, we next examined if these tumors still were composed of mutant β-catenin that was hydrodynamically delivered and contained a Myc-tag. Serial sections from two representative G12D-K-Ras-S45Y-β-catenin livers showed that all tumor nodules were Myc-tag-positive, but a small subset of these mutant-β-catenin containing tumors were GS-negative (Online Figure 2B). Lastly, we investigated if partial resistance to CTNNB1-LNP treatment could be due to growth of mutant-β-catenin-positive, non-GS-positive tumors over time, we assessed serial sections for Myc-tag and GS after 3 cycles of CTNNB1-LNP treatment. As shown in a representative tiled image, remnant disease in one liver lobe was evident in the form of Myc-positive tumor nodules, however these nodules were almost exclusively GS-negative (Online Figure 2C). These observations suggest that β-catenin suppression may be effective in GS-positive HCCs.
Tumor regression following β-catenin suppression is due to impairment in β-catenin signaling and partial inhibition of mTOR signaling
Next we assessed tumor livers from controls, Scr. LNP-treated and CTNNB1-LNP-treated G12D-K-Ras-S45Y-β-catenin mice for β-catenin signaling by western blot analysis. For the latter two groups, we included a sample each from after 1-cycle, 2-cycles and 2 samples from after 3-cycles of treatment. A time-dependent decrease in direct β-catenin targets including GS, Lect2, Regucalcin and cyclin-D1 was evident along with decrease in Myc-tagged-β-catenin and a modest impact when examined for total β-catenin levels (Figure 8A). It should be noted that the CTNNB1-LNP in its current formulation was engineered to be selectively taken up by the tumor cells thus not impacting β-catenin in normal hepatocytes and non-parenchymal cells as published elsewhere (14).
Figure 8. CTNNB1-LNP treatment affects downstream signaling, cell proliferation and cell survival in G12D-K-Ras-S45Y-β-catenin mice.
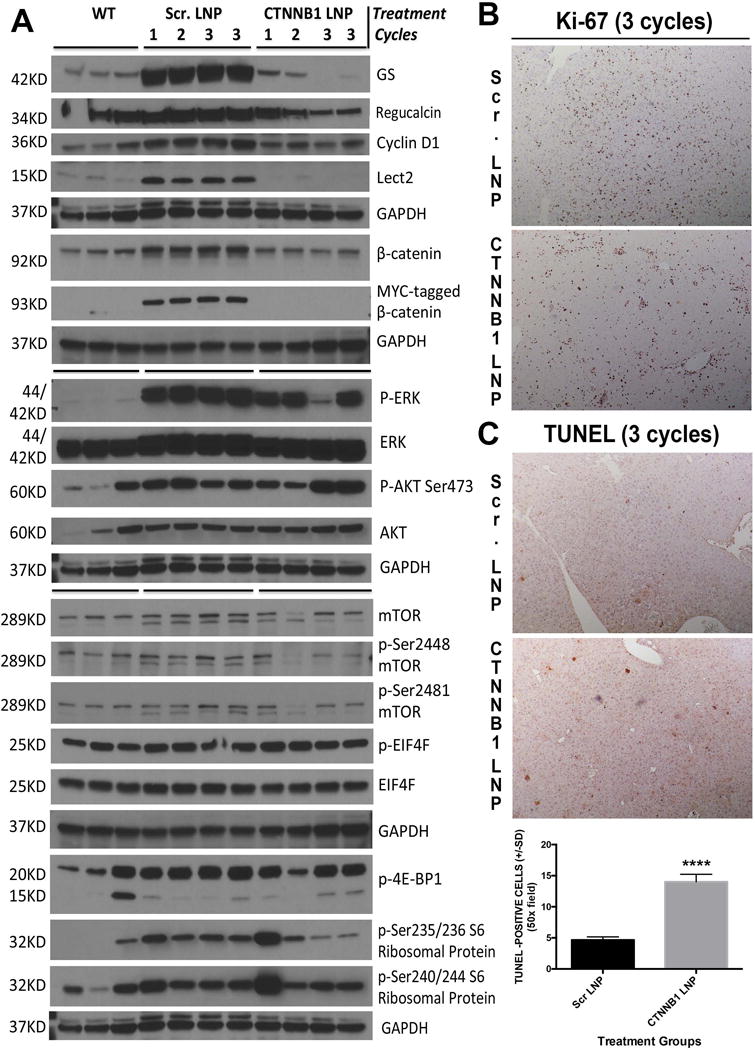
(A) Western blot analysis of liver whole-cell lysate from wild type controls (WT), Scr. LNP-treated or CTNNB1-LNP-treated G12D-K-Ras-S45Y-β-catenin mice for the molecular changes associated with the suppression of β-catenin. For the latter two groups, we included a sample each from after 1-cycle, 2-cycles and 2 samples from after 3-cycles of treatment. A complete loss of Myc-tagged-β-catenin and normalization in total β-catenin levels was evident at all times after CTNNB1 treatment. A time-dependent decrease in β-catenin targets including GS, Regucalcin, cyclin-D1 and Lect2 was observed after CTNNB1-LNP treatment. Modest decreases in P-ERK, p-Ser2448-mTOR, p-Ser2481-mTOR, p-4E-BP1, p-Ser235/236 S6 Ribosomal Protein and p-Ser240/244 S6 Ribosomal Protein and no changes or even increases in p-Ser473-AKT and p-EIF4E were evident. Equal loading was verified by GAPDH.
(B) Representative immunohistochemical staining of liver section (50x) with Ki-67 from G12D-K-Ras-S45Y-β-catenin mice after 3 cycles of CTNNB1-LNP treatment showed notable decrease in positive cells as compared to Scr. LNP-treated liver section.
(C) Representative TUNEL staining of liver sections (50x) from G12D-K-Ras-S45Y-β-catenin mice after 3 cycles of CTNNB1-LNP treatment showed increased number of TUNEL-positive cells as compared to the Scr. LNP group. Bar graph shows a significant difference (****p<0.0001) in the number of TUNEL-positive cells when two groups were compared.
We next investigated the impact of mutant-β-catenin suppression in established HCCs for any affect on Ras-Raf-MEK-ERK signaling and AKT-mTOR signaling. Only a modest impact on p-ERK was evident in CTNNB1-LNP treated group as compared to Scr. LNP while no clear differences were evident in AKT or p-Ser473-AKT, which actually showed an increase after 3 cycles of β-catenin suppression (Figure 8A). Effect on mTOR signaling was modest and somewhat ambiguous after CTNNB1-LNP treatment. Modest decrease in p-Ser2448- and p-Ser2481-mTOR was observed after β-catenin suppression, along with a decrease in p-EIF4E and p-Ser235/236 S6 Ribosomal Protein (Figure 8A). However, no decrease was observed in p-4E-BP1 or p-Ser240/244 S6 Ribosomal Protein.
These observations suggest that the most pronounced effect of β-catenin suppression in established HCC is on β-catenin signaling, while modestly affecting Ras-Raf-MEK-ERK and AKT-mTOR signaling to eventually cause disease regression.
Impaired proliferation and enhanced cell death is evident following β-catenin suppression in HCC
Lastly, we wanted to determine the biological effect of β-catenin suppression by CTNNB1-LNP on β-catenin signaling, and Ras-Raf-MEK-ERK and AKT-mTOR signaling in G12D-K-Ras-S45Y-β-catenin mice. We assessed the livers after 3 cycles of Scr. LNP and CTNNB1-LNP treatment for Ki-67, a marker of cells in S-phase of cell cycle. A notable decrease in the number of Ki-67-positive cells was clearly evident in β-catenin-suppressed livers (Figure 8B). To address cell death, we used IHC for TUNEL and identified a significant increase in numbers of TUNEL-positive cells in the CTNNB1-LNP group versus Scr. LNP group (p<0.0001) (Figure 8C). Thus β-catenin suppression in established HCC impairs cell survival and affects tumor cell proliferation to eventually lead to tumor regression.
DISCUSSION
Molecular therapies for HCC are lacking. Identification of key molecular aberrations in HCC that can be targeted are hence of high significance. Equally important are to have in vivo models that represent human disease to enable not only mechanistic studies but also allow therapeutic testing and validation. We previous showed that overexpressing hMet and mutant β-catenin in murine livers, which occurs concomitantly in around 9–12.5% of HCC cases in two large cohorts, led to HCC that recapitulated human HCC in that subset at a molecular level. In the current study we show that Ras activation downstream of such RTKs like hMet is sufficient to cooperate with CTNNB1 mutations to induce clinically relevant HCC. Gene expression from tumors in K-Ras-β-catenin model was identical to hMet-mutant-β-catenin model. Thus, K-Ras-β-catenin and hMet-mutant-β-catenin model recapitulate around 10% of all HCCs and are relevant models to study biology and therapeutics.
Ras activation is reported in large subsets of HCC cases ranging from 50–100% of all cases due to multiple mechanisms (reviewed in (17)). However, Ras activation due to mutations in KRAS are rare in human HCC, with one study reporting around 7% incidence (17)). We accessed COSMIC database (v78-released Sep 05, 2016), which showed 52 of 1730 HCC cases with K-Ras mutations (1.4%) (18). Of these, 17 had G12D mutations whereas additional 14 had other G12 mutations (G12C, G12V and G12S). Overall, G12 site was mutated in 60% of all K-Ras mutated HCCs. In our current study, activated K-Ras (G12D-K-Ras) expression by itself did not yield HCC, suggesting it may cooperate with another signaling pathway in tumorigenesis. Indeed N-Ras, another Ras family member, cooperates with molecules like S-Phase Kinase-Associated Protein 2 (SKP2) or AKT in promoting HCC in similar SB models (19, 20). Ras activation was also observed in hMet-mutant-β-catenin model (12). In current study, we observe Ras activation in G12D-K-Ras-S45Y-β-catenin and G12D-K-Ras-S33Y-β-catenin groups. Wnt pathway activation is reported in a notable subset of HCC patients albeit due to an array of mechanisms (Reviewed in (9)). CTNNB1 mutations are evident in 25–40% of HCC cases and are one such mechanism. Further, these HCCs are more differentiated, GS-positive, with relatively better overall survival (1, 21). However, expression of mutant-β-catenin alone is insufficient to induce HCC in transgenic models or via SB-induced expression, as also verified in the current study (10, 12). While its cooperation with hMet was reported in mice and patients previously, here we show its cooperation with Ras signaling, which a downstream effector of hMet. As expected, β-catenin activation was evident in G12D-K-Ras-S45Y-β-catenin and G12D-K-Ras-S33Y-β-catenin groups as shown by upregulation of many Wnt targets.
Suppression of β-catenin in K-Ras-mutant-β-catenin HCC model led to a notable reduction in tumors. Indeed, β-catenin suppression in mouse HCC model which harbors CTNNB1 mutations, showed a complete response to peptide nucleic acid antisense against β-catenin gene (22). Effect of β-catenin suppression on HCC may be the net result of suppression of several of its target genes such as Lect2, Regucalcin, cyclin-D1 and GS. While role of Regucalcin is mostly in vitamin C biosynthesis in murine livers, it role is unclear in human HCC (23). Lect2 is known to modulate tumor-related inflammatory response and has been suggested as a mechanism of why β-catenin-mutated tumors are less aggressive (24). We have identified Lect2 to be a secreted biomarker in HCC with CTNNB1 mutations, especially in mice (25). Cyclin-D1 is critical for G1 to S phase transition during cell cycle and hence its suppression due to inhibition of β-catenin is highly relevant as a mechanism of controlling HCC proliferation (12, 15). Indeed, a decrease in tumor cell proliferation was evident following β-catenin suppression. Lastly, role of GS in known tumor metabolism has been recently shown to be of great relevance. Since tumors depend on aerobic glycolysis, Glutamine is shown to be the source of carbons that replenish the TCA cycle. More recently, in Glioblastoma model, it was shown that source of Glutamine was not glutaminolysis but GS, and this glutamine was a source of purine biosynthesis (26). Since CTNNB1-mutated HCC are strongly GS-positive, since GS is a known direct target of Wnt signaling (27), a significant effect of β-catenin suppression on HCC may be due to GS loss and affect on tumor metabolism. Indeed CTNNB1-mutated tumors are shown to be Glutamine-addicted, and Glutamine depletion impaired growth of liver tumors with CTNNB1 mutations, both in vitro and in vivo (28, 29). In addition to Wnt targets, β-catenin suppression in K-Ras-mutant-β-catenin model also led to suppression of several p-ERK and mTOR, which are independently known to play an important role in tumor proliferation and survival. Hence β-catenin suppression in HCC has broader affects on signaling that impairs tumor cell proliferation and increases tumor cell death.
It was intriguing to note that blockade of β-catenin activation in mutant K-Ras-β-catenin model led to a profound decrease in ERK activation, modest affect on mTOR activation, but no effect on p-AKT. This suggests specific functional cooperation between the two pathways. Blockade of p-ERK by β-catenin suppression demonstrates a clear cooperation between Wnt and Ras signaling pathways in the current HCC model, which was also evident in hMet-mutant-β-catenin model (12). Similar affects on p-ERK and mTOR signaling were also observed when β-catenin was suppressed in existing HCCs with an overall impact on tumor cell survival and proliferation. AKT is well known regulator of mTOR, downstream of PI3K signaling (30). However, in our model, decrease in mTOR signaling was independent of any effect on AKT activation, which continued to occur despite β-catenin suppression. This suggests that AKT activation may be an upstream event of β-catenin and/or Ras/Raf/MEK/ERK signaling. Continued AKT activation following β-catenin suppression could also be due blockade of Ras/ERK, which can lead to AKT activation (30). How mTOR signaling is blocked following β-catenin suppression despite AKT activation? It is known that Ras/ERK signaling can also regulate mTOR activation (31). Hence decreased mTOR signaling following β-catenin suppression is likely a consequence of impaired ERK activation.
The use of LNP is an innovative modality to deliver agents for cancer therapeutics (32). We have recently shown Encore, an LNP system for delivery of DsiRNA to β-catenin-dependent tumors (14). EnCore LNPs represent a unique structural class of nanoparticles and are currently in clinical development for tumor delivery of RNAi triggers (33). Encore LNPs carrying CTNNB1-targeting DsiRNA delivered pharmacology-relevant intratumoral concentrations of the oligonucleotide, yielding mRNA silencing and anti-tumor efficacy in multiple mouse models including cell-line derived xenografts, orthotopic patient-derived xenografts, disseminated hematological tumors, CRC liver metastases, experimental lung metastases and spontaneous liver tumors induced by specific genetic drivers (14). In fact, using Kras-mutant-β-catenin model, we showed tumor-specific uptake of the Encore LNP suggesting this modality to be a timely and innovative means for cancer therapeutics.
It was intriguing to note that even in a model such as mutant-K-Ras-β-catenin, which uses a reductionist approach with only two oncogenes being delivered together, there was some tumor heterogeneity. While a 100% of tumors contained mutant-β-catenin as shown by Myc-tag-positivity and GS-positivity, occasional Myc-tag-positive tumor nodule was GS-negative. The basis of this observation in such seemingly homogeneous model is unclear, but does demonstrate that even within CTNNB1-mutated group of tumors, there may be subclasses and GS may be a relevant biomarker of those tumors, which are most vulnerable to β-catenin suppression. It should be noted that β-catenin activation in HCC in patients is already known to be disparate. While one class of β-catenin activation is due to CTNNB1 mutations, other classes of HCC show β-catenin activation due to TGFβ activation (34), AXIN1 mutations ((35)) or other mechanisms. All of these groups cluster differently in terms of prognosis, etiology and even association with other functional oncogenic aberrations to result in HCC (21). Thus, even within CTNNB1-mutated group and in cooperation with only one oncogene K-Ras, there appears to be some heterogeneity, which led to differential response to β-catenin suppression therapy. All GS-positive, β-catenin-positive tumors showed notable involution, but GS-negative, β-catenin+ tumors appeared to be unaffected and a small subset of animals showed remnant disease composed of GS-negative, β-catenin-positive tumors, albeit still significantly less than Scr. LNP or PBS-treated controls. The molecular basis of this differential response is currently under investigation.
Thus, in conclusion, we show that Ras signaling, downstream of RTKs like hMet cooperates with β-catenin mutations to cause HCC in mice and patients. And that β-catenin suppression by itself is sufficient to profoundly reduce tumor burden in this clinically relevant model. Since Encore therapeutic modality is timely and relevant, its use in patients, which show GS+, β-catenin+ HCCs, may be highly relevant.
Supplementary Material
Acknowledgments
This study was funded by National Institutes of Health grants 1R01DK62277, 1R01DK100287, and 1R01CA204586; and an Endowed Chair for Experimental Pathology. This study was also in part funded by a corporate research agreement from Dicerna Pharmaceuticals.
Footnotes
Conflict of interest:
Part of the study was funded by a corporate research agreement from Dicerna Pharmaceuticals to SPM. SPM is also a consultant for Abbvie Pharmaceuticals. SG and MA are employees of Dicerna Pharmaceuticals.
References
- 1.Zucman-Rossi J, Villanueva A, Nault JC, Llovet JM. Genetic Landscape and Biomarkers of Hepatocellular Carcinoma. Gastroenterology. 2015;149:1226–1239 e1224. doi: 10.1053/j.gastro.2015.05.061. [DOI] [PubMed] [Google Scholar]
- 2.Ryerson AB, Eheman CR, Altekruse SF, Ward JW, Jemal A, Sherman RL, Henley SJ, et al. Annual Report to the Nation on the Status of Cancer, 1975–2012, featuring the increasing incidence of liver cancer. Cancer. 2016;122:1312–1337. doi: 10.1002/cncr.29936. [DOI] [PMC free article] [PubMed] [Google Scholar]
- 3.Hashim D, Boffetta P, La Vecchia C, Rota M, Bertuccio P, Malvezzi M, Negri E. The global decrease in cancer mortality: trends and disparities. Ann Oncol. 2016;27:926–933. doi: 10.1093/annonc/mdw027. [DOI] [PubMed] [Google Scholar]
- 4.Newell P, Toffanin S, Villanueva A, Chiang DY, Minguez B, Cabellos L, Savic R, et al. Ras pathway activation in hepatocellular carcinoma and anti-tumoral effect of combined sorafenib and rapamycin in vivo. J Hepatol. 2009;51:725–733. doi: 10.1016/j.jhep.2009.03.028. [DOI] [PMC free article] [PubMed] [Google Scholar]
- 5.Calvisi DF, Ladu S, Gorden A, Farina M, Conner EA, Lee JS, Factor VM, et al. Ubiquitous activation of Ras and Jak/Stat pathways in human HCC. Gastroenterology. 2006;130:1117–1128. doi: 10.1053/j.gastro.2006.01.006. [DOI] [PubMed] [Google Scholar]
- 6.Karnoub AE, Weinberg RA. Ras oncogenes: split personalities. Nat Rev Mol Cell Biol. 2008;9:517–531. doi: 10.1038/nrm2438. [DOI] [PMC free article] [PubMed] [Google Scholar]
- 7.Saha SK, Parachoniak CA, Ghanta KS, Fitamant J, Ross KN, Najem MS, Gurumurthy S, et al. Mutant IDH inhibits HNF-4alpha to block hepatocyte differentiation and promote biliary cancer. Nature. 2014;513:110–114. doi: 10.1038/nature13441. [DOI] [PMC free article] [PubMed] [Google Scholar]
- 8.O’Dell MR, Huang JL, Whitney-Miller CL, Deshpande V, Rothberg P, Grose V, Rossi RM, et al. Kras(G12D) and p53 mutation cause primary intrahepatic cholangiocarcinoma. Cancer Res. 2012;72:1557–1567. doi: 10.1158/0008-5472.CAN-11-3596. [DOI] [PMC free article] [PubMed] [Google Scholar]
- 9.Monga SP. beta-Catenin Signaling and Roles in Liver Homeostasis, Injury, and Tumorigenesis. Gastroenterology. 2015;148:1294–1310. doi: 10.1053/j.gastro.2015.02.056. [DOI] [PMC free article] [PubMed] [Google Scholar]
- 10.Nejak-Bowen KN, Thompson MD, Singh S, Bowen WC, Jr, Dar MJ, Khillan J, Dai C, et al. Accelerated liver regeneration and hepatocarcinogenesis in mice overexpressing serine-45 mutant beta-catenin. Hepatology. 2010;51:1603–1613. doi: 10.1002/hep.23538. [DOI] [PMC free article] [PubMed] [Google Scholar]
- 11.Mokkapati S, Niopek K, Huang L, Cunniff KJ, Ruteshouser EC, deCaestecker M, Finegold MJ, et al. beta-catenin activation in a novel liver progenitor cell type is sufficient to cause hepatocellular carcinoma and hepatoblastoma. Cancer Res. 2014;74:4515–4525. doi: 10.1158/0008-5472.CAN-13-3275. [DOI] [PMC free article] [PubMed] [Google Scholar]
- 12.Tao J, Xu E, Zhao Y, Singh S, Li X, Couchy G, Chen X, et al. Modeling a Human HCC Subset in Mice Through Co-Expression of Met and Point-Mutant beta-Catenin. Hepatology. 2016 doi: 10.1002/hep.28601. [DOI] [PMC free article] [PubMed] [Google Scholar]
- 13.Chen X, Calvisi DF. Hydrodynamic transfection for generation of novel mouse models for liver cancer research. Am J Pathol. 2014;184:912–923. doi: 10.1016/j.ajpath.2013.12.002. [DOI] [PMC free article] [PubMed] [Google Scholar]
- 14.Ganesh S, Koser M, Cyr W, Chopda G, Tao J, Shui X, Ying B, et al. Direct pharmacological inhibition of beta-catenin by RNA interference in tumors of diverse origin. Mol Cancer Ther. 2016 doi: 10.1158/1535-7163.MCT-16-0309. [DOI] [PMC free article] [PubMed] [Google Scholar]
- 15.Tan X, Behari J, Cieply B, Michalopoulos GK, Monga SP. Conditional deletion of beta-catenin reveals its role in liver growth and regeneration. Gastroenterology. 2006;131:1561–1572. doi: 10.1053/j.gastro.2006.08.042. [DOI] [PubMed] [Google Scholar]
- 16.Huang J, Schriefer AE, Cliften PF, Dietzen D, Kulkarni S, Sing S, Monga SP, et al. Postponing the Hypoglycemic Response to Partial Hepatectomy Delays Mouse Liver Regeneration. Am J Pathol. 2016;186:587–599. doi: 10.1016/j.ajpath.2015.10.027. [DOI] [PMC free article] [PubMed] [Google Scholar]
- 17.Delire B, Starkel P. The Ras/MAPK pathway and hepatocarcinoma: pathogenesis and therapeutic implications. Eur J Clin Invest. 2015;45:609–623. doi: 10.1111/eci.12441. [DOI] [PubMed] [Google Scholar]
- 18.Forbes SA, Beare D, Gunasekaran P, Leung K, Bindal N, Boutselakis H, Ding M, et al. COSMIC: exploring the world’s knowledge of somatic mutations in human cancer. Nucleic Acids Res. 2015;43:D805–811. doi: 10.1093/nar/gku1075. [DOI] [PMC free article] [PubMed] [Google Scholar]
- 19.Delogu S, Wang C, Cigliano A, Utpatel K, Sini M, Longerich T, Waldburger N, et al. SKP2 cooperates with N-Ras or AKT to induce liver tumor development in mice. Oncotarget. 2015;6:2222–2234. doi: 10.18632/oncotarget.2945. [DOI] [PMC free article] [PubMed] [Google Scholar]
- 20.Ho C, Wang C, Mattu S, Destefanis G, Ladu S, Delogu S, Armbruster J, et al. AKT (v-akt murine thymoma viral oncogene homolog 1) and N-Ras (neuroblastoma ras viral oncogene homolog) coactivation in the mouse liver promotes rapid carcinogenesis by way of mTOR (mammalian target of rapamycin complex 1), FOXM1 (forkhead box M1)/SKP2, and c-Myc pathways. Hepatology. 2012;55:833–845. doi: 10.1002/hep.24736. [DOI] [PMC free article] [PubMed] [Google Scholar]
- 21.Schulze K, Imbeaud S, Letouze E, Alexandrov LB, Calderaro J, Rebouissou S, Couchy G, et al. Exome sequencing of hepatocellular carcinomas identifies new mutational signatures and potential therapeutic targets. Nat Genet. 2015;47:505–511. doi: 10.1038/ng.3252. [DOI] [PMC free article] [PubMed] [Google Scholar]
- 22.Delgado E, Okabe H, Preziosi M, Russell JO, Alvarado TF, Oertel M, Nejak-Bowen KN, et al. Complete response of Ctnnb1-mutated tumours to beta-catenin suppression by locked nucleic acid antisense in a mouse hepatocarcinogenesis model. J Hepatol. 2015;62:380–387. doi: 10.1016/j.jhep.2014.10.021. [DOI] [PMC free article] [PubMed] [Google Scholar]
- 23.Nejak-Bowen KN, Zeng G, Tan X, Cieply B, Monga SP. Beta-catenin regulates vitamin C biosynthesis and cell survival in murine liver. J Biol Chem. 2009;284:28115–28127. doi: 10.1074/jbc.M109.047258. [DOI] [PMC free article] [PubMed] [Google Scholar]
- 24.Anson M, Crain-Denoyelle AM, Baud V, Chereau F, Gougelet A, Terris B, Yamagoe S, et al. Oncogenic beta-catenin triggers an inflammatory response that determines the aggressiveness of hepatocellular carcinoma in mice. J Clin Invest. 2012;122:586–599. doi: 10.1172/JCI43937. [DOI] [PMC free article] [PubMed] [Google Scholar]
- 25.Okabe H, Delgado E, Lee JM, Yang J, Kinoshita H, Hayashi H, Tsung A, et al. Role of leukocyte cell-derived chemotaxin 2 as a biomarker in hepatocellular carcinoma. PLoS One. 2014;9:e98817. doi: 10.1371/journal.pone.0098817. [DOI] [PMC free article] [PubMed] [Google Scholar]
- 26.Tardito S, Oudin A, Ahmed SU, Fack F, Keunen O, Zheng L, Miletic H, et al. Glutamine synthetase activity fuels nucleotide biosynthesis and supports growth of glutamine-restricted glioblastoma. Nat Cell Biol. 2015;17:1556–1568. doi: 10.1038/ncb3272. [DOI] [PMC free article] [PubMed] [Google Scholar]
- 27.Cadoret A, Ovejero C, Terris B, Souil E, Levy L, Lamers WH, Kitajewski J, et al. New targets of beta-catenin signaling in the liver are involved in the glutamine metabolism. Oncogene. 2002;21:8293–8301. doi: 10.1038/sj.onc.1206118. [DOI] [PubMed] [Google Scholar]
- 28.Chiu M, Tardito S, Pillozzi S, Arcangeli A, Armento A, Uggeri J, Missale G, et al. Glutamine depletion by crisantaspase hinders the growth of human hepatocellular carcinoma xenografts. Br J Cancer. 2014;111:1159–1167. doi: 10.1038/bjc.2014.425. [DOI] [PMC free article] [PubMed] [Google Scholar]
- 29.Tardito S, Chiu M, Uggeri J, Zerbini A, Da Ros F, Dall’Asta V, Missale G, et al. L-Asparaginase and inhibitors of glutamine synthetase disclose glutamine addiction of beta-catenin-mutated human hepatocellular carcinoma cells. Curr Cancer Drug Targets. 2011;11:929–943. doi: 10.2174/156800911797264725. [DOI] [PubMed] [Google Scholar]
- 30.Mendoza MC, Er EE, Blenis J. The Ras-ERK and PI3K-mTOR pathways: cross-talk and compensation. Trends Biochem Sci. 2011;36:320–328. doi: 10.1016/j.tibs.2011.03.006. [DOI] [PMC free article] [PubMed] [Google Scholar]
- 31.Ma L, Chen Z, Erdjument-Bromage H, Tempst P, Pandolfi PP. Phosphorylation and functional inactivation of TSC2 by Erk implications for tuberous sclerosis and cancer pathogenesis. Cell. 2005;121:179–193. doi: 10.1016/j.cell.2005.02.031. [DOI] [PubMed] [Google Scholar]
- 32.Estanqueiro M, Amaral MH, Conceicao J, Sousa Lobo JM. Nanotechnological carriers for cancer chemotherapy: the state of the art. Colloids Surf B Biointerfaces. 2015;126:631–648. doi: 10.1016/j.colsurfb.2014.12.041. [DOI] [PubMed] [Google Scholar]
- 33.Phase I, Multicenter, Dose Escalation Study of DCR-MYC in Patients With Solid Tumors, Multiple Myeloma, or Lymphoma. 2014 https://clinicaltrials.gov/show/NCT02110563.
- 34.Hoshida Y, Nijman SM, Kobayashi M, Chan JA, Brunet JP, Chiang DY, Villanueva A, et al. Integrative transcriptome analysis reveals common molecular subclasses of human hepatocellular carcinoma. Cancer Res. 2009;69:7385–7392. doi: 10.1158/0008-5472.CAN-09-1089. [DOI] [PMC free article] [PubMed] [Google Scholar]
- 35.Zucman-Rossi J, Benhamouche S, Godard C, Boyault S, Grimber G, Balabaud C, Cunha AS, et al. Differential effects of inactivated Axin1 and activated beta-catenin mutations in human hepatocellular carcinomas. Oncogene. 2007;26:774–780. doi: 10.1038/sj.onc.1209824. [DOI] [PubMed] [Google Scholar]
Associated Data
This section collects any data citations, data availability statements, or supplementary materials included in this article.