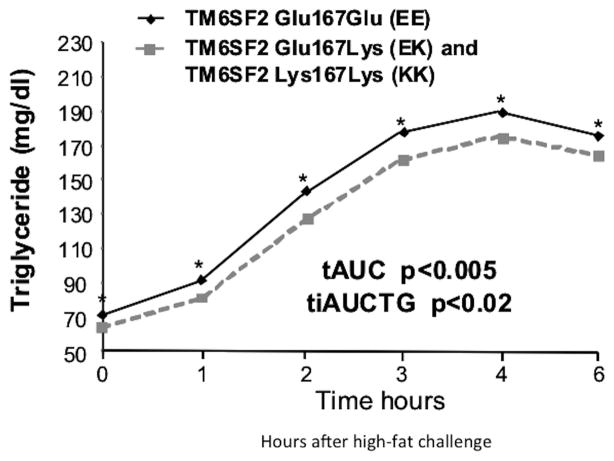
Figure 1.
T-allele carriers (EK and KK) have significantly reduced TG levels compared to their EE counterparts in response to a liquid meal: Triglycerides levels before and during the high fat challenge by E167K genotype. Shown are covariate-adjusted geometric means with 95% confidence intervals. Filled grey squares and hatched lines indicate individuals carrying the T allele and filled diamonds indicate non-carriers. Postprandial lipid responses were calculated as the AUC of the TG measurements at fasting, 1, 2, 3, 4 and 6 hours (p=0.05, p=0.03, p=0.008, p=0.04, p=0.05, p=0.05, respectively). The response relative to the baseline level was determined by calculating the incremental area under the curve (iAUC) of TG. The total area under the curve (AUC) of TG and postprandial TG levels and the incremental AUC (IAUC) were calculated and are shown in the insert with their respective p values.

