Abstract
OBJECTIVE
was to compare the measurement of areal bone mineral density (aBMD) by dual energy X-ray absorptiometry (DXA) with the measurement of volumetric bone mineral density (vBMD) by high resolution peripheral computerised tomography(HR-pQCT) in subjects with a wide range of body mass indices (BMI).
SUBJECTS
We scanned the arms and legs of 49 premenopausal women, aged 21-45, with BMI from 18.5-46.5, by high resolution peripheral computerized tomography (HR-pQCT) and found that there was a non-significant change in volumetric BMD (vBMD) associated with increased BMI whereas aBMD (DXA) was associated with a positive significant increase.
HR-pQCT scans a slice at the extremity of the tibia and radius, whereas DXA scans the entire leg and arm.
RESULTS
The correlation coefficients (r) of BMD (DXA) of the legs with BMI were 0.552 p<0.001, % Fat 0.378, p<0.01, and W 0.633, p<0.001. The r of BMD (DXA) of the arms with BMI 0.804 p<0.001, with % Fat 0.599 p<0.001, and with W 0.831 p<0.001 whereas the r of the average bone density (D 100) of legs and arms measured by HR-pQCT with BMI, W, and % Fat, were not significant.
CONCLUSIONS
Although HR-pQCT and DXA scan different parts of the bone, the high r of BMD with BMI and low r of bone density measured by HR-pQCT with BMI suggests that BMD measured by DXA is artifactually increased in the presence of obesity.
INTRODUCTION
Dual energy photon absorptiometry (DXA) has long been the standard for monitoring areal BMD (aBMD). However, the accuracy of DXA in obesity has been challenged [1]. We have compared vBMD measured by high resolution peripheral computerized tomography (HR-pQCT) with the results obtained by DXA (aBMD) in a group of 49 of healthy premenopausal, normally menstruating women, aged 21-45, spanning a range of BMI (18.5-46.5). They were exercising less than 4 hours per week, and did not have conditions or medications known to affect bone; we wanted to see if the results of scanning with HR-pQCT paralleled those of DXA in subjects with a wide range of BMI. The subjects gave informed consent and the study was approved by our institutional review board.
Table 1 shows the demographics of the study population.
Table 1.
Demographic and scanner parameters of the study population
| Variable | Units | Mean | SD | Min | Max |
|---|---|---|---|---|---|
| Age | Years | 32.4 | 6.4 | 21 | 44.7 |
| Weight (W) | Kg | 73 | 21.3 | 46.7 | 131.5 |
| Height (H) | M | 1.63 | 0.05 | 1.48 | 1.77 |
| BMI | Kg/M2 | 27.3 | 6.7 | 18.1 | 46.5 |
| TIBIA HR-pQCT | |||||
| Slice area | mm2 | 679 | 109.6 | 483.2 | 948.4 |
| Perimeter | mm | 101.9 | 8.5 | 85.5 | 120.6 |
| Cortical thickness | mm | 1.2 | 0.22 | 0.75 | 1.8 |
| Cortical area | mm2 | 122.3 | 22.1 | 78.75 | 193.5 |
| Average bone density | mg HA/cm3 | 309.7 | 47.1 | 226.4 | 454 |
| Compact bone density | mg HA/cm3 | 910.3 | 38.1 | 827 | 1018 |
| Trabecular bone density | mg HA/cm3 | 170.5 | 36.5 | 87 | 263 |
| RADIUS HR-pQCT | |||||
| Slice area | mm2 | 240.7 | 42 | 149.6 | 337.1 |
| Perimeter | mm | 65.3 | 6.2 | 50.6 | 78.6 |
| Cortical thickness | mm | 0.84 | 0.15 | 0.48 | 1.24 |
| Cortical area | mm2 | 54.7 | 7.88 | 35.5 | 71.6 |
| Average bone density | mg HA/cm3 | 345.5 | 57.35 | 231.9 | 482.4 |
| Compact bone density | mg HA/cm3 | 918.4 | 41.61 | 793.5 | 1010.1 |
| Trabecular bone density | mg HA/cm3 | 160 | 35.97 | 83.8 | 256 |
| BMD DXA | |||||
| Legs | g/cm2 | 1.2276 | 0.1119 | 1.021 | 1.674 |
| Arms | g/cm2 | 0.7665 | 0.1159 | 0.586 | 1.167 |
HA = hydroxyl-Apatite
STATISTICS AND GENERAL METHODS
Using data from 187 females between 18 and 45 yrs, the mean and standard deviation for the total body bone density by DXA are 1.2044 and 0.1107. Using these results and assuming a correlation between the two measurements of BMD equal to 0.7, gives a standard deviation for the difference between two measurements equal to 0.0857. This calculation assumes the standard deviations of BMD are equal for the two instruments. A sample of size 45 has a power of 80% for detecting a difference between mean BMD of the two instruments equal to 0.0386. This corresponds to detecting a difference equal to 3.2% of the mean
DXA
Areal BMD of all bones in all areas was measured by DXA (GE Lunar iDXA, Hawaii, USA) in whole body mode. Participants were measured on the same densitometer with the same software, scan speed and technologist. The long term stability was assessed by daily measurements of the Lunar spine phantom. The long term precision was 0.35%, and the least significant change for BMD measurements was 1.00%. The software provides values for the masses of muscle, fat, and bone for the whole body and specific regions.
HR-pQCT Imaging
Structural bone parameters of the non-dominant distal radius and left distal tibia were assessed by HR-pQCT (XtremeCT Scanco Medical AG, Brutisellen, Switzerland.) A stack of 110 slices with a nominal voxel size of 82 μm was obtained with the most distal computerized tomographic (CT) slice placed 9.5 mm from the endplate of the radius or 22.5 mm from the endplate of the tibia. The coefficient of variation (CV) of a phantom containing hydroxyl-apatite (HA) rods embedded in resin (QEM. Moehrendorf, Germany) was 0.7% to 1.5%. The VOI was automatically separated into a cortical area (Ct Ar) and trabecular area (Tb Ar). D100 is the average vBMD in a scanned region One scan of the distal radius was excluded because the subject was unable to control the shaking of her hand.
RESULTS
Table 1 shows that the average and compact bone density (HR-pQCT) are both higher in the radius than in the tibia whereas DXA shows a higher bone density for the legs (weight bearing bone) compared to the arms. Slice area (which reflects cross sectional area) and Cortical thickness are greater in the tibia than in the radius, and this difference in geometry makes it difficult to interpret the difference in volumetric bone density (HR-pQCT); bone strength is dependent inter alia on cross sectional area and cortical thickness [2].
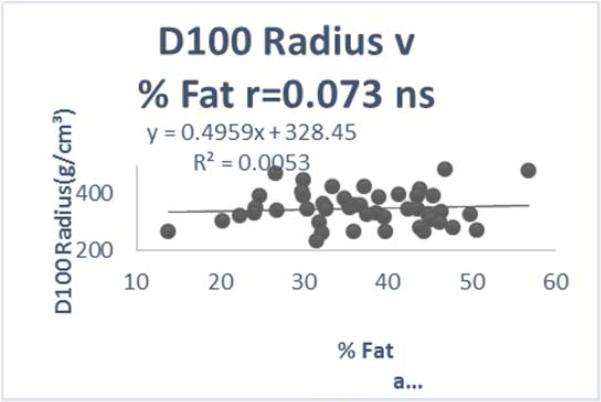
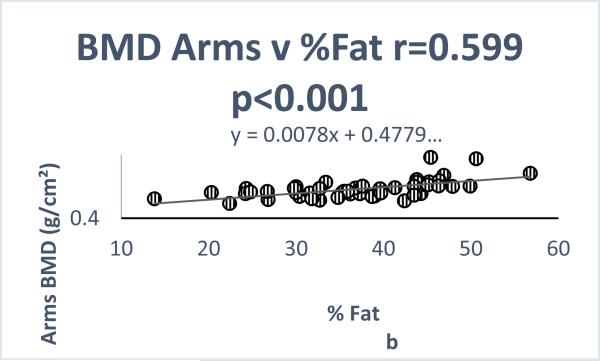
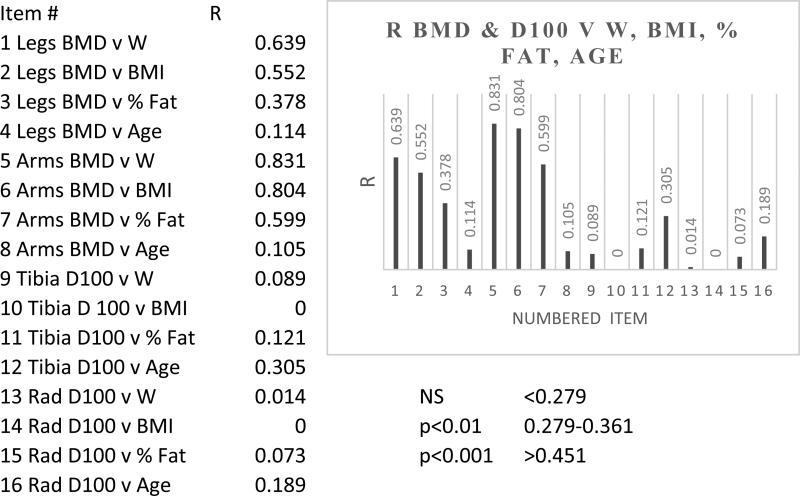
Figure 1 shows that BMD Arms is significantly correlated with % Fat whereas D100 (average vBMD by HR-pQCT), is non-significantly correlated with % Fat. Table 2 shows that there is significant r between BMD (DXA) of legs and arms with BMI as well as W and % fat, whereas there is no significant r between D100 (HR-pQCT) and these variables. There is no significant r between age and BMD or between age and D100 radius but there is a significant r between age and D100 tibia
Figure 1.
Relationship of D100 Radius & BMD to %Fat
Table 2.
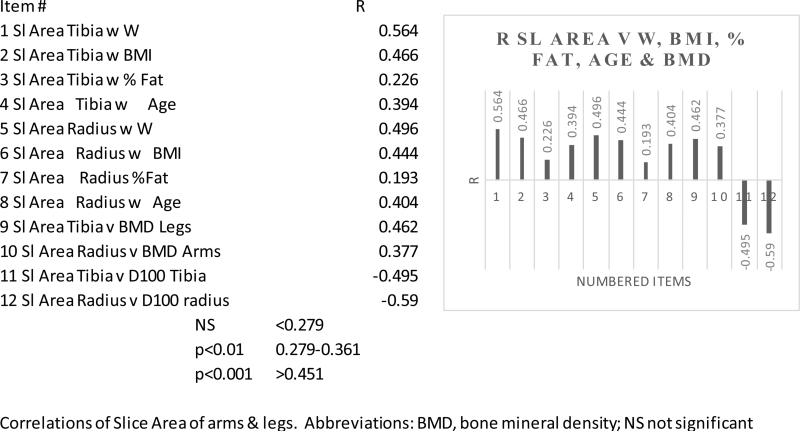
Table 3 shows that Sl Area (cross sectional area) Tibia is correlated with W, BMI, % Fat, Age. Sl Area Radius is correlated with W, BMI, and Age. Adult bones expand in diameter throughout adult life, apparently in adaptation to changing mechanical demands [3] – seen by HR-pQCT, but not by DXA. The increased bone cross sectional area should decrease BMD (DXA) with increased BMI, instead of the increase which we found.
Table 3.
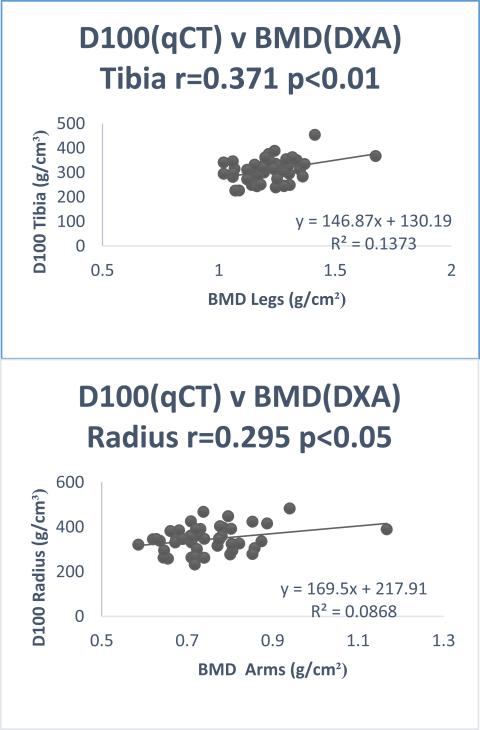
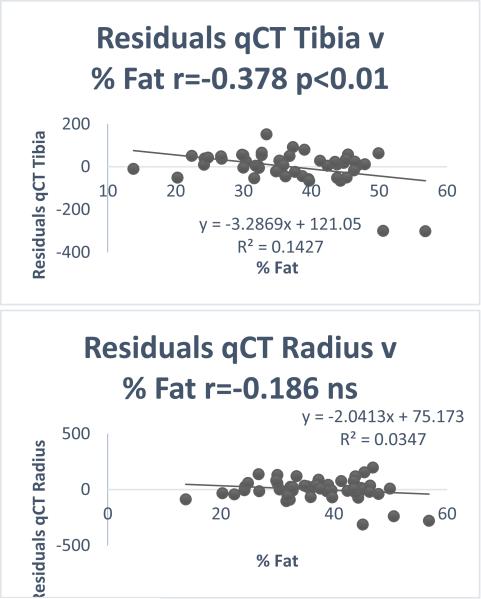
Figure 2 shows the r between D100 Radius v % Fat and BMD arms v % Fat. The residuals of D100 (HR-pQCT) / BMD (DXA) plotted against % fat have no significant r with the radius/arms (r = −0.186 ns) but for the tibia/legs, r=−0.378 p<0.01 are shown in Figure 3.
Figure 2.
Relationship of D100 Tibia to BMD legs & D100 Radius to BMD arms
Figure 3.
Residuals of qCT/BMD v %Fat of legs & arms
DISCUSSION
Bolotin et al showed that all soft tissue (fat and muscle) inhomogeneities could cause inaccuracies as large as 20-50% in BMD measured by DXA [1]. They reported that the ratio of fat to lean, and the ratio of yellow to red bone marrow in the region of interest (ROI) has a major effect on the measured BMD. We have shown in vitro that surrounding fat markedly alters the result of BMD measured by DXA [4]. We have shown that this happens to a lesser extent with HR-pQCT [5].
Bosy-Westphal has shown that the configuration of fat and muscle around the bone and fat within the bone can markedly alter the measured BMD result. This is probably because DXA can distinguish only two components in one pixel using the attenuation ratio of two different X-ray energies, whereas the output actually consists of three components, bone, fat, and muscle. In pixels containing bone, the composition of the soft tissue cannot be measured, and so in those pixels, soft tissue has to be extrapolated from adjacent areas. This assumption is invalid if the composition of the soft tissue in front of or behind the bone or the bone marrow fat differs in composition from soft tissue next to the bone. An undetected loss of fat either in front of, behind, or within the bone leads to an increase in pixel density that may lead to an overestimation of BMD.[6].
The difference in r between BMI and the bone parameters measured by HR-pQCT and those measured by DXA may possibly be explained by a difference in the effect of fat on the absorption of X-rays causing an artifactual increase in BMD measured by DXA.
The measurement of BMD by HR-pQCT did not parallel those of DXA in subjects with increasing BMI. Our results by HR-pQCT were obtained with Scanco I which has a voxel size of 82 μm3. The results of Scanco I partially depend on identification of bone obtained by the absorption of X-rays in the VOI. This study should be repeated with Scanco II.which is a second generation HR-pQCT scanner with a voxel size of 61 μm3 [7]. This will provide a geometric measurement of the amount of bone, the result of which does not depend on the absorption of X-rays. We have shown by radiogrammetry that geometric measurements of bone thickness are not altered by surrounding fat [8]. The decreased dependence (with Scanco II) on absorption of X-rays, may permit a more accurate assessment of the ability of HR-pQCT to measure BMD independently of the amount of surrounding fat.
DXA and HR-pQCT scan different parts of long bones. HR-pQCT shows that increasing BMI is associated with increased bone cross-section. This would tend to decrease measured BMD (DXA) as opposed to the increase which we observed with increasing BMI.
CONCLUSIONS
Our study suggests that the increased BMD (DXA) found with increased BMI may partly be an artifact caused by absorption of X-rays by fat and muscle. It is important to validate the measurement of BMD by DXA in the context of obesity because of the large number of studies which depend on it.
Acknowledgments
EC was_supported by the National Institutes of Health (NIH grant DK026687-27).
Footnotes
The authors declare no conflict of interest.
Disclosures none.
References
- 1.Bolotin HH, Sievanen H. Grashuis JL: Patient-specific DXA bone mineral density inaccuracies:Quantitative effects of nonuniform extraosseous fat distributions. J. Bone Miner. Res. 2003;18:1020–1027. doi: 10.1359/jbmr.2003.18.6.1020. [DOI] [PubMed] [Google Scholar]
- 2.Borer KT. Physical Activity in the Prevention and Amelioration of Osteoporosis in Women. Sports Med. 2005;35:779–830. doi: 10.2165/00007256-200535090-00004. [DOI] [PubMed] [Google Scholar]
- 3.Petit MA, Beck TJ. Kontulainen SA. Examining the developing bone: What do we measure and how do we do it? J Musculoskelet Neuronal Interact. 2005;5:213–224. [PubMed] [Google Scholar]
- 4.Javed F, Yu W, Thornton J, Colt E. Effect of fat on measurement of bone mineral density. Int J Body Comp Res. 2009;7:37–40. [PMC free article] [PubMed] [Google Scholar]
- 5.Colt E, Akram M, Javed F, Shane E, Boutroy S. Comparison of the effect of surrounding fat on measurement of bone mineral density (BMD) by dual energy photon absorptiometry (DXA) and high resolution peripheral quantitative computerized tomography (HR-pQCT) American Society for Bone and Mineral Research; San Diego, California: Sep 18, 2011. Abstract A11007757. [Google Scholar]
- 6.Bosy-Westphal A, Wiebke L, Schautz B, et al. Impact of Intra- and Extra-Osseous Soft Tissue Composition on Changes in Bone Mineral Density with Weight Loss and Regain. Obesity. 2011;19:1503–1510. doi: 10.1038/oby.2011.40. [DOI] [PubMed] [Google Scholar]
- 7.Manske SI, Zhu Y, Sandino C, Boyd SK. Human trabecular bone microarchitecture can be assessed independently of density with second generation HR-pQCT. Bone. 2015;79:213–221. doi: 10.1016/j.bone.2015.06.006. [DOI] [PubMed] [Google Scholar]
- 8.Colt E, Kälvesten J, Cooke K, Khramov N, Javed F. The Effect of fat on measurement of bone mineral density by digital X-ray radiogrammetry. Int. J. Body Comp. Res. 2010;8:41–44. [PMC free article] [PubMed] [Google Scholar]


