Abstract
The cytotoxicity of menadione on hepatocytes was studied by using the substrate generation/tip collection mode of scanning electrochemical microscopy by exposing the cells to menadione and detecting the menadione-S-glutathione conjugate (thiodione) that is formed during the cellular detoxication process and is exported from the cell by an ATP-dependent pump. This efflux was electrochemically detected and allowed scanning electrochemical microscopy monitoring and imaging of single cells and groups of highly confluent live cells. Based on a constant flux model, ≈6 × 10⁶ molecules of thiodione per cell per second are exported from monolayer cultures of Hep G2 cells.
Keywords: electrochemistry, SECM, oxidative stress, ultramicroelectrode, glutathione
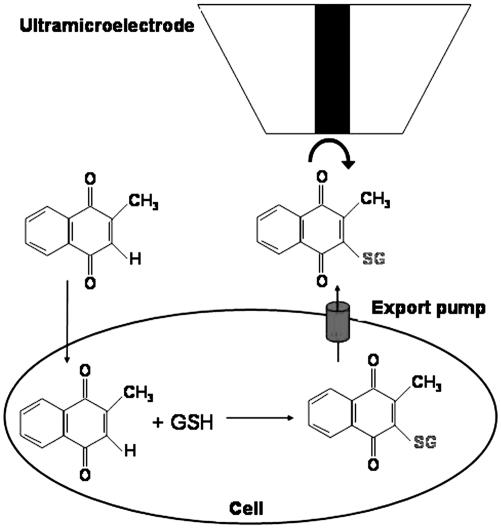
Cytotoxic effects of menadione on hepatocytes were investigated by scanning electrochemical microscopy (SECM), a technique that allows one to detect electroactive species at an ultramicroelectrode tip that can be positioned with high resolution. Here, the substrate generation/tip collection mode of SECM was used to monitor the concentration of thiodione from both highly confluent and isolated Hep G2 cells. Thiodione is a biological metabolite that is actively exported out of the cells by a glutathione S-conjugate pump after the application of oxidative stress by menadione on the hepatocytes (Fig. 1). The efflux of thiodione from both isolated and highly confluent (75–100%) cells can be imaged by SECM, and time profiles of the export can also be obtained after exposure to a cytotoxic concentration of menadione. A simplified model was used to treat the concentration of thiodione from highly confluent cells and to estimate the flux per cell. A similar model has previously been applied to an electrochemical study of doxorubicin transport from Chinese hamster ovarian cells (1).
Fig. 1.
Menadione-imposed oxidative stress on cells leads to the formation and excretion of thiodione into the extracellular media, where it can be detected by using SECM.
SECM has previously been used with mammalian and other cells and has provided useful information about the permeability of cellular membranes to a wide variety of redox couples. The regeneration reaction of different mediators at human breast cells (2) and Rhodobacter sphaeroides (3) was monitored by the feedback mode of SECM, allowing one to distinguish between normal and malignant cells. A theoretical kinetic treatment of these processes is reported in ref. 4. Matsue et al. (5–9) also carried out live-cell studies and monitored respiration rate changes from oxygen reduction profiles for different cell types. In these experiments, oxygen present in solution is consumed by the living organism, so that its concentration is lower near the cell surface. This consumption leads to a lower measured oxygen reduction current when the tip is in close proximity to the cells. These SECM studies monitoring efflux from cells used the feedback approach. Menadione (10) has been used in previous studies because it readily enters the cell through the cell membrane, and we have used it in a study closely related to this one involving the use of SECM to monitor the behavior of yeast cells by using a substrate generation/tip collection mode (11). This approach is especially useful when the detectable concentrations of metabolite are very small. Although the generation/collection mode of SECM has a lower detection limit, its lateral resolution in imaging is often somewhat poorer than with feedback techniques.
Menadione has been used in numerous oxidative stress studies because it readily generates reactive oxygen species (ROS) that can damage the cell. The mechanism by which menadione generates ROS is assumed to be via the one electron reduction of the quinone to the semiquinone. The semiquinone is autoxidized under aerobic conditions back to the quinone. The by-products of this reaction are ROS such as  H2O2, and, most damaging, the hydroxyl radical (10).
Menadione readily diffuses into Hep G2 cells upon addition to the extracellular media. This purely diffusional menadione transport has been reported for many different cell types, such as yeast (11), human breast cells (2), and R. sphaeroides (3), and can be attributed to the amphiphilic nature of menadione, which is hydrophilic enough to be soluble in water but has a sufficiently hydrophobic character to be soluble in the plasma membrane and diffuse into the cell without the assistance of transport proteins or pumps. Once inside the cell, menadione is rapidly conjugated to intracellular glutathione via nucleophilic addition to form a stable conjugate. The loss of viability of Hep G2 cells upon exposure to menadione is always preceded by a rapid depletion of intracellular glutathione (12). This decrease in intracellular glutathione occurs either from the conjugation of glutathione to menadione or from the oxidation of glutathione forming the disulfide dimer (glutathione disulfide) (13). The S conjugate, thiodione, is too hydrophilic to be transported by passive diffusion and requires the use of an ATP-dependent pump for extracellular export. Extracellular thiodione is an electroactive cellular metabolite that can be directly electrochemically detected and allows for full cell SECM studies that do not require the use of specific monoclonal fluorescent antibodies or the use of inside-out vesicles (11).
The cytotoxic effect of menadione was studied in the hepatoblastoma Hep G2 cell line. These cells are well differentiated such that they retain specific hepatic functions such as albumin and bile acid synthesis (14, 15). In monolayer cultures, bile caniculus-like structures, apical vacuoles, can be observed optically, and the uptake of fluorescent glutathione conjugates into these structures has been reported (16, 17). Because these cells originate from a malignant source, they express high levels of three of the multidrug resistance protein (MRP) members including MRP1, whose expression level is usually extremely low in normal hepatocytes (16, 18). For the purpose of SECM studies, Hep G2 cells were convenient, available, and preferred to other reported systems such as freshly isolated hepatocytes, inside-out plasma membrane vesicles, and precision-cut tissue slices (19).
Materials and Methods
Chemicals and Solutions. Menadione (Aldrich) was recrystallized from ethanol before use. 1 mM ferrocene methanol (Aldrich) in 0.1 M KCl was used to characterize the electrochemical behavior of the electrodes before experiments. All solutions were kept in glass containers previously washed overnight in saturated NaOH in EtOH, rinsed in water, and air dried. The supporting electrolyte used in cell experiments was a 0.1 M KCl solution buffered with a 1:1 molar ratio of NaH2PO4/Na2HPO4 of total concentration 0.01 M at pH 7.4 (Mallinckrodt AR, Paris, KY). This phosphate buffer solution (PBS) was sterilized in a UV reactor (Southern New England Ultraviolet, Hamden, CT) for 1 h before all experiments. All solutions were prepared with Milli-Q (Millipore) reagent water and degassed with Ar for 30 min before experiments. The washing buffer solution and menadione solution were always warmed to 37.5°C in a water bath before any contact with the cells.
Cell Growth and Sample Preparation. The Hep G2 liver cells (American Type Culture Collection) were grown in Eagle's minimum essential medium (American Type Culture Collection) modified to contain 0.1 mM sodium pyruvate, 0.1 mM nonessential amino acids, and 1.5 g/liter sodium bicarbonate. The medium was supplemented by 10% FBS (Atlanta Biology) and grown at 37.5°C in a water-jacketed incubator (Model 2310, VWR Scientific) at 5% CO2. The growth medium was changed twice weekly. The cells were grown until they were above 75% confluency and spontaneously adhered to the bottom of the Petri dish. For the SECM experiments, the growth medium was removed and replaced by the PBS buffer (pH 7.4) at 37.5°C.
Neutral Red (NR) Cytotoxicity Assay. This assay is a cell viability test based on the uptake and binding of a water-soluble weakly cationic dye. NR, 3-amino-7-dimethylamino-2-methyl-phenazine hydrochloride, yields a deep red color at slightly acidic pH. A detailed description of this viability assay is reported in refs. 19 and 20. NR readily diffuses through the plasma membrane and concentrates in the lysosomes, where it binds electrostatically to anionic sites (21). Toxic compounds that alter the cell surface or disturb the lysosomal membrane reduce or prevent the uptake of NR by the lysosomes. This reduction in dye uptake results in a decreased absorbance and is indicative of an overall loss of viability of the stressed cells. Details of these experiments are available in Supporting Materials and Methods, which is published as supporting information on the PNAS web site. In this work, the assay was mainly used to identify the concentration of menadione that is toxic to the Hep G2 cells over a time frame consistent with the SECM experiments (≈1 h). This assay was performed by using 5, 10, 20, 40, and 80 μM menadione for cells having confluencies between 75% and 100%. Viability is expressed as the percentage of the absorbance at 540 nm from the nontreated cells and is averaged over the number of replicates made.
Electrochemistry and Electrode Fabrication. Ultramicroelectrodes (UMEs) (10 μm Pt) were used in the experiments. A detailed description of their fabrication and characterization can be found in ref. 22. Pt wire (0.5-mm diameter; Goodfellow, Cambridge, U.K.) and Hg/Hg2SO4 (Radiometer, Copenhagen) electrodes were used as counter and reference electrodes, respectively. A scanning electrochemical microscope (Model 900, CH Instruments, Austin, TX) was used to control the tip potentials, obtain the approach curves, and monitor the tip to substrate distance.
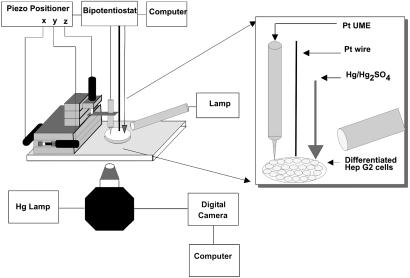
SECM Cyclic Voltammetry (CV) Experiments. Details about electrochemical studies and product identification of thiodione and menadione by CV are reported in ref. 11. Briefly, menadione and thiodione both show reduction waves at about -0.7 V (Hg/Hg2SO4), and the thiodione shows an oxidation wave at 0.1 V. Glutathione is not electroactive in the potential region of these waves. To perform the experiments on the immobilized cells, the SECM head was placed on the stage of an inverted microscope (Eclipse TE300, Nikon, Melville, NY) to facilitate positioning the tip over the cells (Fig. 2). The tip was first positioned in air over the PBS moist cells by using the piezoelectric drivers of the SECM. These experiments were performed in a three-electrode setup. A halogen lamp source illuminating from the side was used to reduce the shadowing effect of the tip holder and to assist in the acquisition of clear optical images of the Hep G2 cells. After positioning, 1 ml of a degassed PBS solution of menadione (80 μM) at 37.5°C was added. CV at the tip was then immediately started with a time delay of <5 sec. To acquire the voltammograms, the potential was scanned from -0.8 to 0.65 V vs. Hg/Hg2SO4 at 100 mV/sec. In this potential region, no menadione contribution was observed, as reported in ref. 23. At the end of the CV experiment, an approach curve over the insulating glass was recorded by using the menadione reduction (at -0.8 vs. Hg/Hg2SO4) as the redox couple to evaluate the true tip-to-substrate distance.
Fig. 2.
Experimental setup used in the SECM measurements of human liver cells. The SECM head is attached to the inverted microscope. A side lamp was added to the setup to assist in the acquisition of optical images of the liver cells.
SECM Imaging Experiments. The cells were put in contact with the menadione solution, and the tip was approached to the glass of the Petri dish by using menadione reduction (at -0.8 V vs. Hg/Hg2SO4) as the mediator. The tip-to-substrate distance was always roughly maintained at 5 μm, because the images were acquired in the constant height mode and also because a closer approach led to the danger of removal of the adhered cells by the tip upon scanning. Once positioned, the tip was moved over a region where live isolated cells were present by using the piezoelectric drivers. The approach and positioning of the tip before the acquisition of the image usually required ≈10 min. A SECM image of the export of the conjugate was then recorded with an x–y scan over several hundred microns by poising the tip at the potential for thiodione oxidation (0.55 V vs. Hg/Hg2SO4). All imaging experiments were performed within the 1-h time limit as indicated by the cytotoxicity experiments.
Results and Discussion
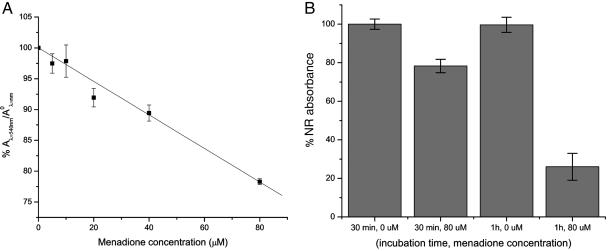
Cytotoxicity Experiments. Fig. 3A shows the effect of menadione concentration for a 30-min exposure on the Hep G2 cell. These measurements were performed several times on cells that were 75% confluent or more. The dose–response was linear (R2 = 0.999) and had an intercept (100.01 ± 0.01) almost identical to the expected 100% viability at zero menadione concentration. These results are in agreement with other cytotoxicity studies on Hep G2 cells with menadione that reported a concentration-dependent decrease in cell based on trypan blue exclusion (12).
Fig. 3.
NR assay results for cells of 75% or more confluency. (A) NR absorbance of Hep G2 cells with different menadione concentration applied to the cells for a 30-min incubation time. The values represent three independent measurements of concentrations. Within each concentration, three replicate measurements were performed. (B) Histogram of the effect of exposure time of 80 μM menadione on the NR absorbance of the Hep G2 cells. The values are representative of three replicates.
In the SECM experiments, 80 μM menadione was used so that a detectable signal could be measured from the cells. As seen in Fig. 3B, the experiments had to be performed within 1 h to maintain cell viability.
Collection Experiments on Films of Highly Confluent Cells. The export of thiodione after the addition of menadione was made with patches of confluent cells adhering to the bottom of a Petri dish with an area significantly larger than the area of the tip held ≈100 μm above them. The 10-μm Pt probe electrode, held at the potential for conjugate oxidation, detects the exported thiodione by CV and records an increasingly anodic steady-state wave with time. The current at 0.5 V vs. Hg/Hg2SO4 was measured from the CV and converted to thiodione concentration by using the steady state current expression for a disk ultramicroelectrode (Fig. 4). The steady-state tip current, is, is given by
 |
[1] |
where n, the number of electrons, is 2, F is the Faraday constant, D is the diffusion coefficient of thiodione in solution (4 × 10⁻⁶ cm2/sec), Co is the concentration of thiodione, and a is the radius of the Pt electrode (5 μm). The response was background subtracted for the electrolyte signal. Because this experiment detects a growing concentration profile, it is very sensitive to any small convection events (e.g., vibrations) that disrupt the profile. This disruption is observed as a sudden decrease in current that then returns to an increasing profile. When such events occur, a correction for the convection event was made that translated the affected points to the earlier current–time profile.
Fig. 4.
Electrochemical detection of thiodione from highly confluent Hep G2 cells. The potential was scanned from -0.8 to 0.65 V vs. Hg/Hg2SO4 at a scan rate of 100 mV/sec in deoxygenated 37.5°C PBS buffer. The signal was recorded at a 10-μm Pt UME. Dots: the current at 0.5 V vs. Hg/Hg2SO4 was converted to thiodione concentration and plotted versus the calculated time. Solid line: nonlinear fitting of Eq. 2 to experimental points for x = 85 μm, D = 4 × 10⁻⁶ cm2/sec, and J = 4.7 × 10⁻¹² molecules per sec per cm2. The tip-to-substrate distance, x, could be varied from 100 to 85 μm and did not affect significantly the value of J obtained. (Inset) Optical micrograph of 75–100% confluent liver cells used in these measurements.
Thiodione is more hydrophilic than menadione and cannot simply diffuse through the plasma membrane. Good experimental evidence to support this is the lack of uptake of the conjugate by rat platelets (24). Thiodione is very stable and can also redox cycle to form ROS and therefore must be actively removed from the intracellular space via glutathione S-conjugate pump. The rate of efflux of thiodione from the cell via this pump is measured by the SECM tip.
Thiodione Flux from Highly Confluent Cells. For a large substrate, like the highly confluent liver cells, one can assume that the thiodione diffuses to the tip by semiinfinite linear diffusion. An expression for the flux of thidione, Jcell, can be derived under the experimental conditions, where thiodione is initially absent and we assume that the cells are generating a constant flux of thiodione. The cell membrane/solution interface is taken as a distance, x, of 0, and the concentration profile of thiodione for this constant flux boundary condition at the substrate is expressed as (with J = i/nFA) (25)
 |
[2] |
where J (molecules per sec per cm2) is the thiodione flux, D (cm2/sec) is the diffusion coefficient of thiodione in solution, x (cm) is the tip-to-cell distance, and t (s) is time. The liver experimental data in Fig. 4 were fitted to Eq. 2 by using the mathematica nonlinear regression package (Wolfram Research, Champaign, IL).
In these experiments, a 10-μm Pt UME was placed 85 μm away from a monolayer of the liver cells (confluency >75%). The UME current yields the concentration of thiodione expelled from these cells after the addition of 80 μM menadione. The nonlinear curve fit gave J = 4.7 ± 0.3 × 10⁻¹² molecules per sec per cm2 (R2 = 0.996). The flux, J, was normalized by the density of cells to obtain Jcell. The density of cells, calculated from an optical micrograph of the monolayer cells (170 × 170 μm area) taken before the experiment, yields a flux of Jcell = 1 × 10-17 mol per sec per cell.
The concentration in Eq. 2 starts at zero and assumes the production of an instantaneous flux at t > 0. In the experiment, the menadione uptake, glutathione conjugation, and pump efflux contribute to a time lag as observed in the experimental data of Fig. 4. This time lag implies that, at short times, Eq. 2 overestimates the concentration of thiodione produced by the cell. At the end of this experiment, NR absorbance decreased to ≈20% of its original value. Decreases in NR absorbance do not directly reflect cell death but closely precede it, depending on cell type. Although this was not taken into account in the model, a change of 20% in cell density would not affect significantly the extracted flux. To infer a greater biological significance to these results, numerical simulations presented in an earlier study should be performed (11). Moreover, a discussion concerning the balance between the consumed menadione and exported thiodione might then be possible.
The efflux of thiodione from highly confluent Hep G2 cells is in agreement with the differentiated role of hepatocytes where the excretion into bile is a major pathway for the elimination of endogenous and xenobiotic compounds for the mammalian organism. Metabolizing transferases in hepatocytes convert many drugs into amphiphilic anionic conjugates with glutathione, glucuronate, or sulfate. Excretion of these conjugates across the canicular membrane into bile is mediated by a primary-active ATP-dependent export pump also termed the multispecific organic anion transporter (MOAT), non-bile acid organic anion transporter, glutathione S-conjugate export pump, or leukotriene export pump (26, 27).
The general shape of conjugate export in Fig. 4 is consistent with that observed in other studies, e.g., the concentration of thiodione from rat platelet-rich plasma by using an HPLC–UV-visible detection scheme (24) and the electrochemical detection of doxorubicin export from Chinese hamster ovary cells (28). Another study by the latter group assumed a constant flux model for the release of doxorubicin hydrochloride from highly confluent cells (1), and we used a similar model here.
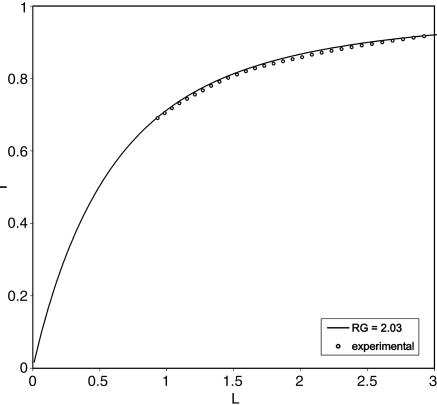
Single-Cell Imaging of Thiodione Export. In addition to measuring the flux from patches of cells, the export of thiodione from isolated cells after incubation in 80 μM menadione was also studied. To image this process, the probe electrode was brought in close proximity to the cells by first recording an approach curve above the insulating glass of the Petri dish near the cells by using the menadione as the mediator (Fig. 5). After the addition of menadione to the cells, the 10-μm Pt UME was held at the menadione reduction potential (-0.8 V vs. Hg/Hg2SO4). As the tip approached, the hemispherical diffusion of menadione was progressively blocked by the bottom of the dish, causing a decrease in the observed steady-state current, yielding the well known SECM pure insulating behavior (22).
Fig. 5.
Insulating SECM approach curve to the Petri dish bottom by using menadione reduction as redox species (-0.8 V vs. Hg/Hg2SO4). The theoretical behavior for a totally insulating approach curve for a 10-μm Pt UME with an RG of 2 is represented by the solid line. The experimental points follow the theory and indicate that the electrode was placed 4.3 μm from the substrate.
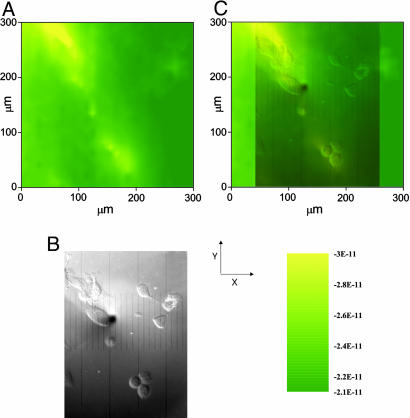
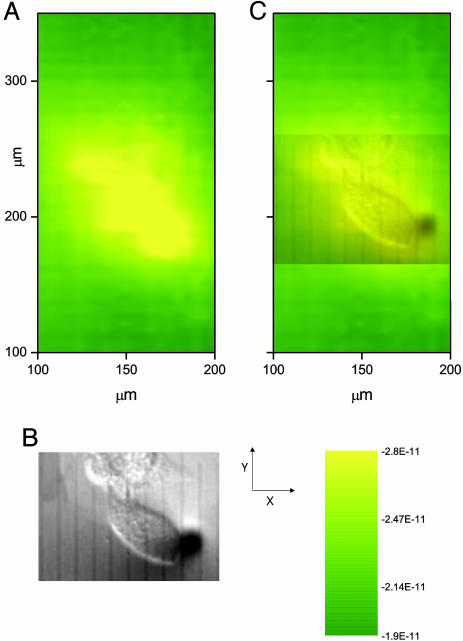
The tip was approached until it was within a distance, d, comparable to the tip radius, a,(L = d/a = 1) as seen in Fig. 5. To avoid the possibility of tip contact with the cells themselves upon scanning, the tip was not moved closer to the dish bottom. A closer approach usually resulted in the removal of the adhered cells from the bottom of the dish upon scanning. Because the SECM head is fixed to the translation stage of the inverted microscope, it is not possible to correct for some tilting of the substrate with respect to the SECM scanning x–y plane, and so crashing of the tip on the substrate while imaging is more likely in this configuration. To acquire the SECM collection image, the UME was held at the potential for thiodione oxidation (0.55 V vs. Hg/Hg2SO4) and scanned in the x–y plane over several hundred micrometers at a constant height over the cells (about L = 1), while the collection current was recorded. As shown in a scan in Fig. 6A, higher currents (yellow) were recorded over the liver cells, whereas lower currents (green) were found over the bottom of the dish. As the tip was recording the SECM image, a simultaneous optical image was captured using the inverted microscope's camera (Fig. 6B). The dark disk seen in the middle of the optical micrograph is the 10-μm Pt electrode, and several agglomerated human liver cells can be observed. When the optical micrograph is superimposed onto the SECM image, good agreement is observed between the location and size of the cells and the regions of large anodic current. The cells on the right side did not show as much efflux as the other cells, but they did have a collection current higher than the background. Similar SECM images also could be recorded on single human liver cells, and good correlation was observed between the cell position and the higher current domains (Fig. 7). To improve image resolution, a closer tip-to-substrate distance would be preferable, but this is limited by the topography of the cells. Also, to limit electrolyte mixing by the tip, a sacrificial redox couple that would consume the primary product could be added to reach steady-state conditions dependent on the amount of compounds released by the cells.
Fig. 6.
SECM images of the export of thiodione from Hep G2 cells as detected by a 10-μm Pt UME with an RG of 2. (A) SECM image of Hep G2 cells. The tip potential was held at 0.55 V vs. Hg/Hg2SO4 and scanned at 300 μm/sec over an area of 300 × 300 μm (5 min per image) where the x direction was the long axis. The quiet time was 2 sec. (B) Simultaneous optical micrograph of the Hep G2 cells being imaged. The black spot on the micrograph is the Pt UME. One large division corresponds to 50 μm. (C) Superimposed transparent optical micrograph on the SECM image. This image was acquired after 20 min of incubation in the 80 μM menadione solution.
Fig. 7.
SECM images of the export of thiodione from two neighboring human liver cells as detected by using a 10-μm Pt UME with RG of 2. (A) SECM image of Hep G2 cells. The tip potential was held at 0.55 V vs. Hg/Hg2SO4 and scanned at 150 μm/sec over an area of 400 × 200 μm (17 min per image) where the x direction was the long axis. The quiet time was 2 sec. (B) Simultaneous optical micrograph of the Hep G2 cells being imaged. The black disk on the micrograph is the Pt UME. One division corresponds to 10 μm. (C) Superimposed transparent optical micrograph on the SECM image. This image was acquired after 26 min of incubation in the 80 μM menadione solution.
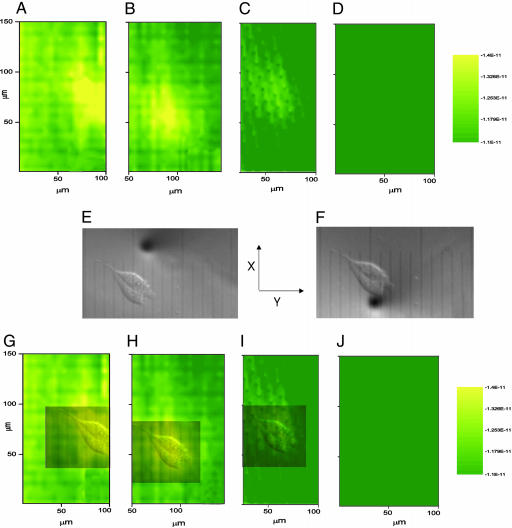
Time Profile of Thiodione Export from Individual Human Liver Cells. It is also possible to observe toxicity effects of menadione on individual liver cells by taking successive images of the conjugate export with time (Fig. 8). As indicated in Fig. 3B, 80 μM menadione is toxic to Hep G2 cells within 1 h and progressively kills more cells with increasing menadione concentration and longer times. The images in Fig. 8 were acquired with fairly rapid scans (150 μm/sec) so that the time frame allows us to see this time profile. It took ≈7minto acquire each image. Slower scan rates would show better resolution in the cell images, and the conjugate concentration over the cells would change significantly from the beginning to the end of the scan. As seen in Fig. 8 A–D, the export of conjugate from a cell decreased with time. These images were taken on the same cell, at different incubation times after menadione addition, and for the same tip-to-substrate distance. The cell's position in the image varied slightly because of a small hysteresis of the piezoelectric inchworms during the scans. Because this image sequence was repeated several times and over large areas (≈250 × 400 μm), the hysteresis causes the absolute position of the electrode to drift in the scans. Rough optical correction of this hysteresis by using the inverted microscope then becomes advantageous.
Fig. 8.
Time-dependent profile of the export of thiodione from two adjacent human liver cell as detected by SECM imaging. (A–D) SECM images of the Hep G2 cell. The tip potential was held at 0.55 V vs. Hg/Hg2SO4 and scanned at 150 μm/sec. The quiet time was 2 sec. (E and F) Simultaneous optical micrograph of the Hep G2 cell being imaged. The black spot on the micrograph is the 10-μm Pt UME at two different positions, E and F. One division corresponds to 10 μm. (G–J) Superimposed optical micrograph on the SECM image. These images were acquired after 43 min of incubation in the 80 μM menadione solution. All images were normalized with respect to scale.
Optical micrographs (Fig. 8 E and F) of the tip scanning over the cell were simultaneously acquired during SECM imaging. From Fig. 8 E and F, the feature that produced the high-current region seen in Fig. 8 A–D was the two neighboring human liver cells. Super-position of the scaled optical micrograph onto the scaled SECM collection image reveals good agreement (Fig. 7 G–J).
The times at which the SECM images were acquired varied. Cells like those imaged in Figs. 5 and 6 were incubated in 80 μM menadione solution for 20 and 26 min, respectively. The currents measured above the imaged cell are comparable for the same tip-to-substrate distance. The two cells imaged in Fig. 8 were taken after a considerable exposure time. The highest current measured over the cells was half that measured after a 20-min exposure for an identical tip-to-substrate distance. Such differences also could occur because of differences in cell topography, but the incubation time was found to be the dominant factor. In Fig. 8D, the thiodione concentration was below the detection limit, and based on the 63-min incubation time reported in Fig. 3, the SECM profile agrees with the time frame established by the NR cytotoxicity results. This result does not unequivocally confirm that the observed cells are dead.
In the future, the SECM detection method may prove useful as an assay in cytotoxicity experiments with single cells. It could potentially also be used to test molecules designed to inhibit the export pumps. To do so, the biological secretion must be deconvoluted from the cell topography or changes in cellular osmotic pressures by, for example, performing constant-current experiments. Also, several control experiments in the presence of a temperature-controlled stage may reduce the time constraints related to viability of the cells.
Conclusions
In agreement with previous cytotoxicity measurements using menadione on the Hep G2 cell line with trypan blue exclusion, menadione causes a concentration-dependent decrease in viability as measured by the NR viability assay. SECM experiments performed within 1 h for an 80 μM menadione dose allowed us to measure the thiodione efflux from patches of highly confluent cells using a SECM/inverted microscope arrangement. Based on a constant flux model, a thiodione flux of Jcell = 1 × 10-17 molecules per sec per cell (≈6 × 10⁶ molecules per cell per sec) was obtained for these highly confluent cells. These values should be compared to flux values acquired by an independent technique. SECM images of the efflux process of thiodione from isolated cells were obtained after menadione-imposed oxidative stress. A time profile of the efflux of a single cell was recorded and agrees with the cytotoxicity time frame established by the NR assay.
Supplementary Material
Acknowledgments
This work was supported by a University of Texas Continuing Fellowship, the Edward G. Weston Summer Research Fellowship of the Electrochemical Society, and National Science Foundation Grant CHE 0109587.
Author contributions: J.M. and A.J.B. designed research; J.M. performed research; A.J.B., O.O., and T.J.M. contributed new reagents/analytic tools; J.M. and O.O. analyzed data; and J.M. wrote the paper.
Abbreviations: CV, cyclic voltammetry; NR, neutral red; PBS, phosphate buffer solution; SECM, scanning electrochemical microscopy; UME, ultramicroelectrode.
References
- 1.Yi, C. & Gratzl, M. (1998) Biophys. J. 75, 2255–2261. [DOI] [PMC free article] [PubMed] [Google Scholar]
- 2.Liu, B., Rotenberg, S. A. & Mirkin, M. V. (2000) Proc. Natl. Acad. Sci. USA 97, 9855–9860. [DOI] [PMC free article] [PubMed] [Google Scholar]
- 3.Cai, C., Liu, B., Mirkin, M. V., Frank, H. A. & Rusling, J. F. (2002) Anal. Chem. 74, 114–119. [DOI] [PubMed] [Google Scholar]
- 4.Biao, L., Rotenberg, S. A. & Mirkin, M. V. (2002) Anal. Chem. 74, 6340–6348. [DOI] [PubMed] [Google Scholar]
- 5.Yasukawa, T., Kaya, T. & Matsue, T. (1999) Anal. Chem. 71, 4637–4641. [Google Scholar]
- 6.Nishizawa, M., Takoh, K. & Matsue, T. (2002) Langmuir 18, 3645–3649. [Google Scholar]
- 7.Takii, Y., Takoh, K., Nishizawa, M. & Matsue, T. (2003) Electrochim. Acta 48, 3381–3385. [Google Scholar]
- 8.Kaya, T., Nishizawa, M., Yasukawa, T., Nishiguchi, M., Onouchi, T. & Matsue, T. (2001) Biotech. Bioeng. 76, 391–394. [DOI] [PubMed] [Google Scholar]
- 9.Shiku, H., Shiraishi, T., Ohya, H., Matsue, T., Abe, H., Hoshi, H. & Kobayashi, M. (2001) Anal. Chem. 73, 3751–3758. [DOI] [PubMed] [Google Scholar]
- 10.Monks, T. J. & Lau, S. S. (1998) Annu. Rev. Pharmacol. Toxicol. 38, 229–255. [DOI] [PubMed] [Google Scholar]
- 11.Mauzeroll, J. & Bard, A. J. (2004) Proc. Natl. Acad. Sci. USA 21, 7862–7867. [DOI] [PMC free article] [PubMed] [Google Scholar]
- 12.Duthie, S. J. & Grant, M. H. (1989) Biochem. Pharmacol. 38, 1247–1255. [DOI] [PubMed] [Google Scholar]
- 13.Di Monte, D., Ross, D., Bellomo, G., Eklow, L. & Orrenius, S. (1984) Arch. Biochem. Biophys. 235, 334–342. [DOI] [PubMed] [Google Scholar]
- 14.Knowles, B. B., Howe, C.C. & Aden, D. P. (1980) Science 209, 497–499. [DOI] [PubMed] [Google Scholar]
- 15.Javitt, N. B. (1990) FASEB J. 4, 161–168. [DOI] [PubMed] [Google Scholar]
- 16.Roelofsen, H., Vos, T. A., Schippers, I. J., Kuipers, F., Koning, H., Moshage, H., Jansen, P. L. M. & Müller, M. (1997) Gastroenterology 112, 511–521. [DOI] [PubMed] [Google Scholar]
- 17.Sormunen, R., Eskelinen, S. & Lehto, V. P. (1993) Lab. Invest. 68, 652–662. [PubMed] [Google Scholar]
- 18.Roelofsen, H., Müller, M. & Jansen, P. L. M. (1997) Yale J. Biol. Med. 70, 435–445. [PMC free article] [PubMed] [Google Scholar]
- 19.Borenfreund, E. & Puerner, J. A. (1985) Toxicol. Lett. 24, 119–124. [DOI] [PubMed] [Google Scholar]
- 20.Babich, H. & Borenfreund, E. (1992) in In Vitro Methods of Toxicology, ed. Watson, R. R. (CRC, Boca Raton, FL), pp. 237–251.
- 21.Nemes, Z., Dietz, R., Luth, J. B., Gomba, S., Hackenthal, F. & Gross, F. (1979) Experientia 35, 1475–1476. [DOI] [PubMed] [Google Scholar]
- 22.Bard, A. J. & Mirkin, M. V., eds. (2001) Scanning Electrochemical Microscopy (Dekker, New York).
- 23.Liu, B., Cheng, W., Rotenberg, S. A. & Mirkin, M. V. (2001) J. Electroanal. Chem. 500, 590–597. [Google Scholar]
- 24.Chung, J.-H., Seo, D.-C., Chung, S.-H., Lee, J.-Y. & Seung, S.-A. (1997) Toxicol. Appl. Pharmacol. 142, 378–385. [DOI] [PubMed] [Google Scholar]
- 25.Bard, A. J. & Faulkner, L. R. (2001) Electrochemical Methods (Wiley, New York), 2nd Ed., p. 309, equation 8.2.11.
- 26.Mayer, R., Kartenbeck, J., Biichler, M., Jedlitschky, G., Leier, I. & Keppler, D. (1995) J. Cell Biol. 131, 137–150. [DOI] [PMC free article] [PubMed] [Google Scholar]
- 27.Keppler, D. & König, J. (2000) Semin. Liver Dis. 20, 265–272. [DOI] [PubMed] [Google Scholar]
- 28.Lu, H. & Gratzl, M. (1999) Anal. Chem. 71, 2821–2830. [DOI] [PubMed] [Google Scholar]
Associated Data
This section collects any data citations, data availability statements, or supplementary materials included in this article.


