Abstract
Nonspatial theory on pathogen evolution generally predicts selection for maximal number of secondary infections, constrained only by supposed physiological trade-offs between pathogen infectiousness and virulence. Spread of diseases in human populations can, however, exhibit large scale patterns, underlining the need for spatially explicit approaches to pathogen evolution. Here, we show, in a spatial model where all pathogen traits are allowed to evolve independently, that evolutionary trajectories follow a single relationship between transmission and clearance. This trade-off relation is an emergent system property, as opposed to being a property of pathogen physiology, and maximizes outbreak frequency instead of the number of secondary infections. We conclude that spatial pattern formation in contact networks can act to link infectiousness and clearance during pathogen evolution in the absence of any physiological trade-off. Selection for outbreak frequency offers an explanation for the evolution of pathogens that cause mild but frequent infections.
Keywords: evolution, pathogen, spatial model, spatial patterns
Current theory on pathogen evolution places much emphasis on physiological (or life-history) trade-offs that relate virulence, infectiousness, mode of transmission, and immune clearance (1–6). These trade-offs, motivated by a supposed functional link between two (or more) traits, specify that evolutionary improvements in one trait are necessarily accompanied by a decline in another (7, 8). One of the most commonly made trade-off assumptions is that increased production of transmission stages causes increased host mortality and thereby shortens the infection period (9). Where traits can evolve independently, nonspatial theory typically predicts selection for maximal transmissibility and infection period, thus maximizing the number of secondary infections (i.e., the number of new infections an infected host causes). It is commonly held, however, that the benefits of increased transmission and the associated penalties of virulence and shorter infection are balanced so that the number of secondary infections is maximized at intermediate transmissibility and virulence (2). In simple nonspatial models, this evolutionary maximization corresponds to selection for maximal basic reproductive ratio R0 (10), i.e., the expected number of secondary infections in an unexposed population [but note that this result depends on absence of multiple infections (5) and vertical transmission (11, 12)]. The current popularity of trade-offs in studies of pathogen evolution stems from the fact that they provide a possible explanation for selection for intermediate virulence and transmissibility (8), and that they can be used to predict pathogen evolution in response to human interventions such as the use of imperfect vaccines (4) or improved hygiene (13). However, the exact shape (and even existence) of trade-offs is unknown for many diseases (14).
A growing body of work reports on the role of spatial pattern formation on evolutionary processes (3, 6, 15–21). Recent studies have shown large-scale spatiotemporal patterns in measles (22) and dengue fever (23). Existing theoretical work on pathogen evolution and spatial pattern formation has focused on a model in which local colonization of “empty spaces” by susceptible hosts plays a central role (3, 6, 19–21). Pathogen lethality in this model leads to host patchiness, and too aggressive pathogens will die out because they cause local extinction of hosts (19). In this manner, spatial processes can lead to limitations in the evolution of transmissibility, but the evolutionary attractor is close to host extinction. Furthermore, local clustering of infections (so-called self-shading) reduces the effective infection rate (20). This effect of spatial patterns makes trade-off optimization in spatial populations less straightforward than in their nonspatial counterparts. Although theoretically appealing, the patchiness that dominates this model depends heavily on local birth of hosts into empty spaces, which does not seem representative for, e.g., human populations. Moreover, for the persistence mechanism proposed by this model to work, the infection process and host reproduction must operate on similar timescales. This implicit assumption does not hold for a large number of pathogen–host systems. Our aim is to examine how spatial selection processes determine pathogen evolution in the absence of the dominant role of virulence, host demographics, and physiological trade-offs.
Methods
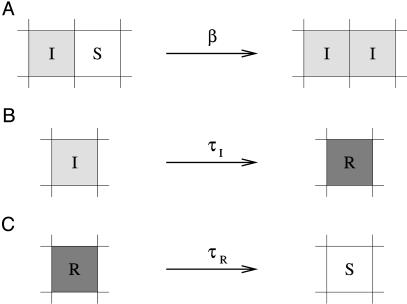
We developed a spatial susceptible-infected-resistant (SIRS) model for disease dynamics (24), using a grid-structured contact network (25, 26). In the model (see Fig. 1), hosts can be susceptible (S), infected (I), or resistant (R). Infected hosts can infect adjacent susceptible hosts at infection rate β. The infection neighborhood consists of eight direct neighbors in a square lattice. Infection lasts for a fixed infection period τI, after which the host becomes resistant. Resistant hosts return to susceptibility after a fixed duration τR (scaled to unity).
Fig. 1.
Representation of processes in the contact network model. (A) Infection. Infected hosts (I) can infect susceptible (S) neighbors with infection rate β. The total probability of infection is 1 – eiβΔt, where i is the number of infected neighbors. (B) Acquisition of resistance. Hosts are infectious for a fixed period τI, after which they become resistant (R). (C) Loss of resistance. After a fixed period τR, resistant hosts once again become susceptible.
Every time-step Δt, cells change state according to the following rules, which are illustrated in the corresponding panels of Fig. 1:
A susceptible cell can be infected by infected cells from its eight-cell neighborhood. The probability pinf of infection is calculated from the infection rate β as pinf = 1 – eiβΔt, where i is the number of infected neighbors.
Infected cells remain infected for a fixed time period τI and then become resistant.
Resistant cells remain so for a fixed time period τR. After that, the cells become susceptible again.
The general nature of these transition rules allows network nodes to represent individual hosts, but also, e.g., communities or schools. For simplicity, we will refer to the nodes as individual hosts.
Infection rate (β), infection period (τI), and resistant period (τR) are all expressed relative to the unit in which time is measured. We scale the length of the resistant period to unity and study the system in terms of infection rate and infection period. The length of a cellular automata update time-step Δt was reduced until the system behavior converges, effectively simulating a continuous time process (we use Δt = 0.01 in results presented; results are insensitive to asynchronous updating).
We assign a “genotype” to every infected cell, specifying the infection rate and infection period of the infecting pathogen. Newly infected cells inherit the genotype of the pathogen that infected them. Infected cells can change genotype in small fixed steps (±Δβ, ±ΔτI) at mutation rate μ = 0.01. Alternative mutation rules, such as a mutation only upon infection, or proportional instead of fixed mutation steps, do not qualitatively change our results. For simplicity, we assumed that the length of the resistant period cannot evolve. The duration of resistance, however, may be partially under evolutionary control of the pathogen in some cases (e.g., through antigenic change). Preliminary results indicate that, if the resistant period can evolve, it tends to decrease to minimal values. Grid size used in the evolutionary simulations is 120 × 120 cells. Larger grid sizes do not change the evolutionary dynamics.
Results
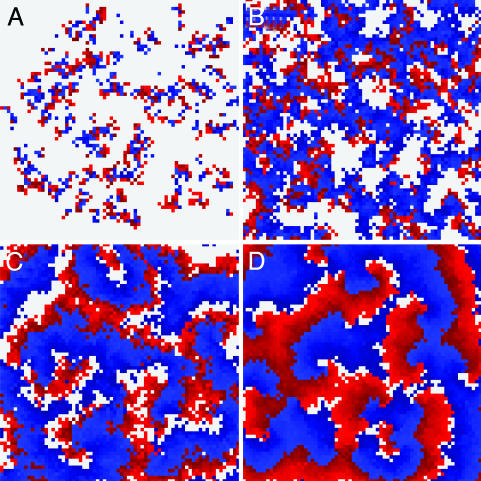
Spatial Patterns. The model reveals a variety of self-organized patterns for different combinations of infection rate and infection period (Fig. 2 and Movies 1–4, which are published as supporting information on the PNAS web site). When the number of secondary infections is low, the spatial dynamics are characterized by small localized clusters of infection that propagate through a matrix of susceptible hosts (Fig. 2 A). As these infection clusters grow, the availability of susceptible hosts per infected host is reduced, decreasing the number of new infections (20, 27). For high infection rate and/or long infection period, the spatial dynamics show regularly reoccurring infection waves, consisting of spiral waves or circular waves (Fig. 2D). In between localized clusters and regular waves, a region of turbulent waves exists (Fig. 2 B and C) (28). Here, infection waves commonly break into fragments. The break points function as new sources from which waves originate.
Fig. 2.
Spatial patterns in the contact network for various combinations of infection rate β and infection period τI. Colors represent the following: gray, susceptible; red, infected; blue, resistant. (A) Localized disease outbreaks are self-limiting in size for τI = 1.0 and β = 0.3. (B) Turbulent waves for τI = 0.5 and β = 1. Here, infection waves are narrow, and occasionally waves break and new wave centers are formed. (C) The transition between turbulent and regular waves, τI = 0.3 and β = 2.75 (R0 = 6.6), to which evolutionary trajectories are drawn. (D) Stable spiral waves for τI = 0.7 and β = 4.2. These waves are broad and do not easily break, resulting in periodically reoccurring infection waves. Grid size for all panels is 75 × 75. In all results presented, τR was set to unity.
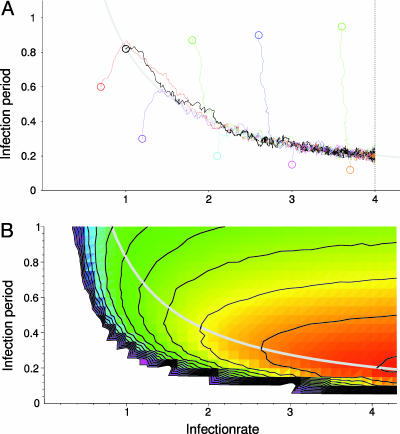
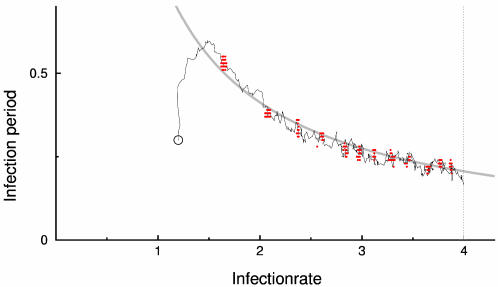
Evolutionary Dynamics. Subsequently, the infection period and infection rate were allowed to evolve independently. Remarkably, instead of evolving toward maximal infection period and infection rate (thus maximizing R0), all evolutionary trajectories are quickly drawn to a hyperbolic relationship between infection rate and infection period (at approximately R0 = 6.6), and slowly track this line toward maximal infection rate (Fig. 3A; see Fig. 4 for evolutionary dynamics). Notably, if such an evolving pathogen population would be observed, it would seem as if there existed a trade-off between infection period and infection rate. Yet, unlike the classical trade-offs, this relationship is not defined beforehand, but emerges from the evolutionary dynamics of the system. We will refer to this relationship as an “emergent trade-off”, as opposed to the classical trade-offs, which are explicitly specified based on assumed physiological limitations.
Fig. 3.
Evolutionary trajectories follow paths of increasing outbreak frequency. (A) Evolutionary trajectories of evolution of infection rate and infection period. Circles represent the initial pathogen traits for nine simulations. The trajectories represent the change in the mean infectiousness and infection period. Mutation rate is set at μ = 0.01, mutation stepsize is Δβ =±0.01, and ΔτI = ±0.01. Maximum infection rate was set at β = 4. Regardless of initial conditions, evolution proceeds to and along an emergent trade-off relationship between infection rate and infection period. This trade-off can be described by R0 = 8 βτI = 6.6 (gray curve). (B) Outbreak frequency was measured by the average frequency at which hosts are infected. Outbreak frequency increases from blue to green, yellow, orange, and red. The emergent trade-off (gray curve represents R0 = 6.6) corresponds to a ridge of high outbreak frequency. In the white area, for R0 of approximately <1.6, simulations lead to pathogen extinction. This raised existence threshold (in the nonspatial model, the threshold is R0 = 1) is caused by local self-shading of infected hosts (31). Results shown are for a 120 × 120 grid.
Fig. 4.
Evolutionary dynamics. The evolutionary trajectory (black line) represents the change in the population's mean infection rate and infection period over time (same as Fig. 3). Point clouds represent all pathogen types present in the 120 × 120 grid at one time. The point clouds are plotted every 5,000 time units to give an indication of the temporal dynamics of the evolutionary process. During evolution, pathogen diversity is low; typically only two and three step mutants are present. Relaxation to the R0 = 6.6 emergent trade-off line (gray line) is relatively fast, whereas progression along the line is much slower. This result occurs because, along the trade-off, traveling waves are relatively stable, slowing down the spread of new genetic information through the system.
We tested the robustness of our results against low frequencies of long-distance transmission. We implement “global mixing” rules similar to Boots and Sasaki (3). In this implementation, a host has a small probability of interacting with a random host in the population instead of with a neighbor. Results for global mixing up to 2% of all contacts are very similar to the results presented. Evolutionary trajectories closely follow an inverse relationship between infection rate and infection period that is (depending on the level of global mixing) slightly above R0 = 6.6.
Using 100% global mixing, results in a mean-field approximation of our model. Under such mean-field conditions, the system can display oscillations in the number of infected hosts. These oscillations increase in amplitude and period with increasing infection rate and infection period, similar to the spatial model. However, these oscillations are very slow compared with local outbreak waves in the spatial model, because they cannot benefit from spatial spread of pathogens. In fact, large mean-field oscillations will lead to (stochastic) extinction of the pathogen for larger values of infection rate and infection period.
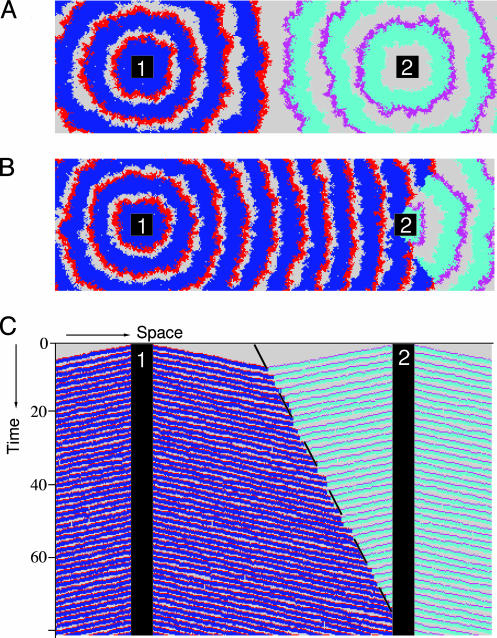
“A Tale of Two Cities.” The emergent trade-off corresponds roughly to the transition region between turbulent waves and regular waves (Fig. 2C). Apparently, in the regular wave domain, selection is for decreased infection period, i.e., for decreased R0. This behavior can be explained by selection for outbreak frequency, as all evolutionary trajectories in Fig. 3A closely follow paths of increasing frequency (Fig. 3B). The emergent trade-off corresponds to an attracting ridge in the frequency landscape. Selection for outbreak frequency has previously been described in excitable media (29) and parasitoid-host models (16). To demonstrate the mechanism, we performed an experiment in which two “cities” emit infection waves into the surrounding area at different frequency (Fig. 5A). Both cities harbor the same pathogen genotype so that frequency is singled out as the only variable. The point where waves collide shifts in favor of the city with higher outbreak frequency (Fig. 5B), with a speed determined by the difference between the two frequencies (Fig. 5C) (29). It is exactly this mechanism of expansion of more frequent waves that causes the selection for decreased infection period in Fig. 3A.
Fig. 5.
An illustration of the mechanism of selection for outbreak frequency. (A) Two “cities,” numbered 1 and 2, emit infection waves at frequency f1 = 0.625 and f2 = 0.5, respectively. In contrast to our full spatial model, where outbreak frequency is a result of spatial pattern formation and depends on infection rate and infection period, these defined “city areas” simply periodically infect all hosts directly surrounding them. The cities differ only in outbreak frequency and have identical pathogen genotypes, with infection rate β = 3 and infection period τI = 0.3. Colors are gray for susceptible hosts, red and blue for infected and resistant hosts from city 1, and magenta and cyan for infected and resistant hosts from city 2 (t = 7). (B) At t = 75, the waves from city 1, with the higher outbreak frequency, have completely taken over the area between the two cities. The takeover process can be visualized by plotting a horizontal cross section through both cities against time (C). The observed displacement speed can be accurately quantified by  (dashed line), where v is the speed of the infection waves (29). Grid size is 120 × 400 cells.
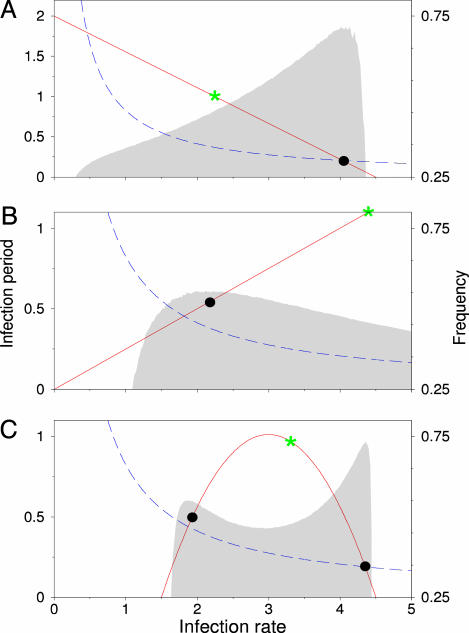
Explicit Trade-Offs. Selection for outbreak frequency alone cannot explain a limitation in the evolution of infectiousness and the ensuing shortening of the infection period. This limitation could be set by physiological constraints or explicit trade-offs between infectiousness and virulence. We confined evolution to various curves representing such physiological trade-offs to see how this confinement affects evolution in our system. It turns out that, also on an explicit linear trade-off curve, selection is for maximal outbreak frequency (Fig. 6A). Interestingly, also in case of a positive linear relation between infection rate and infection period (Fig. 6B), selection for maximal frequency leads to an evolutionary attractor with intermediate infection rate and period. Nonspatial theory would predict runaway selection (i.e., maximal infection rate and infection period) in such a “trade-on” situation. Other, nonlinear couplings between infection rate and infection period can even lead to alternative evolutionary attractors (Fig. 6C), caused by the existence of two local frequency optima. Which evolutionary attractor is reached depends on initial conditions, where the frequency minimum separates the two basins of attraction. The evolutionary attractors are all close to the emergent trade-off, as the intersection of an explicit trade-off curve with the ridge in the frequency landscape often creates a local frequency optimum.
Fig. 6.
Evolutionary optimization along explicit trade-offs. Red lines represent trade-offs, i.e., combinations of infection rate and infection period to which evolution is constrained. Green stars indicate maximal number of secondary infections (i.e., maximal R0). Black dots indicate the endpoint of evolutionary simulations. Outbreak frequency is indicated by the gray shaded area. The emergent trade-off at R0 = 6.6 is shown by a blue dashed line. (A) Evolution along a linear trade-off between infection rate and infection period leads to evolutionary optimization close to maximum outbreak frequency. (B) Selection for outbreak frequency can limit evolution for increased infection rate and infection period, even when these traits are positively correlated. (C) Nonlinear trade-off curves that result in multiple local frequency optima give rise to alternatively stable evolutionary attractors. Results shown are for a 120 × 120 grid.
Discussion
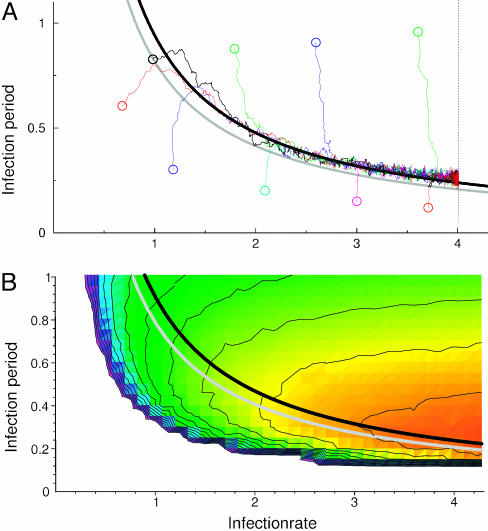
We conclude that spatial patterns with or without physiological trade-offs can induce selection for short lasting infections. Short infections can, e.g., be accomplished by easy immune clearance. Selection for outbreak frequency could thus be relevant to the evolution of parasites that cause relatively mild but frequent infections. Results presented here are remarkably robust for changes in network topology, e.g., using a hexagonal grid or a 24 (5 × 5) cell neighborhood still leads to the emergent trade-off around R0 = 6.6. The value of R0 = 6.6 is, however, not a universal constant. For example, stochasticity in the infection period does lead to an emergent trade-off, but at higher values of R0, corresponding to a change in the frequency landscape (see Fig. 7). Our current model is homogeneous, but infection waves also have been demonstrated to exist in nonhomogeneous real-world situations (22, 23). In fact, large cities (harboring infections endemically) could act as a source of infection waves. However, many diseases are seasonal, and therefore an important question for further studies is how seasonality can influence spatial pathogen evolution. Wave-like patterns are also observed in many ecological systems, such as predator–prey dynamics (30), and our results, showing how spatial pattern formation can link survival to reproduction and dispersal, might have importance for evolutionary dynamics in these systems as well.
Fig. 7.
Evolutionary trajectories for a stochastic infection period. (A) Evolutionary trajectories, representing the change in mean infection rate and infection period, resulting from using a lognormally distributed (stochastic) infection period. Vertical axis represents the lognormal distribution mean; standard deviation was set at 0.1. Evolution again proceeds to and along a hyperbolic trade-off relationship between infection rate and infection period, but this time the emergent trade-off is located at R0 = 7.6 (black curve). The gray curve indicates R0 = 6.6 for comparison. (B) The shift in the emergent trade-off corresponds to changes in the frequency landscape. The emergent trade-off can be shifted even further by increasing the standard deviation of the lognormal distribution. Parameters and colors are as in Fig. 3; results shown are for a 120 × 120 grid.
Supplementary Material
Acknowledgments
We thank A. M. de Roos for valuable suggestions on the manuscript. W.M.v.B. was supported by the Netherlands Organization for Scientific Research, and M.C.B. was supported by a fellowship from the Royal Netherlands Academy of Arts and Sciences.
Author contributions: W.M.v.B. and M.C.B. designed research, performed research, contributed new reagents/analytic tools, analyzed data, and wrote the paper.
This paper was submitted directly (Track II) to the PNAS office.
References
- 1.Bull, J. J. (1994) Evolution 48, 1423–1437. [DOI] [PubMed] [Google Scholar]
- 2.Frank, S. A. (1996) Q. Rev. Biol. 71, 37–78. [DOI] [PubMed] [Google Scholar]
- 3.Boots, M. & Sasaki, A. (1999) Proc. R. Soc. London Ser. B Biol. Sci. 266, 1933–1938. [DOI] [PMC free article] [PubMed] [Google Scholar]
- 4.Gandon, S., Mackinnon, M. J., Nee, S. & Read, A. F. (2001) Nature 414, 751–756. [DOI] [PubMed] [Google Scholar]
- 5.van Baalen, M. & Sabelis, M. W. (1995) Am. Nat. 146, 881–910. [Google Scholar]
- 6.Boots, M., Hudson, P. J. & Sasaki, A. (2004) Science 303, 842–844. [DOI] [PubMed] [Google Scholar]
- 7.Messenger, S. L., Molineux, I. J. & Bull, J. J. (1999) Proc. R. Soc. London Ser. B Biol. Sci. 266, 397–404. [DOI] [PMC free article] [PubMed] [Google Scholar]
- 8.Fenner, F. & Ratcliffe, R. N. (1965) Myxomatosis (Cambridge Univ. Press, Cambridge, U.K.).
- 9.Lipsitch, M. & Moxon, R. E. (1997) Trends Microbiol. 5, 31–37. [DOI] [PubMed] [Google Scholar]
- 10.Bremmerman, H. J. & Thieme, H. R. (1989) J. Math. Biol. 27, 179–190. [DOI] [PubMed] [Google Scholar]
- 11.Ewald, P. W. (1994) Evolution of Infectious Disease (Oxford Univ. Press, Oxford).
- 12.Lipsitch, M., Siller, S. & Nowak, M. A. (1996) Evolution 50, 1729–1741. [DOI] [PubMed] [Google Scholar]
- 13.Ewald, P. W. (2002) in Adaptive Dynamics of Infectious Diseases: In Pursuit of Virulence Management, eds. Dieckmann, U., Metz, J. A. J., Sabelis, M. W. & Sigmund, K. (Cambridge Univ. Press, Cambridge, U.K.), pp. 399–412.
- 14.Ebert, D. & Bull, J. J. (2003) Trends Microbiol. 11, 15–20. [DOI] [PubMed] [Google Scholar]
- 15.Boerlijst, M. C. & Hogeweg, P. (1991) Physica D 48, 17–28. [Google Scholar]
- 16.Boerlijst, M. C., Lamers, M. E. & Hogeweg, P. (1993) Proc. R. Soc. London Ser. B Biol. Sci. 253, 15–18. [Google Scholar]
- 17.Johnson, C. R. & Boerlijst, M. C. (2002) Trends Ecol. Evol. 17, 83–90. [Google Scholar]
- 18.Claessen, D. & de Roos, A. M. (1995) Oikos 74, 401–413. [Google Scholar]
- 19.Rand, D. A., Keeling, M. & Wilson, H. B. (1995) Proc. R. Soc. London Ser. B Biol. Sci. 259, 55–63. [Google Scholar]
- 20.Haraguchi, Y. & Sasaki, A. (2000) J. Theor. Biol. 203, 85–96. [DOI] [PubMed] [Google Scholar]
- 21.Boots, M. & Sasaki, A. (2000) Ecol. Lett. 3, 181–185. [Google Scholar]
- 22.Grenfell, B. T., Bjornstad, O. N. & Kappey, J. (2001) Nature 414, 716–723. [DOI] [PubMed] [Google Scholar]
- 23.Cummings, D. A. T., Huang, N. E., Endy, T. P., Nisalak, A., Ungchusak, K. & Burke, D. S. (2004) Nature 427, 344–347. [DOI] [PubMed] [Google Scholar]
- 24.Anderson, R. M. & May, R. M. (1991) Infectious Diseses of Humans (Oxford Univ. Press, Oxford).
- 25.Durret, R. (1995) in Epidemic Models: Their Structure and Relation to Data, ed. Mollison, D. (Cambridge Univ. Press, Cambridge, U.K.).
- 26.Johansen, A. (1996) J. Theor. Biol. 178, 45–51. [DOI] [PubMed] [Google Scholar]
- 27.Keeling, M. J. (1999) Proc. R. Soc. London Ser. B Biol. Sci. 264, 859–867. [Google Scholar]
- 28.Tyson, J. J. & Keener, J. P. (1988) Physica D 32, 327–361. [Google Scholar]
- 29.Zaikin, A. N. & Zhabotinsky, A. M. (1970) Nature 225, 535–537. [DOI] [PubMed] [Google Scholar]
- 30.Sherratt, J. A. (2001) Ecol. Lett. 4, 30–37. [Google Scholar]
- 31.Levin, S. A. & Durrett, R. (1996) Proc. R. Soc. London Ser. B Biol. Sci. 351, 1615–1621. [DOI] [PubMed] [Google Scholar]
Associated Data
This section collects any data citations, data availability statements, or supplementary materials included in this article.


