

Abstract
To understand the potential and limitations of circulating tumor cell (CTC) sequencing for molecular diagnostics, we investigated the feasibility of identifying the ubiquitous KRAS mutation in single CTCs from pancreatic cancer (PC) patients. We used the NanoVelcro/laser capture microdissection CTC platform, combined with whole genome amplification and KRAS Sanger sequencing. We assessed both KRAS codon-12 coverage and the degree that allele dropout during whole genome amplification affected the detection of KRAS mutations from single CTCs. We isolated 385 single cells, 163 from PC cell lines and 222 from the blood of 12 PC patients, and obtained KRAS sequence coverage in 218 of 385 single cells (56.6%). For PC cell lines with known KRAS mutations, single mutations were detected in 67% of homozygous cells but only 37.4% of heterozygous single cells, demonstrating that both coverage and allele dropout are important causes of mutation detection failure from single cells. We could detect KRAS mutations in CTCs from 11 of 12 patients (92%) and 33 of 119 single CTCs sequenced, resulting in a KRAS mutation detection rate of 27.7%. Importantly, KRAS mutations were never found in the 103 white blood cells sequenced. Sequencing of groups of cells containing between 1 and 100 cells determined that at least 10 CTCs are likely required to reliably assess KRAS mutation status from CTCs.
The development of molecularly targeted agents in oncology has rapidly advanced in recent years, with >800 drugs in clinical trials as of 2013.1 Thus, therapeutic decisions are increasingly being made based on actionable genetic data obtained from a patient's tumor, resulting in precision treatment strategies. Although biopsy or surgical excision has been the traditional means of obtaining tissue from solid tumors, these procedures are costly, painful, and not without risk to the patient. This is especially true for difficult-to-biopsy tumors such as pancreatic cancer (PC), in which multiple biopsies or even multiple procedures are required to obtain sufficient tumor tissue for genetic testing.2 Because of these limitations, alternatives to traditional biopsy techniques are an area of active research and will be crucial to realizing the potential of precision medicine for many tumor types.
Circulating tumor cells (CTCs), which are thought to originate from primary or metastatic sites and to circulate in the blood, represent one such alternative source of tumor tissue for the diagnosis, staging, management, and prognostication of solid cancers.3, 4 The enumeration of CTCs using the CellSearch platform currently has Food and Drug Administration approval as an adjunctive prognostic marker during therapy in many solid cancers.5 The development of CTC assays that allow for the capture and isolation of CTCs for further analysis has the potential to transform CTCs into a liquid biopsy for cancers. Such a liquid biopsy has innumerable applications, from diagnosing patients with difficult-to-biopsy tumors to the real-time monitoring of a cancer's genotypic changes in response to therapy.6 However, for CTCs to realize their potential as a convenient source of tumor tissue, important methodologic issues must be addressed.
The primary issue that CTC assays must overcome is the rarity of CTCs in circulating blood, because an average 7.5-mL blood draw typically contains only 1 to 50 CTCs versus several million white blood cells (WBCs).7 Differentiating CTCs from the vast hematopoietic cell background requires highly sensitive and specific assays, as well as a means of confirming that the cells captured are actually of tumor origin. One means of doing so is by using molecular analysis in addition to immunocytochemistry (ICC) to confirm that the cells are of tumor origin. However, for molecular analysis, the small number of CTCs available is further hindered by the limited amount of DNA per cell. Thus, whole genome amplification (WGA) methods are required to bridge the gap between the picogram quantities of DNA available in a single cell and the nanogram to microgram amounts required for most molecular studies.
Studies of WGA from single cells have demonstrated the capability to achieve >10,000-fold amplification with up to 96% genome coverage.8 Furthermore, WGA has allowed researchers to successfully perform whole exome and even whole genome sequencing of single cells.9 However, WGA amplification is not linear, and amplification bias, especially in GC-rich regions, is an inherent limitation. Unequal amplification can even result in the total loss of one allele over multiple rounds of amplification, termed allele dropout (ADO).8 Thus, the limitations of WGA affect CTC sequencing in two major ways: by failure of the WGA reaction to provide coverage of the gene of interest and by ADO of the mutant allele, resulting in only the wild-type sequence amplifying when in fact a mutant allele is present. It is important to differentiate these limitations because they affect the clinical implications of CTC sequencing studies in dramatically different ways. For example, for heterozygous mutations coverage alone is not representative of the mutation detection rate (MDR) due to the effects of ADO. Thus, successful sequence coverage and mutation detection need to be considered separately in characterizing CTC sequencing results. How these limitations affect CTC sequencing results have not been well characterized to date.9
In this study, we sought to better understand the potential and limitations of single-cell sequencing of PC CTCs as it relates to their development as a clinical biomarker for diagnostic and pharmacogenomic applications. We did so by studying Kirsten rat sarcoma viral oncogene homolog (KRAS) sequencing of single cells from both PC cell lines and patient CTC samples. We chose to study PC because >95% of patients have an early activating driver mutation in the KRAS oncogene, and 98% of those mutations are located in codon 12.10, 11 Thus, sequencing of a single codon can provide molecular evidence distinguishing CTCs from hematopoietic cells. For CTC isolation we used the NanoVelcro/laser capture microdissection (LCM) platform, which captures CTCs on a microfluidic chip using anti–epithelial cell adhesion molecule antibodies. We then identified captured CTCs by ICC and isolated them using LCM. We developed an ICC-based CTC definition for PC that incorporated nuclear morphologic and anti-carcinoembryonic antigen (CEA) staining, a glycoprotein tumor marker that is overexpressed in 80% of PC, to increase the specificity of the assay.12 We then studied our sequencing methods on single cells from five PC cell lines to assess the limits of our platform both in terms of KRAS codon 12 coverage and KRAS mutation detection rate. We applied these findings to CTCs from 12 PC patients to determine our mutation detection rate for KRAS mutations from single CTCs. Finally, we used our results to better understand the number of CTCs required for reliable KRAS mutational analysis.
Materials and Methods
PC Cell Lines
PC cell lines CFPAC-1, AsPC-1, Panc-1, BxPC-3, and HPAF-II were obtained from ATCC (Manassas, VA) and grown using RPMI 1640 Medium (ATCC) supplemented with 10% fetal bovine serum and 100 U/mL penicillin-streptomycin. All cell lines were grown at 37°C with 5% CO2 and were routinely passaged at 80% confluence using an iso-osmotic sodium citrate solution for cell release (Thermo Fisher Scientific, Waltham, MA). When preparing cells for single-cell isolation and analysis, cells were released from the culture plates using the same sodium citrate solution. After a wash with the culture medium, each cell line was diluted to a density of 1000 cells per 100 μL. Approximately 1000 cells (100 μL) were smeared on polyethylene naphthalate membrane slides (Leica Microsystems Inc., Buffalo Grove, IL), air-dried for 10 minutes, and fixed with 100 μL of 100% ethanol. Cells were then isolated by laser microdissection as outlined in Chip Scanning, CTC Identification, and Laser Microdissection. Batch genomic DNA was prepared from the entire contents of a 75-mm2 plate at 80% confluence. DNA was extracted using the Qiagen (Valencia, CA) Blood and Cell Culture DNA Mini Kit according to the manufacturer's protocol.
Patients Samples
Twelve patients with pathologic disease confirmed as pancreaticobiliary cancers were voluntarily enrolled in the study under University of California Los Angeles Institutional Review Board protocol 11-002112. All 12 patients underwent a venous blood draw that began with a 5-mL waste to prevent epithelial cell contamination, followed by collection of at least a 10-mL sample into two 8.5-mL ACD Solution A tubes (BD, Franklin Lakes, NJ). After collection, the blood was inverted at least 10 times, followed by transport to the laboratory on ice. Samples were stored for <24 hours at 4°C before processing.
Sample Processing
Our workflow for sample processing is outlined in Figure 1. Density gradient centrifugation of patient samples was performed using 12-mL LeucoSep centrifuge tubes (VWR, Radnor, PA) according to the manufacturer's protocol. The buffy coat layer was washed with 5 mL of wash medium (RPMI with 5% fetal bovine serum; Gibco, Carlsbad, CA) and centrifuged at 300 × g for 10 minutes at 4°C, and the pellet was resuspended in 200 μL of wash medium. Biotinylated anti–epithelial cell adhesion molecule antibody (6 μL; R&D Systems, Minneapolis, MN) was added, and the mixture was placed on a shaker at 4°C for 1 hour. After an additional wash step, the pellet was resuspended in 200 μL of PBS and immediately processed on the NanoVelcro/LCM CTC platform.
Figure 1.

Overview of the single-cell sequencing workflow using NanoVelcro/LCM and stepwise workflow analysis of single-cell sequencing results from cell line studies. After CTC or PC cell line identification by ICC, individual cells are isolated by LCM. Transfer efficiency of LCM was determined based on identification of the cell isolated in the Eppendorf tube cap. Single cells then underwent WGA, and success was assessed by demonstration of a smear band. Next, KRAS PCR was performed and was considered successful if a band of the proper size (295 bp) was found with gel electrophoresis. Finally, Sanger sequencing success was determined by visual inspection of the trace file. A total of 163 single cells were isolated and sequenced, and the success of the individual steps in the workflow was analyzed, revealing that WGA was responsible for most sequencing failures. Data are expressed as n (%). CTC, circulating tumor cell; ICC, immunocytochemistry; LCM, laser capture microdissection; MDA, multiple displacement amplification; PC, pancreatic cancer; Sanger Seq, Sanger sequencing; WGA, whole genome amplification.
NanoVelcro/LCM CTC Chip Processing
NanoVelcro/LCM CTC chips were assembled and operated as described previously.13, 14 Briefly, poly(lactic-co-glycolic acid) nano-spun chips, manufactured by an electro-spin method in our nano-materials laboratory, were assembled onto a laser microdissection slide (Leica Microsystems Inc.) with an overlaid polydimethylsiloxane microfluidic component and attached to a syringe-based microfluidic pump (KD Scientific, Holliston, MA). Prepared samples were injected through the device at the previously established optimal flow rate of 0.5 mL/hour and were then fixed using 100% ethanol.15
ICC and Nuclear Staining
After fixation, processed chips were washed in phosphate-buffered saline (PBS). Chips were then blocked using PBS with 2% donkey serum (Jackson Immunoresearch, West Grove, PA) for 1 hour. Chips were then incubated with a primary antibody cocktail containing two rabbit anti-pancytokeratin antibodies (Invitrogen, Carlsbad, CA; Abcam, Cambridge, MA), two mouse anti-CD45 antibodies (BD Pharmigen, San Diego, CA; Abcam), and one chicken anti-CEA antibody (Abcam) overnight at 4°C. After primary antibody incubation, chips were washed again in PBS. Secondary antibody incubation was performed for 1 hour at room temperature using a cocktail of Alexa Fluor 488 donkey anti-rabbit (Invitrogen), Alexa Fluor 555 donkey anti-mouse (Invitrogen), and Alexa Fluor 647 goat anti-chicken (Invitrogen). Incubation took place in PBS with 2% donkey serum. Chips were again washed in PBS with 2% donkey serum and then stained with Hoechst 33342 (Life Technologies, Carlsbad, CA) for nuclear visualization.
Chip Scanning, CTC Identification, and Laser Microdissection
After immunostaining, automated chip scanning was performed at 40× power with a Nikon (Tokyo, Japan) Eclipse 90i scanning fluorescent microscope using NIS Elements 4.1 software (Nikon). Manually acquired 400× power images of candidate cells were then obtained. For ICC, we added CEA and nuclear morphologic characteristics to the standard ICC CTC definition in an attempt to increase our specificity. Thus, WBCs were defined as Nuclear+/CD45+/CK−/CEA− and CTCs as Nuclear+/CD45−/and CK+ or CEA+. Nuclear structural characteristics were assessed by a trained cytopathologist and were included in our CTC definition. The positional coordinates of cells to be isolated were then input into the PALM MicroBeam laser microdissection system (Carl Zeiss, Thornwood, NY). After locating cells using the preprogrammed coordinates on the LCM device, single cells were laser dissected and collected into 200-μL tube caps (Carl Zeiss) using the laser pressure catapult function. Cell transfer to the tube cap was confirmed by imaging the cap before cap closure.
WGA, KRAS PCR
Isolated cells were then subjected to genomic DNA isolation and WGA using the REPLI-g Single Cell Kit (Qiagen) according to the manufacturer's protocol. Genomic amplification occurred at 30°C for 8 hours. WGA products were cleaned using the QIAquick PCR Purification Kit (Qiagen). Cleaned WGA products underwent PCR amplification of KRAS exon 2 using the following primers (Integrated DNA Technologies, Coralville, IA): forward 5′-AAGGTACTGGTGGAGTATTTG-3′ and reverse 5′-GTACTCATGAAAATGGTCAGAG-3′, resulting in a predicted amplicon length of 295 bp. Melting temperatures were 51.9°C and 51.0°C for the forward and reverse primers, respectively. PCR reactions were performed on an Arktik Thermal Cycler (Thermo Fisher Scientific) using the Platinum PCR SuperMix High Fidelity Kit (Invitrogen) with total volumes of 50 μL per reaction and 200 ng of template DNA according to the manufacturer's protocol. The reaction conditions were as follows: denaturation at 94°C for 30 seconds, annealing at 55°C for 30 seconds, and extension at 68°C for 45 seconds for a total of 35 cycles. PCR success was confirmed by demonstration of the expected 295-bp band on 2% agarose gel electrophoresis.
Sanger Sequencing
The PCR products were then purified using the QIAquick PCR Purification Kit (Qiagen) and eluted into 25 μL of nuclease-free water (Qiagen). DNA was diluted to a concentration of 15 ng/μL based on Nanodrop quantification of the PCR product. Automated dideoxy terminator sequencing was performed by capillary electrophoresis by the University of California Los Angeles GenoSeq Core on an ABI 3730 DNA analyzer using Big Dye Terminator chemistry (Applied Biosystems, Foster City, CA). Bidirectional sequencing was used to confirm the specificity of the target in selected samples using the primers listed in the previous paragraph. The forward primer was then used for subsequent sequencing runs. Sequences were analyzed by two methods. All sequences were analyzed by manual inspection of the individual trace files using Four Peaks (Nucleobytes, Aalsmeer, the Netherlands), as well as using ab1 Peak Reporter (Thermo Fisher Scientific). A minor allele peak height of >10% by the 7-scan window of ab1 Peak Reporter was used to define heterozygous samples.
Statistical Analysis
Statistical analyses were performed with the Rstudio version 0.99.489 environment of the open source software RStudio (Boston, MA; https://www.rstudio.com). Descriptive statistics were used to summarize cell line and patient sample sequencing results. Pearson's χ2 test with Yates' continuity correction was used to compare KRAS codon 12 coverage and MDRs. The likelihood of detecting mutations was calculated by single event binomial distribution using the following equation: P = nCx × px × qn–x, with nCx = n!/(x! × (n − x)!), where p = the probability of detecting a mutation, and n = the number of single CTCs sequenced.
dPCR
Digital PCR (dPCR) was performed on a QuantStudio 3D digital PCR System (Thermo Fisher Scientific) according to the digital MIQE Guidelines.16 The TaqMan KRAS_521 (Assay ID: AH6R5PI) assay was used for primers and probes. Reaction mixes (18 μL) were prepared, containing 9 μL twofold QuantStudio 3D Digital PCR Master Mix (Thermo Fisher Scientific), 0.9 μL 20-fold TaqMan KRAS_521 primer-probe mix, 1.8 μL diluted gDNA, and 6.3 μL nuclease-free water (Qiagen). The reaction mixture was loaded onto QuantStudio 3D Digital PCR 20 K Chips (Thermo Fisher Scientific) using an automatic chip loader according to the manufacturer's protocol. Loaded chips underwent thermocycling on the Gene Amp 9700 PCR System (Applied Biosystems, Waltham, MA) using the following conditions: initial denaturation at 96°C for 10 minutes, followed by 39 cycles of 98°C for 30 seconds and 60°C for 2 minutes. VIC and FAM imaging of each chip was performed by the instrument, which assesses raw data and calculates the estimated concentration of the nucleic acid sequence targeted by the FAM and VIC dye-labeled probes by Poisson distribution. The raw data were then uploaded to QuantStudio 3D AnalysisSuite Cloud Software version 3.0.3 (Thermo Fisher Scientific) for analysis. For all samples, fluorescent cutoff values were determined using the no template control sample and then applied to the experimental chip. The lasso tool was used when individual well calls were not correctly assigned by the no template control fluorescent cutoffs.
Results
Single-Cell KRAS Sequencing of PC Cell Lines
To test the feasibility of single-cell sequencing using the NanoVelcro/LCM platform, we used five PC cell lines with differing KRAS mutations and zygosity. We captured and isolated a total of 163 single cells using the NanoVelcro/LCM platform, including 60 CFPAC-1 (heterozygous G12V) cells, 44 PANC-1 (heterozygous G12D) cells, 27 HPAF-II (heterozygous G12D) cells, 21 AsPC-1 (homozygous G12V) cells, and 13 BxPC-3 (wild-type) cells. Each cell then underwent WGA, KRAS PCR amplification, and Sanger sequencing. To better understand the factors that contributed to the successful coverage of KRAS codon 12, we performed a stepwise workflow analysis of our methods to determine the success rate of each step (Figure 1). Confirmation of LCM transfer of single cells was determined by visualization of a cell in the cap on inverted microscopy. The success of WGA and KRAS PCR was determined by visualization of a smear or band by gel electrophoresis, respectively. KRAS codon 12 coverage was determined by manual inspection of the individual trace files. With the use of this method, we determined which step failed for the 60 single cells that did not successfully show an interpretable Sanger trace file. We discovered that failure occurred at all steps in our method. However, the majority (81.7%) occurred during WGA (n = 49), followed by KRAS PCR (n = 6; 10%), Sanger sequencing (n = 3; 5%), and LCM transfer (n = 2; 3.3%). Overall, we obtained KRAS codon 12 coverage in 103 of 163 single cells sequenced (63.2%).
KRAS MDR
After establishing the success rate for amplification and sequencing of KRAS exon 2 from a single cell, we next investigated our ability to detect a mutation if it is known to be present. To do so we calculated and analyzed our MDR, defined as the percentage of single cells that demonstrated a mutant KRAS codon 12 allele over the total cells isolated. By comparing sequencing results from heterozygous and homozygous cell lines, we were able to quantify the effects of ADO on the MDR. We first sequenced batch gDNA to confirm the published KRAS mutations as well as their allele frequencies (Figure 2). Next, sequencing results from the 81 heterozygous single cells were interpreted using the peak-7 window function of ab1 Peak Reporter, with a threshold of >10% for base calling of the minor allele peak. The sequences were then classified as mutation only, both mutation and wild-type (heterozygous or double peak), or wild-type only (Figure 2). ADO rate was calculated as the percentage of single cells demonstrating only a single peak at the heterozygous site. We determined that ADO occurred in 68 of 81 single cells (85%; range, 79% to 89%) sequenced from the three heterozygous cell lines.
Figure 2.

Comparison of single cell KRAS sequencing results from different PC cell lines. Cell lines with both heterozygous and homozygous codon 12 mutations were analyzed, and the batch gDNA trace files for the different cell lines are depicted with codon 12 underlined. On the basis of the KRAS sequence base calls, individual cells were classified as demonstrating the mutation only, the wild-type only, or both alleles, indicative of a heterozygous sequence. ADO rate was calculated as the number of single-cell sequences that demonstrated only one of the two alleles in the heterozygous samples. MDR was defined as the percentage of single cells demonstrating a mutant allele over the total number of single cells isolated for sequencing. Homozygous cell lines were used as positive (AsPC-1) and negative (BxPC-3) controls. ADO, allele dropout; het, heterozygous; homo, homozygous; MDR, mutation detection rate; PC, pancreatic cancer; WT, wild-type.
Given the high rate of ADO when sequencing single cells, we then investigated our ability to detect KRAS mutations from single cells. Of the 81 heterozygous single cells that demonstrated KRAS codon 12 coverage, only 49 (60.5%) demonstrated a mutant allele (Figure 2). As expected, all 14 (100%) of the homozygous AsPC-1 cells demonstrated a mutant allele, and no mutations were found in the eight wild-type KRAS BxPC-3 cells. Overall, taking into account the entire workflow from cell capture to Sanger sequencing, we detected a KRAS mutation in 49 of 131 of heterozygous cells (37.4%) and 14 of 21 of homozygous cells (67%). Thus, ADO during WGA was the single biggest limitation to successful single-cell KRAS sequencing, greater than the error rate attributable to all other steps of our methods combined.
Performance of NanoVelcro/LCM on Clinical Samples
We developed an ICC definition for PC CTCs using the NanoVelcro/LCM system that incorporates anti-CEA staining and nuclear morphologic characteristics to the commonly used three-channel ICC definition to improve the specificity for identifying true circulating cells of tumor origin (Figure 3). We then studied the performance of the NanoVelcro/LCM assay on peripheral blood samples from 12 PC patients. We identified a total of 119 CTCs from the 12 patients, and at least one CTC was found per patient (range, 1 to 34 CTCs; average, 9.9 CTCs; median, 8 CTCs). In addition, we identified and isolated a total of 103 WBCs from the 12 patients to serve as negative controls. We used LCM to isolate the 222 single cells and performed single-cell WGA and KRAS Sanger sequencing as outlined in the previous section. We found a mutant KRAS sequence in at least one CTC from 11 of 12 patients (92%) (Supplemental Table S1). Importantly, no mutant KRAS sequences were found in any of the WBCs isolated and sequenced, demonstrating the specificity of our CTC definition for the NanoVelcro/LCM platform.
Figure 3.
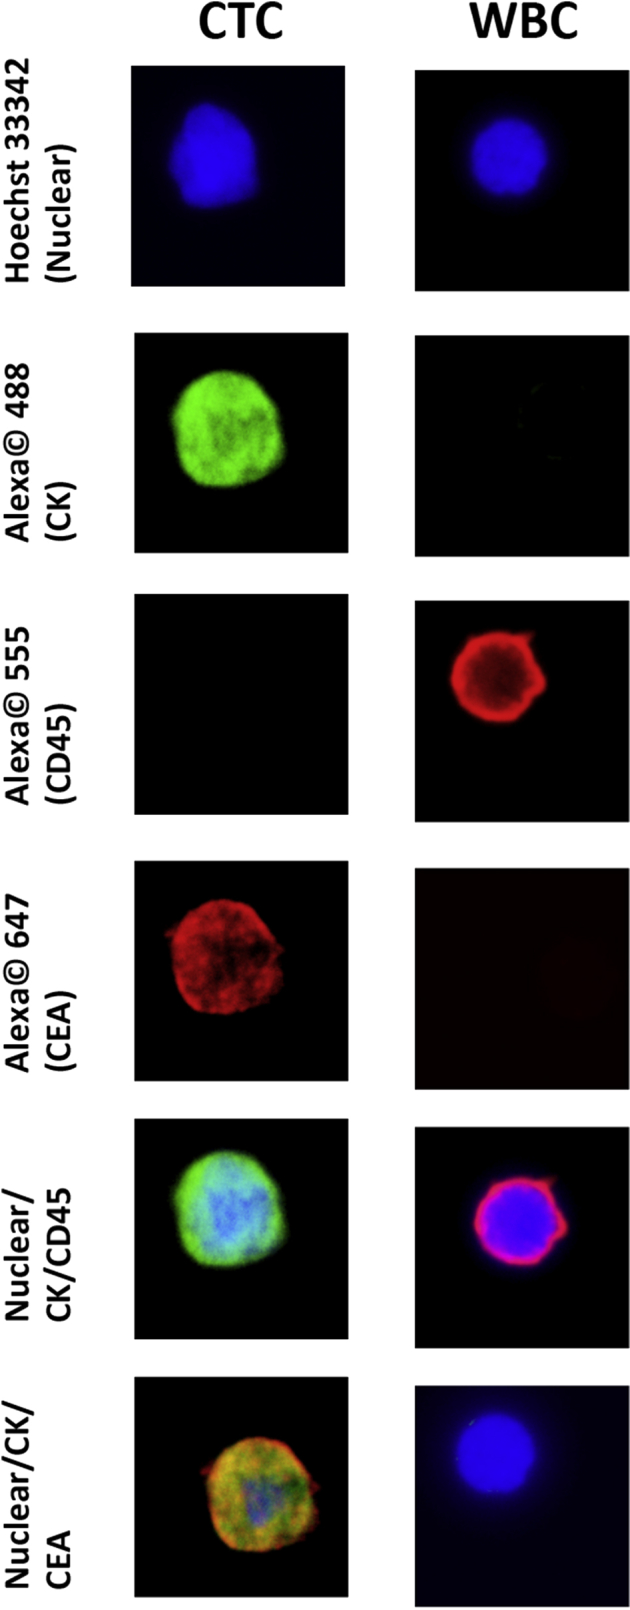
PC immunocytochemical definitions for CTCs and WBCs using the NanoVelcro/LCM assay. Representative images of the different immunofluorescent channels used to discriminate CTCs from WBCs are shown. Rows 5 to 6 are overlays of the channels above demonstrating the images that are typically used to distinguish CTCs from other circulating cells. Original magnification, ×40. CEA, carcinoembryonic antigen; CK, cytokeratin; CTC, circulating tumor cell; LCM, laser capture microdissection; PC, pancreatic cancer; WBC, white blood cell.
We then analyzed our results to determine the cause of error for the single cells that failed sequencing. We found that the type of cell did not significantly influence our single-cell sequencing results; we obtained KRAS codon 12 coverage in 60 of 119 CTCs (50.4%) and 55 of 103 WBCs (53.4%) (Table 1). Of the 60 patient CTCs with KRAS coverage, a mutation was identified in only 33 (55%). Thus, considering the entire workflow from cell capture to Sanger sequencing, our MDR for isolated CTCs was 27.7%, because we detected a mutant KRAS sequence in 33 of 119 CTCs (Table 2).
Table 1.
KRAS Sequencing of Single Cells from Patient Samples Demonstrating KRAS Mutations in CTCs but Not WBCs
| Cell type | Cells cut, n | KRAS coverage, n | Mutation detected, n |
|---|---|---|---|
| CTC | 119 | 60 | 30 |
| WBC | 103 | 55 | 0 |
| Total | 222 | 115 | 33 |
CTC, circulating tumor cell; WBC, white blood cell.
Table 2.
Stepwise Workflow Analysis for the 119 CTCs Studied
| Cell type | PC CTCs, n (%) |
|---|---|
| LCM transfer | 119 (100) |
| WGA | 77 (64.7) |
| KRAS PCR | 61 (51.2) |
| Sanger sequencing | 60 (50.4) |
| Mutation detected | 33/60 (55) |
| Mutation detection rate | 33/119 (27.7) |
CTC, circulating tumor cell; LCM, laser capture microdissection; PC, pancreatic cancer, WGA, whole genome amplification.
Overall, we found our CTC sequencing performed similarly to our cell line sequencing studies. Although our CTC MDR was significantly lower than that found for the homozygous cell lines (χ2 = 10.45, P < 0.01), it was similar to that of the heterozygous single cells (χ2 = 2.26, P = 0.14). On analysis of individual steps in the workflow, the only significant difference found between our patient CTC samples and single cells isolated from PC cell lines was the rate of successful PCR amplification, 79.2% versus 94.6%, respectively (χ2 = 9.11, P < 0.01).
Comparison of Multiple Cell Sequencing Results
Because ADO was determined to be a significant source of error for single-cell sequencing, we investigated ways to minimize it. Because ADO is a stochastic process, one means of overcoming it is by sequencing multiple single cells. We therefore investigated the number of single CTCs we would need to sequence to guarantee detection of a KRAS mutation. We first modeled our prediction based on our CTC sequencing results using single event binomial probability. We determined that if we were able to isolate 5 or 10 CTCs from a patient, we had an 80.2% or 96.3% chance of detecting a KRAS mutation in at least one CTC, respectively.
Another method for minimizing ADO is to increase the amount of template DNA by using more cells. To test if increasing the amount of starting template improved the detection rate, we performed our CTC sequencing protocol on groups of differing numbers of heterozygous HPAF-II cells (Figure 4). HPAF-II has a known mutant allele amplification, allowing us to also study how WGA amplification bias affects allelic fraction determination.17 We first confirmed the 75:25 mutant:wild-type allele frequencies by dPCR (Supplemental Figure S1). Then, a total of six replicates were run for each group of differing cell numbers. KRAS mutations were detected in 4 of 6 single cells (67%), 4 of 6 three-cell groups (67%), 6 of 6 five-cell groups (100%), 5 of 6 ten-cell groups (83%), and 6 of 6 (100%) of the 20-, 50-, and 100-cell groups. A heterozygous sequence, demonstrating both alleles without ADO, was obtained in 17% (1/6) single cells, 17% (1/6) of the 3-cell groups, 33% (2/6) of the 5-cell groups, 67% (4/6) of the 10-cell groups, 67% (4/6) of the 20-cell groups, and 100% (6/6) of the 50- and 100-cell groups. An accurate allelic ratio of the mutant allele to the wild-type allele (75:25) was not obtained from any of the 1-, 3-, or 5-cell groups, 17% (1/6) of the 10-cell groups, 50% (3/6) of the 20-cell groups, and 100% (6/6) of the 50- and 100-cell groups.
Figure 4.

Determination of the number of cells needed to ensure reliable KRAS sequencing. By analyzing the allelic ratio of the sequencing results from different numbers of starting cells, the minimum cellular input for reliable KRAS codon 12 Sanger sequencing can be analyzed. The batch gDNA demonstrates the expected 75:25 G12D mutation-to-wild-type allelic ratio for HPAF-II cells. For each group of differing numbers of cells, the replicate with the best sequence (ie, with an allelic ratio closest to that of batch gDNA) from among the six replicates is depicted. As the number of cells sequenced increases, the allelic ratio becomes more similar to that of batch gDNA. Analysis of all replicates indicates a significant increase in mutation detection reliability above the 5- to 10-cell threshold.
Discussion
CTCs have the potential to allow clinicians access to tumor tissue from a simple peripheral blood draw. However, for CTCs to realize their potential, important limitations of sequencing data from single cells must be understood and addressed.4 The first is ensuring that the CTC identification methods used discriminate CTCs from other circulating cells with high specificity. This high specificity is required for successful adoption of CTCs as a realistic alternative to traditional biopsies. Secondly, the isolation and sequencing of CTCs is difficult, requiring multiple independent techniques that all introduce possible sources of error that can lead to inaccurate representation of the tumor genotype. These errors must be studied and addressed if CTC sequencing is to have clinical relevance. Finally, the detection efficiency of CTC sequencing for actionable mutations must be established to assess the adequacy of a sample for genetic analysis and to prevent false-negative results from interfering with patient care.
In this study, we attempted to better understand the potential and limitations of the NanoVelcro/LCM platform for single-cell KRAS sequencing of CTCs in PC. We used PC cell lines to test our method and found that most sequencing failures occurred during WGA. We compared the sequencing results from heterozygous and homozygous single cells and found that ADO was the primary limiting factor of mutation detection from heterozygous samples. We then used the NanoVelcro/LCM platform to identify CTCs and other hematopoietic cells for isolation and single-cell KRAS sequencing from 12 PC patients. We demonstrated mutant KRAS sequences in CTCs from 11 of 12 patients (92%) and never found a mutant KRAS sequence in any of the other hematopoietic cells sequenced from the same patient. By analyzing our sequencing results, we were able to demonstrate that at least 10 CTCs are likely required to reliably determine KRAS mutations. We then confirmed this finding by sequencing groups of varying numbers of cells and, again, found a distinct drop in mutation detection for heterozygous alleles with <10 CTCs.
To help ensure that our results would model the realities of clinical CTC sequencing, we chose to use Sanger sequencing, which has a lower sensitivity than newer methods but is still the gold standard for clinical sequencing.18 In analyzing why sequencing failed, we found that most failures occurred during WGA, either from complete failure of the WGA reaction or, more commonly, due to ADO. Our ADO rate of 85% was near the upper limit of previously reported single-cell MDA-based WGA studies, which have ranged from as low as 10% to as high as 90%.8, 9, 19, 20 This high ADO rate may be at least partially attributed to our use of Sanger sequencing, which is less sensitive to low mutant allele fractions than newer methods.21
For clinical samples, we found CTCs in 100% of the 12 patients and confirmed a KRAS mutation in at least one CTC from 92% of the patients. Because the zygosity of KRAS mutations in our clinical samples was not known, we compared our CTC sequencing results with that from both homozygous and heterozygous cell lines. Our MDR for KRAS in clinical samples of 27.7% was significantly lower than that found from homozygous single cells, but statistically similar to that of heterozygous single cells that we sequenced. However, previous studies estimate that approximately 70% of KRAS mutations in PC are heterozygous, indicating that the similarity of our CTC sequencing results to the heterozygous cell lines is to be expected.22, 23 Overall, our SNP detection rate from CTCs is comparable with or better than previous studies using Sanger sequencing, which have reported rates as low as 10%.24, 25, 26
Our findings are important for two aspects of CTC research. First, for CTC technologies to move from an enumeration biomarker to a molecular diagnostic, different variables are likely to become important. Previous research had frequently attempted to liberalize CTC definitions in an attempt to increase the number of CTCs found from patients.27, 28 However, for CTC sequencing studies every effort must be made to ensure the specificity of CTC identification methods, because the introduction of any normal cells within the population would increase the risk of false negatives to the detriment of patients. To that end, we used the modular nature of the NanoVelcro/LCM CTC platform to incorporate anti-CEA staining and nuclear morphologic structure into our CTC definition to hopefully increase its specificity. Furthermore, we used CTC sequencing to validate our ICC definition, finding KRAS mutations only in cells we called CTCs and never in other hematopoietic cells. We found using an orthogonal method, such as molecular analysis, to confirm ICC definitions for CTCs important for demonstrating the tumor origin of the cells captured. We think it prudent for new CTC platforms to use such a method of verification to address the known limitations of ICC alone in defining CTCs.
Second, our study provides insight into the reality of CTC sequencing for clinical applications and the quantity of CTCs required for reliable mutation detection. Although single-cell CTC sequencing has been described previously, the variables required for reproducible, accurate sequencing for clinical use have not been studied.29, 30, 31 Our data indicated that WGA was the most error-prone step in performing single CTC sequencing and that ADO was the most common reason for sequencing failure. However, we also demonstrated that these limitations could be overcome if at least 10 individual CTCs are sequenced. Furthermore, we found a similar cutoff of at least 20 cells for accurately assessing KRAS allelic fractions in a PC cell line with a known mutant allele amplification. Overall, our study provides further evidence that the amplification bias present at the single-cell level responsible for ADO can be reduced if at least 10 CTCs are sequenced together.
Conclusions
We demonstrated the mutation detection rate of the NanoVelcro/LCM platform for KRAS sequencing of single CTCs. We investigated the shortcomings inherent in work at the single-cell level and analyzed ways to account for and minimize sources of error. Finally, we established a cutoff of at least 10 CTCs as a lower limit for reliable KRAS mutational analysis from CTCs. Future studies looking at other actionable genetic targets, as well as other molecular analyses such as gene panels, exome sequencing, and RNASeq, will need to take into account the sources of error that we have highlighted in our study. We are hopeful that future studies will further confirm the ability of CTCs to function as a liquid biopsy, an important step in advancing precision cancer treatment.
Acknowledgments
We thank all of the patients for their participation in this study and the UCLA Agi Hirshberg Center for Pancreatic Diseases for its support and assistance.
Footnotes
Supported by a UCLA Jonsson Comprehensive Cancer Center Impact grant (J.S.T.), a NantOmics Research grant (J.S.T.), and the NIH, including grants R33 CA174562 (H.-R.T.), U01 CA198900 (H.-R.T.), and R44 CA180482 (H.-R.T.).
C.M.C. and J.S.A. contributed equally to this work as first authors.
Disclosures: The intellectual property that is associated with this study has been licensed to CytoLumina Technologies Corp. H.-R.T. is a cofounder of and has financial interests in CytoLumina Technologies Corp. NantOmics provided funding support only. Authors had access to all data and had full control of data analysis.
Supplemental material for this article can be found at http://dx.doi.org/10.1016/j.jmoldx.2016.03.006.
Supplemental Data
Using digital PCR to confirm allelic ratio for KRAS G12D mutations for the HPAF-II cell line. A: The figure is the graphical output of the fluorescent intensities of the individual wells analyzed using the QuantStudio AnalysisSuite software. The blue FAM dye correlates with the mutant allele probe (G12D), and the red VIC dye correlates with the wild-type probe. B: The bar graphs are interpreted from the figure above and is the ratio of mutant signal to the total signal. It demonstrates the expected 75:25 mutant (G12D):wild-type ratio for the HPAF-II cell line from different batches of cells at different dilutions.
References
- 1.Mendelsohn J. Personalizing oncology: perspectives and prospects. J Clin Oncol. 2013;31:1904–1911. doi: 10.1200/JCO.2012.45.3605. [DOI] [PubMed] [Google Scholar]
- 2.LeBlanc J.K., Ciaccia D., Al-Assi M.T., McGrath K., Imperiale T., Tao L.C., Vallery S., DeWitt J., Sherman S., Collins E. Optimal number of EUS-guided fine needle passes needed to obtain a correct diagnosis. Gastrointest Endosc. 2004;59:475–481. doi: 10.1016/s0016-5107(03)02863-3. [DOI] [PubMed] [Google Scholar]
- 3.Alix-Panabieres C., Pantel K. Challenges in circulating tumour cell research. Nat Rev Cancer. 2014;14:623–631. doi: 10.1038/nrc3820. [DOI] [PubMed] [Google Scholar]
- 4.Gold B., Cankovic M., Furtado L.V., Meier F., Gocke C.D. Do circulating tumor cells, exosomes, and circulating tumor nucleic acids have clinical utility? A report of the association for molecular pathology. J Mol Diagn. 2015;17:209–224. doi: 10.1016/j.jmoldx.2015.02.001. [DOI] [PMC free article] [PubMed] [Google Scholar]
- 5.Allard W.J., Matera J., Miller M.C., Repollet M., Connelly M.C., Rao C., Tibbe A.G., Uhr J.W., Terstappen L.W. Tumor cells circulate in the peripheral blood of all major carcinomas but not in healthy subjects or patients with nonmalignant diseases. Clin Cancer Res. 2004;10:6897–6904. doi: 10.1158/1078-0432.CCR-04-0378. [DOI] [PubMed] [Google Scholar]
- 6.Court C.M., Ankeny J.S., Hou S., Tseng H.R., Tomlinson J.S. Improving pancreatic cancer diagnosis using circulating tumor cells: prospects for staging and single-cell analysis. Expert Rev Mol Diagn. 2015;15:1491–1504. doi: 10.1586/14737159.2015.1091311. [DOI] [PMC free article] [PubMed] [Google Scholar]
- 7.Navin N.E. The first five years of single-cell cancer genomics and beyond. Genome Res. 2015;25:1499–1507. doi: 10.1101/gr.191098.115. [DOI] [PMC free article] [PubMed] [Google Scholar]
- 8.de Bourcy C.F., De Vlaminck I., Kanbar J.N., Wang J., Gawad C., Quake S.R. A quantitative comparison of single-cell whole genome amplification methods. PLoS One. 2014;9:e105585. doi: 10.1371/journal.pone.0105585. [DOI] [PMC free article] [PubMed] [Google Scholar]
- 9.Gawad C., Koh W., Quake S.R. Single-cell genome sequencing: current state of the science. Nat Rev Genet. 2016;17:175–188. doi: 10.1038/nrg.2015.16. [DOI] [PubMed] [Google Scholar]
- 10.Almoguera C., Shibata D., Forrester K., Martin J., Arnheim N., Perucho M. Most human carcinomas of the exocrine pancreas contain mutant c-K-ras genes. Cell. 1988;53:549–554. doi: 10.1016/0092-8674(88)90571-5. [DOI] [PubMed] [Google Scholar]
- 11.Bryant K.L., Mancias J.D., Kimmelman A.C., Der C.J. KRAS: feeding pancreatic cancer proliferation. Trends Biochem Sci. 2014;39:91–100. doi: 10.1016/j.tibs.2013.12.004. [DOI] [PMC free article] [PubMed] [Google Scholar]
- 12.Girgis M.D., Olafsen T., Kenanova V., McCabe K.E., Wu A.M., Tomlinson J.S. Targeting CEA in pancreas cancer xenografts with a mutated scFv-Fc antibody fragment. EJNMMI Res. 2011;1:24. doi: 10.1186/2191-219X-1-24. [DOI] [PMC free article] [PubMed] [Google Scholar]
- 13.Lin M., Chen J.F., Lu Y.T., Zhang Y., Song J., Hou S., Ke Z., Tseng H.R. Nanostructure embedded microchips for detection, isolation, and characterization of circulating tumor cells. Acc Chem Res. 2014;47:2941–2950. doi: 10.1021/ar5001617. [DOI] [PMC free article] [PubMed] [Google Scholar]
- 14.Zhao L., Lu Y.T., Li F., Wu K., Hou S., Yu J., Shen Q., Wu D., Song M., OuYang W.H., Luo Z., Lee T., Fang X., Shao C., Xu X., Garcia M.A., Chung L.W., Rettig M., Tseng H.R., Posadas E.M. High-purity prostate circulating tumor cell isolation by a polymer nanofiber-embedded microchip for whole exome sequencing. Adv Mater. 2013;25:2897–2902. doi: 10.1002/adma.201205237. [DOI] [PMC free article] [PubMed] [Google Scholar]
- 15.Ankeny J.S., Court C.M., Hou S., Li Q., Song M., Wu D., Chen J.F., Lee T., Lin M., Sho S., Rochefort M.M., Girgis M.D., Yao J., Wainberg Z.A., Muthusamy V.R., Watson R.R., Donahue T.R., Hines O.J., Reber H.A., Graeber T.G., Tseng H.R., Tomlinson J.S. Circulating tumour cells as a biomarker for diagnosis and staging in pancreatic cancer. Br J Cancer. 2016;114:1367–1375. doi: 10.1038/bjc.2016.121. [DOI] [PMC free article] [PubMed] [Google Scholar]
- 16.Huggett J.F., Foy C.A., Benes V., Emslie K., Garson J.A., Haynes R., Hellemans J., Kubista M., Mueller R.D., Nolan T., Pfaffl M.W., Shipley G.L., Vandesompele J., Wittwer C.T., Bustin S.A. The digital MIQE guidelines: minimum Information for Publication of Quantitative Digital PCR Experiments. Clin Chem. 2013;59:892–902. doi: 10.1373/clinchem.2013.206375. [DOI] [PubMed] [Google Scholar]
- 17.Hamidi H., Lu M., Chau K., Anderson L., Fejzo M., Ginther C., Linnartz R., Zubel A., Slamon D.J., Finn R.S. KRAS mutational subtype and copy number predict in vitro response of human pancreatic cancer cell lines to MEK inhibition. Br J Cancer. 2014;111:1788–1801. doi: 10.1038/bjc.2014.475. [DOI] [PMC free article] [PubMed] [Google Scholar]
- 18.Rehm H.L., Bale S.J., Bayrak-Toydemir P., Berg J.S., Brown K.K., Deignan J.L., Friez M.J., Funke B.H., Hegde M.R., Lyon E., Working Group of the American College of Medical Genetics and Genomics Laboratory Quality Assurance Committee ACMG clinical laboratory standards for next-generation sequencing. Genet Med. 2013;15:733–747. doi: 10.1038/gim.2013.92. [DOI] [PMC free article] [PubMed] [Google Scholar]
- 19.Ballantyne K.N., van Oorschot R.A., Muharam I., van Daal A., John Mitchell R. Decreasing amplification bias associated with multiple displacement amplification and short tandem repeat genotyping. Anal Biochem. 2007;368:222–229. doi: 10.1016/j.ab.2007.05.017. [DOI] [PubMed] [Google Scholar]
- 20.Van Loo P., Voet T. Single cell analysis of cancer genomes. Curr Opin Genet Dev. 2014;24:82–91. doi: 10.1016/j.gde.2013.12.004. [DOI] [PubMed] [Google Scholar]
- 21.Tsiatis A.C., Norris-Kirby A., Rich R.G., Hafez M.J., Gocke C.D., Eshleman J.R., Murphy K.M. Comparison of Sanger sequencing, pyrosequencing, and melting curve analysis for the detection of KRAS mutations: diagnostic and clinical implications. J Mol Diagn. 2010;12:425–432. doi: 10.2353/jmoldx.2010.090188. [DOI] [PMC free article] [PubMed] [Google Scholar]
- 22.Soh J., Okumura N., Lockwood W.W., Yamamoto H., Shigematsu H., Zhang W., Chari R., Shames D.S., Tang X., MacAulay C., Varella-Garcia M., Vooder T., Wistuba I.I., Lam S., Brekken R., Toyooka S., Minna J.D., Lam W.L., Gazdar A.F. Oncogene mutations, copy number gains and mutant allele specific imbalance (MASI) frequently occur together in tumor cells. PLoS One. 2009;4:e7464. doi: 10.1371/journal.pone.0007464. [DOI] [PMC free article] [PubMed] [Google Scholar]
- 23.Aoki Y., Hosaka S., Tachibana N., Karasawa Y., Kawa S., Kiyosawa K. Reassessment of K-ras mutations at codon 12 by direct PCR and sequencing from tissue microdissection in human pancreatic adenocarcinomas. Pancreas. 2000;21:152–157. doi: 10.1097/00006676-200008000-00008. [DOI] [PubMed] [Google Scholar]
- 24.Zong C., Lu S., Chapman A.R., Xie X.S. Genome-wide detection of single-nucleotide and copy-number variations of a single human cell. Science. 2012;338:1622–1626. doi: 10.1126/science.1229164. [DOI] [PMC free article] [PubMed] [Google Scholar]
- 25.Ni X., Zhuo M., Su Z., Duan J., Gao Y., Wang Z., Zong C., Bai H., Chapman A.R., Zhao J., Xu L., An T., Ma Q., Wang Y., Wu M., Sun Y., Wang S., Li Z., Yang X., Yong J., Su X.D., Lu Y., Bai F., Xie X.S., Wang J. Reproducible copy number variation patterns among single circulating tumor cells of lung cancer patients. Proc Natl Acad Sci U S A. 2013;110:21083–21088. doi: 10.1073/pnas.1320659110. [DOI] [PMC free article] [PubMed] [Google Scholar]
- 26.Yu Z., Lu S., Huang Y. Microfluidic whole genome amplification device for single cell sequencing. Anal Chem. 2014;86:9386–9390. doi: 10.1021/ac5032176. [DOI] [PubMed] [Google Scholar]
- 27.Chinen L.T., de Carvalho F.M., Rocha B.M., Aguiar C.M., Abdallah E.A., Campanha D., Mingues N.B., de Oliveira T.B., Maciel M.S., Cervantes G.M., Dettino A.L., Soares F.A., Paterlini-Brechot P., Fanelli M.F. Cytokeratin-based CTC counting unrelated to clinical follow up. J Thorac Dis. 2013;5:593–599. doi: 10.3978/j.issn.2072-1439.2013.09.18. [DOI] [PMC free article] [PubMed] [Google Scholar]
- 28.Lustberg M.B., Balasubramanian P., Miller B., Garcia-Villa A., Deighan C., Wu Y., Carothers S., Berger M., Ramaswamy B., Macrae E.R., Wesolowski R., Layman R.M., Mrozek E., Pan X., Summers T.A., Shapiro C.L., Chalmers J.J. Heterogeneous atypical cell populations are present in blood of metastatic breast cancer patients. Breast Cancer Res. 2014;16:R23. doi: 10.1186/bcr3622. [DOI] [PMC free article] [PubMed] [Google Scholar]
- 29.Heitzer E., Auer M., Gasch C., Pichler M., Ulz P., Hoffmann E.M., Lax S., Waldispuehl-Geigl J., Mauermann O., Lackner C., Hofler G., Eisner F., Sill H., Samonigg H., Pantel K., Riethdorf S., Bauernhofer T., Geigl J.B., Speicher M.R. Complex tumor genomes inferred from single circulating tumor cells by array-CGH and next-generation sequencing. Cancer Res. 2013;73:2965–2975. doi: 10.1158/0008-5472.CAN-12-4140. [DOI] [PubMed] [Google Scholar]
- 30.Lohr J.G., Adalsteinsson V.A., Cibulskis K., Choudhury A.D., Rosenberg M., Cruz-Gordillo P. Whole-exome sequencing of circulating tumor cells provides a window into metastatic prostate cancer. Nat Biotechnol. 2014;32:479–484. doi: 10.1038/nbt.2892. [DOI] [PMC free article] [PubMed] [Google Scholar]
- 31.Hou Y., Song L., Zhu P., Zhang B., Tao Y., Xu X. Single-cell exome sequencing and monoclonal evolution of a JAK2-negative myeloproliferative neoplasm. Cell. 2012;148:873–885. doi: 10.1016/j.cell.2012.02.028. [DOI] [PubMed] [Google Scholar]
Associated Data
This section collects any data citations, data availability statements, or supplementary materials included in this article.
Supplementary Materials
Using digital PCR to confirm allelic ratio for KRAS G12D mutations for the HPAF-II cell line. A: The figure is the graphical output of the fluorescent intensities of the individual wells analyzed using the QuantStudio AnalysisSuite software. The blue FAM dye correlates with the mutant allele probe (G12D), and the red VIC dye correlates with the wild-type probe. B: The bar graphs are interpreted from the figure above and is the ratio of mutant signal to the total signal. It demonstrates the expected 75:25 mutant (G12D):wild-type ratio for the HPAF-II cell line from different batches of cells at different dilutions.