

Abstract
Background
Despite increased awareness of the adverse health effects of vitamin D deficiency, only a few studies have evaluated the vitamin D status (25-hydroxyvitamin D [25(OHD)]) of breastfeeding women and up to now, no information exits for German breastfeeding women. Therefore, the aim of study was to determine the vitamin D status of breastfeeding women compared to non-pregnant and non-breastfeeding (NPNB) women.
Methods
This cross-sectional study investigated 124 breastfeeding women and 124 age and season matched NPNB women from the German “Vitamin and mineral status among German women” study. The study participants were recruited from April 2013 to March 2015 and did not take vitamin D supplements. Serum 25(OH)D was analyzed by chemiluminescent immunoassay.
Results
Vitamin D deficiency (<25.0 nmol/L) was prevalent in 26.6% of the breastfeeding women. The majority of women (49.2%) showed 25(OH)D concentration between 25.0 and 49.9 nmol/L. In multiple binary logistic regression analysis, breastfeeding women had a 4.0-fold higher odds ratio (OR) (95% confidence interval [CI] 1.8, 8.7) for vitamin D deficiency than NPNB women. For breastfeeding women, the risk of vitamin D deficiency was higher in the winter and spring months (OR: 2.6, 95% CI 1.1, 6.3) and increased with lower longitude per one unit (OR 0.7, 95% CI 0.6, 0.9).
Conclusion
Breastfeeding women in Germany had a higher risk of deficient vitamin D levels than NPNB women. In further studies, the optimal vitamin D status for breastfeeding women should be investigated and also the required vitamin D doses to ensure this vitamin D status.
Trial registration
German Clinical Trial Register (identification number: DRKS00004789).
Keywords: Vitamin D, 25(OH)D, Breastfeeding period, Germany
Background
Vitamin D deficiency is common in Europe [1]. In Germany, an estimated 56.1% of non-breastfeeding women have insufficient vitamin D status (<50 nmol/L) with a higher prevalence in winter [2]. The vitamin D requirement can be ensured by endogenous synthesis in the skin via ultraviolet B (UVB) radiation and therefore depends on numerous factors that affect the synthesis rate [3]. Vitamin D is widely recognized as a factor that not only affects calcium and bone metabolism [4] but may also be protect against some diseases such as musculoskeletal health problems, various autoimmune disorders, cardiovascular disease and cancer [5].
Breastfeeding represents a critical period in regards to vitamin D status in the lifecycle of a woman. A total of 49.0% of German pregnant women in the summer and 98.0% of pregnant women in the winter show inadequate vitamin D status after the birth of a child [6], indicating that the breastfeeding period often starts with a maternal vitamin D deficit. Moreover, the maternal vitamin D status affects not only her own health but also that of her breastfed infant [7]. Data suggest that the 25-hydroxyvitamin D (25(OH)D) content of breast milk correlates with maternal 25(OH)D status [8]. Therefore, the transfer of vitamin D through breast milk might have a negative impact on the maternal vitamin D status. In addition, there will also be negative consequences for the infant, as the transfer of vitamin D through milk may not be sufficient to satisfy infant nutritional requirements if the breastfeeding woman is vitamin D deficient [7]. Inadequate vitamin D status should be avoided to prevent rickets [9] and other diseases such as respiratory infections [10] and heart failure [11] in infants. In addition, rickets increases the risk of type 1 diabetes [12]. Nevertheless, in Germany, the recommended vitamin D intake of 800 international units (IU)/day during the breastfeeding period is the same as that for non-breastfeeding women [13]. Moreover, the content of the mother’s milk is insufficient to ensure the vitamin D requirement of the infant [8]. Irrespective of whether the infant is breastfed, the estimated value of vitamin D intake for infants up to one year of age is 400 IU/day in Germany [13]. Recent findings show that maternal vitamin D supplementation of 6400 IU/day during the breastfeeding period, rather than vitamin D supplementation for the infant, is effective to ensure the requirement of the infant [14].
Vitamin D levels in healthy adults have been reported in several studies [1, 2, 15]. However, only a few studies have evaluated vitamin D status in breastfeeding women [16–22]. Moreover, until now, information regarding vitamin D status in breastfeeding women has not been available in Germany.
This study addresses this gap in knowledge by examination of vitamin D status in breastfeeding women in comparison with a group of age and season matched women who were not pregnant and did not breastfeed (NPNB) in a nationwide, cross-sectional multicenter study. In addition, factors associated with vitamin D status among breastfeeding women were examined.
Methods
Study design and participants
This study sample was obtained from the nationwide, cross-sectional, multicenter VitaMinFemin study (Vitamin and mineral status among German women), which analyzed the status of selected nutrients in women at different stages of life (n = 2367).
Study participants were recruited from April 2013 (first participant in) to March 2015 (last participant in) in cooperation with 125 study sites (latitude 47.6°N to 54.2°N, longitude 6.3°E to 13.9°E). Details of the study design and implementation have been previously described [23].
Of the 2367 women recruited at different stages of life, 124 women met the inclusion criteria (breastfeeding women) and did not fulfill any exclusion criteria (Fig. 1). The cross-sectional analysis in breastfeeding women was performed at different time points postpartum (between two weeks and nine months postpartum) and corresponded to the respective time since the beginning of the breastfeeding period in all participants. A comparison group of NPNB women (n = 124) was also selected from the VitaMinFemin study and matched by age and season of blood sampling. No one in either group supplemented with vitamin D.
Fig. 1.
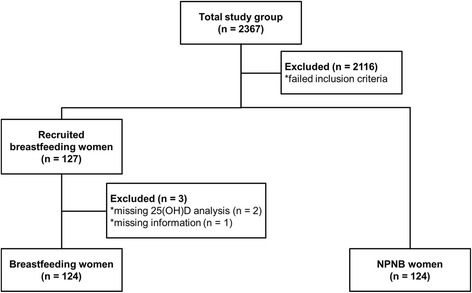
Recruitment of study participants. 25(OH)D, 25-hydroxyvitamin D; NPNB, non-pregnant and non-breastfeeding
Data collection
Data collection included questionnaire and blood sample which were conducted on the same day. Using a questionnaire, age, anthropometric variables (height and weight), skin type (light/dark), holidays within the six weeks before data collection (yes/no) in countries south of Germany where the sunshine is sufficient to produce endogenous vitamin D, smoking status (yes/no) and time since the beginning of breastfeeding period were included. Serum 25(OH)D levels were measured at the LADR laboratory, Germany.
25(OH)D measurement
Vitamin D status was measured once per participant in serum 25(OH)D, which is considered to be the best indicator and reflects both vitamin D intake and endogenous vitamin D synthesis [24]. Chemiluminescence immunoassay (LIASION® TOTAL Assay, DiaSorin Inc., Stillwater, MN, USA) was used for 25(OH)D analysis. The lower and higher detection limits of the analysis were 10 and 375 nmol/L without dilution, respectively. Quality was ensured in accordance with DIN ISO 15189.
Cutoff values for 25(OH)D
Subgroups were categorized based on their 25(OH)D concentration. In the general population, as well as in the breastfeeding woman, no current recommendations exist regarding optimal serum 25(OH)D levels [5, 7, 24, 25]. Therefore, we used a common classification scheme to determine vitamin D status, as utilized by Richter et al. [15] and described as follows: (1) severe deficiency (<15.0 nmol/L) as used previously [26]; (2) moderate deficiency (15.0-24.9 nmol/L, corresponding to a deficit threshold of <25.0 nmol/L) [27], which is associated with osteomalacia, severe hyperparathyroidism [27], myopathy and rickets in breastfeeding infants [28]; (3) insufficiency (25.0–49.9 nmol/L) [27], which leads to impaired muscle function, reduced bone mineral density and elevated parathyroid hormone (PTH) levels [27]; (4) sufficiency (50.0–74.9 nmol/L) [27] with low vitamin D stores and slightly increased PTH levels [27] and (5) optimal vitamin D status (75.0–124.9 nmol/L, corresponding to an optimal threshold of >75.0 nmol/L) [29] where vitamin D dependent functions are not impaired [27] and the mortality risk in colorectal or breast cancer is reduced [30]. Additionally, we considered (6) ≥125.0 nmol/L to be the threshold at which there is a risk of vitamin D excess [24], as the morality risk is increased above this level [31].
Influencing factors of serum 25(OH) D values
The 25(OH)D value of breastfeeding women was assessed relative to that of NPNB women. As several factors have been found to be related to 25(OH)D levels [2, 15, 32], the 25(OH)D status was also evaluated with the inclusion of the following potential confounding variables: (a) “season at the time of blood collection” with the classification of participants in spring (March to May), summer (June to August), autumn (September to November) and winter (December to February); (b) “region” (i.e., latitude and longitude where people were recruited); (c) recent “holidays” in the last six weeks before blood sampling; (d) “skin type” (light/dark) using a modified schema of the pigmentation classification by Fitzpatrick [33]; (e) “age”; (f) “body mass index” (BMI); (g) “smoking” and (h) “duration of breastfeeding” to analyze whether the duration of breastfeeding had an effect on the vitamin D status.
Statistical analysis
Statistical package for social science (SPSS) software version 22.0 (SPSS, Inc. Chicago, Illinois, USA) was used for statistical analyses. Continuous variables are presented as mean ± standard deviation (SD) and range (minimum, maximum) and categorical variables as number of participants (n) and percentage (%). Significant differences between breastfeeding women and NPNB women were analyzed using nonparametric Mann-Whitney U-test due to the skewed distribution of the data and differences between categorical variables were analyzed using Chi-square test. Spearman’s rank correlation was used to test correlations between variables with skewed distributions and p values ≤0.05 were considered significant. Univariate and multivariate binary logistic regressions were performed to assess potential associations between variables and the odds ratio (OR) of vitamin D deficiency. A threshold 25.0 nmol/L was used to define vitamin D deficiency (<25.0 nmol/L) and non-deficiency (≥25.0 nmol/L). The potential determinants season, skin type, recent holiday and smoking were included in the model as categorical variables. Reference categories were defined as those with the lowest assumed prevalence rate of vitamin D deficiency. The ORs for region (latitude and longitude), age, BMI and duration of breastfeeding were evaluated to determine the increase in the odds of vitamin D deficiency per increase in variable unit. The multivariate binary logistic regression included only determinants with p values <0.05 in the univariate binary logistic regressions.
Results
Baseline characteristics
Table 1 presents the characteristics of the study sample for breastfeeding women and NPNB women separately. Age, body height, body weight, BMI and prevalence of season of blood sampling, skin type and recent holidays did not differ between breastfeeding women and NPNB women. The prevalence of smoking was higher in NPNB women (24.2%) than in breastfeeding women (8.9%, p = 0.001). A total of 24.6% of the study sample were overweight (BMI 25–29.9 kg/m2) and 12.5% were obese (BMI ≥30.0 kg/m2). The percentage of overweight and obese did not differ between breastfeeding women and NPNB women (p = 0.093), data not shown.
Table 1.
Characteristics of study sample
| Breastfeeding women (n = 124) | NPNB women (n = 124) | P value | ||
|---|---|---|---|---|
| Age (years) | Mean ± SD | 31.9 ± 5.0 | 31.8 ± 5.3 | 0.784‡ |
| Range | 20.0 − 44.0 | 19.0 − 45.0 | ||
| Height (m) | Mean ± SD | 1.68 ± 0.07 | 1.67 ± 0.07 | 0.663‡ |
| Range | 1.52 − 1.86 | 1.52 − 1.82 | ||
| Weight (kg) | Mean ± SD | 71.2 ± 14.5 | 68.4 ± 14.9 | 0.064‡ |
| Range | 48.0 − 142.0 | 43.0 − 120.0 | ||
| BMI (kg/m2) | Mean ± SD | 25.1 ± 4.8 | 24.3 ± 5.0 | 0.053‡ |
| Range | 18.2 − 46.4 | 17.0 − 40.8 | ||
| Season of blood sampling | ||||
| Spring | N (%) | 22 (17.7) | 22 (17.7) | 1.000* |
| Summer | 14 (11.3) | 14 (11.3) | ||
| Autumn | 63 (50.8) | 63 (50.8) | ||
| Winter | 25 (20.2) | 25 (20.2) | ||
| Skin type | ||||
| Light | N (%) | 109 (87.9) | 112 (90.3) | 0.292* |
| Dark | 15 (12.1) | 10 (8.1) | ||
| Recent holidays | N (%) | 5 (4.0) | 6 (4.8) | 0.758* |
| Smoking | N (%) | 11 (8.9) | 30 (24.2) | 0.001* |
| Duration of breastfeeding (month)a | Mean ± SD | 3.5 ± 3.2 | / | / |
| Range | 0.5 − 18.0 | |||
Autumn, September – November; BMI, body mass index; NPNB, non-pregnant and non-breastfeeding; SD, standard deviation; Spring, March – May; Summer, June – August; Winter, December – February
‡Mann-Whitney U-test
*Chi-square test
a n = 123
Vitamin D status
In breastfeeding women, the mean 25(OH)D concentration (37.7 ± 19.1 nmol/L) was significantly lower than in NPNB women (47.3 ± 20.0 nmol/L, p <0.001) (Fig. 2). Serum 25(OH)D varied significantly by season for both breastfeeding and NPNB women. Breastfeeding women had the highest 25(OH)D levels in summer (45.9 ± 26.0 nmol/L) and autumn (43.2 ± 19.1 nmol/L) and the lowest 25(OH)D levels in winter (28.3 ± 13.0 nmol/L) and spring (27.3 ± 9.9 nmol/L; p <0.001).
Fig. 2.
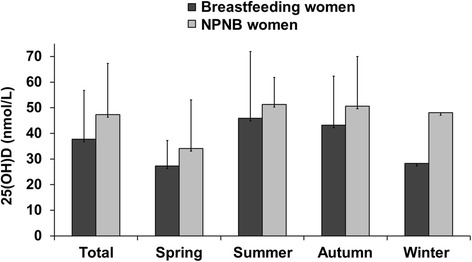
25-hydroxyvitamin D concentration in breastfeeding women compared to NPNB women. Bars indicate mean ± standard deviation; Breastfeeding vs. non-breastfeeding women in total study sample: p <0.001‡; Between season in breastfeeding women: p < 0.001†; Between season in NPNB women: p = 0.002†; Breastfeeding vs. NPNB women in spring: p = 0.391‡, summer: p = 0.352‡, autumn: p = 0.026‡, winter: p = 0.001‡; Autumn, September – November; NPNB, non-pregnant and non-breastfeeding; Spring, March – May; Summer, June – August; Winter, December – February; ‡Mann-Whitney U-test, †Kruskal-Wallis-test
In autumn and winter, levels of 25(OH)D were significantly lower in breastfeeding women (43.2 ± 19.1 nmol/L; 28.3 ± 13.0 nmol/L) than in NPNB women (50.6 ± 19.4 nmol/L, p = 0.026; 48.1 ± 22.4 nmol/L, p = 0.001). In the spring and summer, there were no differences in 25(OH)D concentration between breastfeeding women and NPNB women (spring: p = 0.391, summer: p = 0.352).
The 25(OH)D level was not significantly associated with any of the possible factors in breastfeeding women (latitude of residence, skin type, age, BMI, month of breastfeeding and smoking), data not shown. However, 25(OH)D concentrations in breastfeeding women had a weak positive association with longitude of residence (r s = 0.263, p = 0.003).
Prevalence of 25(OH)D categories between breastfeeding and NPNB women
Frequencies of 25(OH)D levels in the previously defined target ranges are shown in Fig. 3. The prevalence of vitamin D deficiency (<25.0 nmol/L) and insufficiency (<50.0 nmol/L) was significantly higher in breastfeeding women (26.6% and 75.8%, respectively) than in NPNB women (12.9%, p = 0.007 and 58.9%, p = 0.004, respectively). In contrast, only 5.6% of the breastfeeding women and 9.7% of the NPNB women had optimal 25(OH)D levels (75.0–124.9 nmol/L). No participant had a risk of vitamin D excess (≥125.0 nmol/L).
Fig. 3.
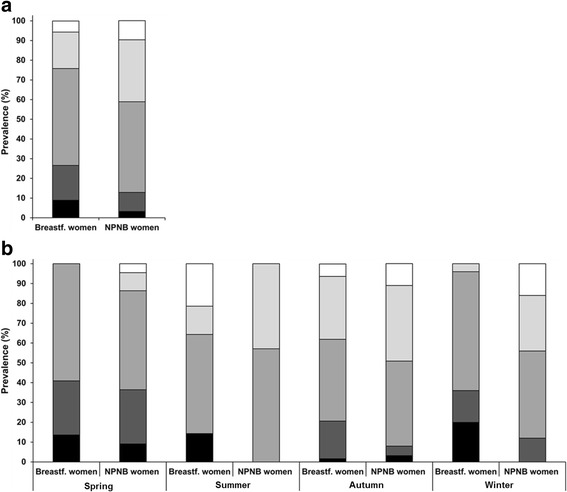
Prevalence of vitamin D status by (a) stage of life and (b) season. Classification of vitamin D status (25(OH)D concentration) according to  severe deficiency (<15.0 nmol/L),
  moderate deficiency (15.0–24.9 nmol/L),
  insufficiency (25.0–49.9 nmol/L),
  sufficiency (50.0–74.9 nmol/L) and
 optimal (75.0–124.9 nmol/L); Risk of excess (≥124.9 nmol/L) was not prevalent; (a) Breastfeeding women vs. NPNB women: p = 0.019*; (b) Between season in breastfeeding women: p <0.001*; Between season in NPNB women: p = 0.032*; Breastfeeding women vs. NPNB women in spring: p = 0.498*, summer: p = 0.070*, autumn: p = 0.139*, winter: p = 0.007*; 25(OH)D, 25-hydroxyvitamin D; Autumn, September – November; NPNB, non-pregnant and non-breastfeeding; Spring, March – May; Summer, June – August; Winter, December – February; *Chi-square test
The frequencies of the 25(OH)D categories depended on the season of blood sampling in both groups. In breastfeeding women, the proportion having optimal vitamin D levels (75.0–124.9 nmol/L) was the highest in summer, whereas in winter, none of the breastfeeding women had optimal 25(OH)D concentrations. In spring, every women had 25(OH)D levels below the sufficient value (<50.0 nmol/L).
Breastfeeding women had a significantly higher prevalence of vitamin D deficiency (<25.0 nmol/L) in autumn and winter and a lower prevalence of optimal vitamin D levels (75.0–124.9 nmol/L) in winter than NPNB women.
Risk factors for vitamin D deficiency
In breastfeeding women, the risk for vitamin D deficiency was significantly positively associated with the winter and spring months, lower longitude of place of residence and higher BMI in the univariate binary logistic regression (Table 2). In contrast, no significant association was found between latitude, skin type, recent holidays, smoking, age, duration of breastfeeding and vitamin D deficiency.
Table 2.
Univariate odds ratios for vitamin D deficiency (<25.0 nmol/L) in breastfeeding women
| Determinants | N | Persons at risk (% of category) | P value | Odds ratios | 95% CI | P value |
|---|---|---|---|---|---|---|
| Season | ||||||
| Summer and Autumn | 77 | 15 (19.5) | 0.021* | 1.0 | Ref. | |
| Winter and Spring | 47 | 18 (38.3) | 2.6 | 1.1, 5.8 | 0.023 | |
| Regiona | ||||||
| Latitude | / | / | / | 1.1 | 0.9, 1.3 | 0.378 |
| Longitude | / | / | / | 0.7 | 0.6, 0.9 | 0.006 |
| Skin type | ||||||
| Light | 109 | 29 (26.6) | 0.996* | 1.0 | Ref. | |
| Dark | 15 | 4 (26.7) | 1.0 | 0.3, 3.4 | 0.996 | |
| Recent holidays | ||||||
| Yes | 5 | 1 (20.0) | 0.733* | 1.0 | Ref. | |
| No | 119 | 32 (26.9) | 0.7 | 0.2, 13.7 | 0.734 | |
| Smoking | ||||||
| No | 113 | 30 (26.5) | 0.959* | 1.0 | Ref. | |
| Yes | 11 | 3 (27.3) | 1.0 | 0.3, 4.2 | 0.959 | |
| Agea | / | / | / | 0.9 | 0.9, 1.0 | 0.163 |
| BMIa | / | / | / | 1.1 | 1.0, 1.2 | 0.045 |
| Duration of breastfeeding (month)b | / | / | / | 1.0 | 1.0, 1.0 | 0.703 |
| Stage of life | ||||||
| Breastfeeding women | 124 | 16 (12.9) | 0.007* | 1.0 | Ref. | |
| NPNB women | 124 | 33 (26.6) | 2.5 | 1.3, 4.7 | 0.008 | |
25(OH)D, 25-hydroxyvitamin D; Autumn, September – November; BMI, body mass index; CI, confidence interval; NPNB, non-pregnant and non- breastfeeding; Ref., reference category with the lowest assumed prevalence of vitamin D deficiency; Spring, March – May; Summer, June – August; Winter, December – February
*Chi-square test for prevalence differences of 25(OH)D concentrations below 25 nmol/L
aOdds ratio for an increase per one unit
b n = 123
The determinants of vitamin D deficiency (<25.0 nmol/L) by multiple binary logistic regression analysis are shown in Table 3. Breastfeeding woman had a 4.0-fold greater odds ratio of vitamin D deficiency than NPNB women (p = 0.001). In breastfeeding women, the odds increased significantly in the winter and spring months (OR = 2.6; p = 0.029) compared to the summer and autumn months. Longitude was an important determinant of serum 25(OH)D; the OR for vitamin D deficiency lies at 0.7 for each increase in longitude unit (p = 0.004).
Table 3.
Multivariable adjusted odds ratios for vitamin D deficiency (<25.0 nmol/L) in breastfeeding women
| Determinants | N | Persons at risk (% of category) | P value | Odds ratios | 95% CI | P value |
|---|---|---|---|---|---|---|
| Seasona | ||||||
| Summer and Autumn | 77 | 15 (19.5) | 0.021* | 1.0 | Ref. | |
| Winter and Spring | 47 | 18 (38.3) | 2.6 | 1.1, 6.3 | 0.029 | |
| Regionb,c | ||||||
| Longitude | / | / | / | 0.7 | 0.6, 0.9 | 0.004 |
| BMIc,d | / | / | / | 1.1 | 1.0, 1.2 | 0.060 |
| Stage of lifee | ||||||
| Breastfeeding women | 124 | 16 (12.9) | 0.007* | 1.0 | Ref. | |
| NPNB women | 124 | 33 (26.6) | 4.0 | 1.8, 8.7 | 0.001 | |
25(OH)D, 25-hydroxyvitamin D; Autumn, September - November; BMI, body mass index; CI, confidence interval; NPNB, non-pregnant, non-breastfeeding; Ref., reference category with the lowest assumed prevalence of vitamin D deficiency; Spring, March – May; Summer, June – August; Winter, December – February
*Chi-square test for prevalence differences of 25(OH)D concentrations below 25 nmol/L
aMultiple binary regressions considering the terms region (longitude) and BMI
bMultiple binary regressions considering the terms season and BMI
cOdds ratio for an increase per one unit
dMultiple binary regressions considering the terms season and region (longitude)
eMultiple binary regressions considering the terms season, region (longitude) and BMI
Discussion
To our knowledge, these are the first data describing vitamin D status in German breastfeeding women. Three main findings emerged, as follows: (I) 25(OH)D levels were significantly lower in breastfeeding women than in NPNB women; (II) the prevalence of vitamin D deficiency (<25.0 nmol/L) and insufficiency (<50.0 nmol/L) was significantly higher in breastfeeding women compared to NPNB women; and (III) season and longitude influenced the odds of vitamin D deficiency in breastfeeding women.
Vitamin D status in breastfeeding women compared to NPNB women
A total of 75.8% of breastfeeding women showed insufficient vitamin D status (25(OH)D < 50 nmol/L), while only 5.6% showed optimal vitamin D status (75.0–124.9 nmol/L). It should be noted that the evaluation of vitamin D status depends on the threshold used, and there is only a consensus that 25(OH)D concentrations below 50.0 nmol/L should be avoided [24, 25, 27]. It is estimated that the requirements of 97.5% of the population are adequately covered at 25(OH)D concentrations of at least 50 nmol/L [24]. However the Endocrine Society and other academic experts on vitamin D recommend 25(OH)D concentrations of at least 75.0 nmol/L [5, 25, 27]. Moreover, the vitamin D status may be higher than detected, as we used the DiaSorin Liaison chemiluminescence immunoassay, similar to most previous epidemiological studies [2, 6, 15, 21, 22]. It is known that this method underestimates vitamin D status compared to liquid chromatography tandem mass spectrometry (LC-MS/MS) [34], which has been suggested to be one of the most accurate methods [35].
The vitamin D status was also insufficient (<50 nmol/L) in 58.8% of NPNB women, and this result is comparable with the findings of previous studies of adults in Germany [2, 15, 36]. Food contains only limited amounts of vitamin D [37], which may explain the high proportion of women with vitamin D insufficiency in both groups. On average, German women have a dietary intake of 80–104 IU vitamin D per day [38]. This intake is considerably lower than the recommended daily intake of 800 IU vitamin D per day to ensure 25(OH)D concentrations above 50.0 nmol/L in the case of absent endogenous synthesis [13]. In addition, endogenous vitamin D synthesis via ultraviolet radiation may have been inadequate to fulfill the vitamin D demand for both groups in our study sample. Moreover, none of the women in our study took vitamin D supplements. In the general population of Germany, 32.1% of women use vitamin D supplements; however, the resulting intake is only 156 IU/day on average [39].
Nevertheless, breastfeeding women showed a poorer vitamin D status than NPNB women, with a 4.0 odds of vitamin D deficiency (<25.0 nmol/L) when controlling for potential confounding variables and considering influencing factors.
Recent studies of breastfeeding women in other countries have also shown a high prevalence of inadequate vitamin D status [18, 20, 21]; however, the prevalence was often lower than those rates found in our study [17, 22]. For example, in Sweden, the prevalence of 25(OH)D concentrations < 50 nmol/L in women, who were breastfeeding for 12 months, was 22% in the winter months (November to April) and 15% in the summer months [17]. In a global study of China, the USA and Mexico, 43% of breastfeeding women at 4 weeks postpartum showed vitamin D insufficiency (<50.0 nmol/L) [22]. In contrast to our non-supplementation study sample, in both previous studies, 18% [17] and 22–94% [22] of the women were supplemented with vitamin D. However, in the study sample described by Seth et al., none of the participants supplemented vitamin D, and 93.8% had vitamin D insufficiency [21].
One possible explanation for the lower vitamin D status in breastfeeding women could be the loss of vitamin D via breast milk [32]. In our study, the 25(OH)D level was independent of the duration of breastfeeding, and inconsistent results have been reported in previous studies [17, 32, 40]. The duration of breastfeeding may impact vitamin D status in circumstances of an extended breastfeeding duration (>9 months) [40] and in combination with exclusive breastfeeding [32]. However, we were unable to conclusively and precisely assess the influence of breastfeeding, as the frequency and daily amount of breastfeeding were not evaluated.
Another reason for the lower vitamin D status of breastfeeding women could be that inadequate maternal vitamin D status already existed during pregnancy. A total of 77% of German women showed 25(OH)D concentrations below 50.0 nmol/L after the birth of their child [6]. Jones et al. found a decline of plasma 25(OH)D3 from the 30th gestational week in pregnant women to the 12th week postpartum in breastfeeding women, and these results support a lower 25(OH)D3 concentration in breastfeeding women than in NPNB women [41].
Moreover, the lower vitamin D status in breastfeeding women may also result from a statistical trend to a higher body weight and BMI among these women. A higher BMI is associated with a higher risk of vitamin D deficiency in the general population [15]. However, the risk of vitamin D deficiency for breastfeeding women was also higher than that for NPNB women in a multivariate adjusted model that included BMI.
Determinants of vitamin D status in breastfeeding women
In our study, breastfeeding women had similar seasonal variations in the vitamin D status as did NPNB women. However, even between April and September, when exposure may still be sufficient for vitamin D synthesis in northern latitudes [42], this study indicates that 62.3% of breastfeeding women had 25(OH)D concentrations below the sufficient level (<50.0 nmol/L).
Vitamin D synthesis may be dependent upon geography [43]. However, the prevalence of vitamin D deficiency (<25.0 nmol/L) was not associated with latitude in this study, which is in contrast to a previous German study of adults [2] and the fact that the availability of UVB radiation decreases with higher latitude [44]. Interestingly, longitude of residence showed an influence on the vitamin D status. Breastfeeding women who live in lower longitudes of Germany had a higher risk of vitamin D deficiency than breastfeeding women who live in higher longitudes of Germany. This association corresponds to the sunshine duration in Germany, which is associated with longitude instead of latitude. In East Germany (higher longitude) sunshine duration is longer than in West Germany (lower longitude), based on own calculations from the German Meteorological Services data of sunshine duration [45].
In studies of NPNB women, the prevalence of vitamin D deficiency (<25.0 nmol/L) was been found to be significantly lower in those who were non-smokers [46], had lower BMI [46] and had recently traveled to sunny areas [15]. Additionally, lower age [15] and light skin type [47] have been previously found to be associated with higher 25(OH)D concentrations. However, none of these factors were associated with the risk of vitamin D deficiency (<25.0 nmol/L) in breastfeeding women in this study.
Limitations
Although this is the first data describing vitamin D status in breastfeeding women in Germany, our study sample was not representative and included only a limited number of cases. It is possible that the number of women with potentially confounding characteristics was too low to detect the influence of all associated vitamin D factors. Determinants that may affect vitamin D status, such as dietary vitamin D intake [2], sun exposure and sun protection habits [48], were not evaluated in our study. The absence of this information has two main impacts. First, the influence of longitude on vitamin D status may not have been assessed comprehensively. Second, we cannot exclude that the difference in the vitamin D status between breastfeeding women and NPNP women is influenced by these aspects.
Additionally, our classification schema of skin type (light/dark) may have not been sufficiently precise to determine the influence of skin type on vitamin D status. Moreover, the 25(OH)D concentrations may be higher as detected as the measurement by DiaSorin Liaison chemiluminescence immunoassay underestimate the concentration compared with the analysis by LC-MS/MS [34]. However, the underestimating analysis was applied to both breastfeeding women and NPNB women.
Conclusion
Our data suggest that an inadequate vitamin D status is prevalent in German breastfeeding women and NPNB women without vitamin D supplementation, even in the summer months. Additionally, breastfeeding women had increased odds of vitamin D deficiency (<25.0 nmol/L) compared with NPNB women. Vitamin D status in breastfeeding women depended on longitude of residence and season at the time of blood collection, with higher 25(OH)D concentrations in summer and autumn than in winter and spring. Because higher maternal vitamin D status may result in a higher vitamin D status of breast milk [8], it may also result in an increased fulfillment of infant vitamin D requirements [14]. Vitamin D containing supplements can be an option to ensure adequate vitamin D concentrations in the absence of personal ultraviolet radiation exposure and low vitamin D intake [13]. However, further studies are necessary to determine the optimal vitamin D status of breastfeeding women and the required vitamin D supplementation doses to reach adequate 25(OH)D levels in this population.
Acknowledgements
We would like to thank the physicians and participants who contributed their time to this study.
Funding
The study was supported by Rottapharm Madaus GmbH (Cologne, Germany), now part of Meda AB (Bad Homburg, Germany). Rottapharm Madaus GmbH (Cologne, Germany) and Meda AB (Bad Homburg, Germany) had no role in the design, analysis or writing of this article. The authors declare that they have no competing interests. The authors are solely responsible for the design and implementation of the study and collection, management, analysis, and interpretation of the data, as well as preparation of the manuscript. The publication of this article was funded by the Open Access fund of Leibniz Universität Hannover.
Availability of data and materials
The datasets obtained and/or analysed during the current study are available from the corresponding author on reasonable request.
Authors’ contributions
All authors had full access to the data and take responsibility for its integrity. All authors have read and agree with the manuscript as written.
Competing interests
The authors declare that they have no competing interests.
Consent for publication
Not applicable
Ethics approval and consent to participate
The study was designed and conducted in accordance with the declaration of Helsinki and the principles of Good Clinical Practice. The study protocol was approved by the leading ethics commission of the medical chamber of Lower Saxony (DE/EKNI25) (26.03.2013) and every involved ethic commission of the different study sites of Germany.
Publisher’s Note
Springer Nature remains neutral with regard to jurisdictional claims in published maps and institutional affiliations.
Abbreviations
- 25(OH)D
25-hydroxyvitamin D
- BMI
Body mass index
- IU
International units
- NPNB
Non-pregnant and non-breastfeeding
- Ref.
Reference category
- VitaMinFemin
Vitamin and mineral status among German women
Contributor Information
Sandra Gellert, Email: gellert@nutrition.uni-hannover.de.
Alexander Ströhle, Email: stroehle@nutrition.uni-hannover.de.
Andreas Hahn, Email: hahn@nutrition.uni-hannover.de.
References
- 1.Cashman KD, Dowling KG, Skrabakova Z, Gonzalez-Gross M, Valtuena J, de Henauw S, et al. Vitamin D deficiency in Europe: Pandemic? Am J Clin Nutr. 2016;103:1033–44. doi: 10.3945/ajcn.115.120873. [DOI] [PMC free article] [PubMed] [Google Scholar]
- 2.Rabenberg M, Scheidt-Nave C, Busch MA, Rieckmann N, Hintzpeter B, Mensink GB. Vitamin D status among adults in Germany – results from the German health interview and examination survey for adults (DEGS1) BMC Public Health. 2015;15:76. doi: 10.1186/s12889-015-2016-7. [DOI] [PMC free article] [PubMed] [Google Scholar]
- 3.Seckmeyer G, Schrempf M, Wieczorek A, Riechelmann S, Graw K, Seckmeyer S, Zankl M. A novel method to calculate solar UV exposure relevant to vitamin D production in humans. Photochem Photobiol. 2013;89:974–83. doi: 10.1111/php.12074. [DOI] [PubMed] [Google Scholar]
- 4.Norman AW, Bouillon R. Vitamin D nutritional policy needs a vision for the future. Exp Biol Med (Maywood) 2010;235:1034–45. doi: 10.1258/ebm.2010.010014. [DOI] [PubMed] [Google Scholar]
- 5.Souberbielle J-C, Body J-J, Lappe JM, Plebani M, Shoenfeld Y, Wang TJ, et al. Vitamin D and musculoskeletal health, cardiovascular disease, autoimmunity and cancer: Recommendations for clinical practice. Autoimmun Rev. 2010;9:709–15. doi: 10.1016/j.autrev.2010.06.009. [DOI] [PubMed] [Google Scholar]
- 6.Wuertz C, Gilbert P, Baier W, Kunz C. Cross-sectional study of factors that influence the 25-hydroxyvitamin D status in pregnant women and in cord blood in Germany. Br J Nutr. 2013;110:1895–902. doi: 10.1017/S0007114513001438. [DOI] [PubMed] [Google Scholar]
- 7.Wagner CL, Taylor SN, Johnson DD, Hollis BW. The role of vitamin D in pregnancy and lactation: emerging concepts. Womens Health (Lond) 2012;8:323–40. doi: 10.2217/whe.12.17. [DOI] [PMC free article] [PubMed] [Google Scholar]
- 8.vith Streym S, Hojskov CS, Moller UK, Heickendorff L, Vestergaard P, Mosekilde L, Rejnmark L. Vitamin D content in human breast milk: a 9-mo follow-up study. Am J Clin Nutr. 2016;103:107–14. doi: 10.3945/ajcn.115.115105. [DOI] [PubMed] [Google Scholar]
- 9.Dawodu A, Agarwal M, Sankarankutty M, Hardy D, Kochiyil J, Badrinath P. Higher prevalence of vitamin D deficiency in mothers of rachitic than nonrachitic children. J Pediatr. 2005;147:109–11. doi: 10.1016/j.jpeds.2005.03.001. [DOI] [PubMed] [Google Scholar]
- 10.Wayse V, Yousafzai A, Mogale K, Filteau S. Association of subclinical vitamin D deficiency with severe acute lower respiratory infection in Indian children under 5 y. Eur J Clin Nutr. 2004;58:563–7. doi: 10.1038/sj.ejcn.1601845. [DOI] [PubMed] [Google Scholar]
- 11.Maiya S, Sullivan I, Allgrove J, Yates R, Malone M, Brain C, et al. Hypocalcaemia and vitamin D deficiency: an important, but preventable, cause of life-threatening infant heart failure. Heart. 2008;94:581–4. doi: 10.1136/hrt.2007.119792. [DOI] [PubMed] [Google Scholar]
- 12.Hyppönen E, Läärä E, Reunanen A, Järvelin M-R, Virtanen SM. Intake of vitamin D and risk of type 1 diabetes: a birth-cohort study. Lancet. 2001;358:1500–3. doi: 10.1016/S0140-6736(01)06580-1. [DOI] [PubMed] [Google Scholar]
- 13.Deutsche Gesellschaft für Ernährung, Österreichische Gesellschaft für Ernährung, Schweizerische Gesellschaft für Ernährung [German Nutrition Society, Austrian Society for Nutrition, Swiss Society for Nutrition], editor. Fettlösliche Vitamine: Vitamin D. In: Referenzwerte für die Nährstoffzufuhr [Fat-soluble vitamins: Vitamin D. In: Reference values for nutrient intake]. 2nd ed. Bonn: Neuer Umschau Buchverlag; 2015.
- 14.Hollis BW, Wagner CL, Howard CR, Ebeling M, Shary JR, Smith PG, et al. Maternal versus infant vitamin D supplementation during lactation: a randomized controlled trial. Pediatrics. 2015;136:625–34. doi: 10.1542/peds.2015-1669. [DOI] [PMC free article] [PubMed] [Google Scholar]
- 15.Richter K, Breitner S, Webb AR, Huth C, Thorand B, Kift R, et al. Influence of external, intrinsic and individual behaviour variables on serum 25(OH)D in a German survey. J Photochem Photobiol B Biol. 2014;140:120–9. doi: 10.1016/j.jphotobiol.2014.07.018. [DOI] [PubMed] [Google Scholar]
- 16.Kang YS, Kim JH, Ahn EH, Yoo E-G, Kim MK. Iron and vitamin D status in breastfed infants and their mothers. Korean J Pediatr. 2015;58:283–7. doi: 10.3345/kjp.2015.58.8.283. [DOI] [PMC free article] [PubMed] [Google Scholar]
- 17.Brembeck P, Winkvist A, Bååth M, Bärebring L, Augustin H. Determinants of changes in vitamin D status postpartum in Swedish women. Br J Nutr. 2016;115(3):422–30. doi: 10.1017/S0007114515004560. [DOI] [PubMed] [Google Scholar]
- 18.Challa A, Ntourntoufi A, Cholevas V, Bitsori M, Galanakis E, Andronikou S. Breastfeeding and vitamin D status in Greece during the first 6 months of life. Eur J Pediatr. 2005;164:724–9. doi: 10.1007/s00431-005-1757-1. [DOI] [PubMed] [Google Scholar]
- 19.Andıran N, Yordam N, Özön A. Risk factors for vitamin d deficiency in breast-fed newborns and their mothers. Nutrition. 2002;18:47–50. doi: 10.1016/S0899-9007(01)00724-9. [DOI] [PubMed] [Google Scholar]
- 20.Czech-Kowalska J, Gruszfeld D, Jaworski M, Bulsiewicz D, Latka-Grot J, Pleskaczynska A, et al. Determinants of postpartum vitamin D status in the Caucasian mother-offspring pairs at a latitude of 52°N: a cross-sectional study. Ann Nutr Metab. 2015;67:33–41. doi: 10.1159/000437099. [DOI] [PubMed] [Google Scholar]
- 21.Seth A, Marwaha RK, Singla B, Aneja S, Mehrotra P, Sastry A, et al. Vitamin D nutritional status of exclusively breast fed infants and their mothers. J Pediatr Endocrinol Metab. 2009;22:241–6. doi: 10.1515/JPEM.2009.22.3.241. [DOI] [PubMed] [Google Scholar]
- 22.Dawodu A, Davidson B, Woo JG, Peng Y-M, Ruiz-Palacios GM, de Lourdes Guerrero M, Morrow AL. Sun exposure and vitamin D supplementation in relation to vitamin D status of breastfeeding mothers and infants in the global exploration of human milk study. Nutrients. 2015;7:1081–93. doi: 10.3390/nu7021081. [DOI] [PMC free article] [PubMed] [Google Scholar]
- 23.Gellert S, Schuchardt JP, Hahn A. Higher omega-3 index and DHA status in pregnant women compared to lactating women – Results from a German nation-wide cross-sectional study. Prostaglandins Leukot Essent Fatty Acids. 2016;109:22–8. doi: 10.1016/j.plefa.2016.04.002. [DOI] [PubMed] [Google Scholar]
- 24.Ross CA, Taylor CL, Yaktine AL, Del Valle HB. Dietary reference intakes for calcium and vitamin D. Washington: The National Academies Press (US); 2011. [PubMed] [Google Scholar]
- 25.Holick MF, Binkley NC, Bischoff-Ferrari HA, Gordon CM, Hanley DA, Heaney RP, et al. Evaluation, treatment, and prevention of vitamin D deficiency: an Endocrine Society Clinical Practice Guideline. J Clin Endocrinol Metab. 2011;96:1911–30. doi: 10.1210/jc.2011-0385. [DOI] [PubMed] [Google Scholar]
- 26.Lee P, Greenfield JR, Seibel MJ, Eisman JA, Center JR. Adequacy of vitamin D replacement in severe deficiency is dependent on body mass index. Am J Med. 2009;122:1056–60. doi: 10.1016/j.amjmed.2009.06.008. [DOI] [PubMed] [Google Scholar]
- 27.Zittermann A, Gummert JF. Nonclassical vitamin D actions. Nutrients. 2010;2:408–25. doi: 10.3390/nu2040408. [DOI] [PMC free article] [PubMed] [Google Scholar]
- 28.Mulligan ML, Felton SK, Riek AE, Bernal-Mizrachi C. Implications of vitamin D deficiency in pregnancy and lactation. Am J Obstet Gynecol. 2010;202:429.e1–429.e9. doi: 10.1016/j.ajog.2009.09.002. [DOI] [PMC free article] [PubMed] [Google Scholar]
- 29.Vieth R. Why the minimum desirable serum 25-hydroxyvitamin D level should be 75 nmol/L (30 ng/ml) Best Pract Res Clin Endocrinol Metab. 2011;25:681–91. doi: 10.1016/j.beem.2011.06.009. [DOI] [PubMed] [Google Scholar]
- 30.Maalmi H, Ordonez-Mena JM, Schottker B, Brenner H. Serum 25-hydroxyvitamin D levels and survival in colorectal and breast cancer patients: systematic review and meta-analysis of prospective cohort studies. Eur J Cancer. 2014;50:1510–21. doi: 10.1016/j.ejca.2014.02.006. [DOI] [PubMed] [Google Scholar]
- 31.Melamed ML, Michos ED, Post W, Astor B. 25-hydroxyvitamin D levels and the risk of mortality in the general population. Arch Intern Med. 2008;168:1629–37. doi: 10.1001/archinte.168.15.1629. [DOI] [PMC free article] [PubMed] [Google Scholar]
- 32.Narchi H, Kochiyil J, Zayed R, Abdulrazzak W, Agarwal M. Maternal vitamin D status throughout and after pregnancy. J Obstet Gynaecol. 2010;30:137–42. doi: 10.3109/01443610903315652. [DOI] [PubMed] [Google Scholar]
- 33.Fitzpatrick TB. The validity and practicality of sun-reactive skin types I through VI. Arch Dermatol. 1988;124:869–71. doi: 10.1001/archderm.1988.01670060015008. [DOI] [PubMed] [Google Scholar]
- 34.de Koning L, Al-Turkmani MR, Berg AH, Shkreta A, Law T, Kellogg MD. Variation in clinical vitamin D status by DiaSorin Liaison and LC-MS/MS in the presence of elevated 25-OH vitamin D2. Clin Chim Acta. 2013;415:54–8. doi: 10.1016/j.cca.2012.09.002. [DOI] [PubMed] [Google Scholar]
- 35.Farrell C-JL, Martin S, McWhinney B, Straub I, Williams P, Herrmann M. State-of-the-art vitamin D assays: a comparison of automated immunoassays with liquid chromatography-tandem mass spectrometry methods. Clin Chem. 2012;58:531–42. doi: 10.1373/clinchem.2011.172155. [DOI] [PubMed] [Google Scholar]
- 36.Hintzpeter B, Mensink GB, Thierfelder W, Muller MJ, Scheidt-Nave C. Vitamin D status and health correlates among German adults. Eur J Clin Nutr. 2008;62:1079–89. doi: 10.1038/sj.ejcn.1602825. [DOI] [PubMed] [Google Scholar]
- 37.Souci SW, Fachmann W, Kraut H, editors. Die Zusammensetzung der Lebensmittel, Nährwert-Tabellen [Food Composition and Nutrition Tables] 8. Stuttgart: medpharm Scientific Publishers; 2015. [Google Scholar]
- 38.Deutsche Gesellschaft für Ernährung [German Nutrition Society], editor. 12. Ernährungsbericht [12. Nutrition report] Bonn: DGE Medien Service; 2012. p. 66. [Google Scholar]
- 39.Willers J, Heinemann M, Bitterlich N, Hahn A. Vitamin Intake from Food Supplements in a German Cohort - Is there a Risk of Excessive Intake? Int J Vitam Nutr Res. 2014;84:152–62. doi: 10.1024/0300-9831/a000202. [DOI] [PubMed] [Google Scholar]
- 40.Moller UK, Streym S, Heickendorff L, Mosekilde L, Rejnmark L. Effects of 25OHD concentrations on chances of pregnancy and pregnancy outcomes: a cohort study in healthy Danish women. Eur J Clin Nutr. 2012;66:862–8. doi: 10.1038/ejcn.2012.18. [DOI] [PubMed] [Google Scholar]
- 41.Jones KS, Assar S, Prentice A, Schoenmakers I. Vitamin D expenditure is not altered in pregnancy and lactation despite changes in vitamin D metabolite concentrations. Sci Rep. 2016;6:26795. doi: 10.1038/srep26795. [DOI] [PMC free article] [PubMed] [Google Scholar]
- 42.Engelsen O, Brustad M, Aksnes L, Lund E. Daily duration of vitamin D synthesis in human skin with relation to latitude, total ozone, altitude, ground cover, aerosols and cloud thickness. Photochem Photobiol. 2005;81:1287. doi: 10.1562/2004-11-19-RN-375. [DOI] [PubMed] [Google Scholar]
- 43.van Schoor NM, Lips P. Worldwide vitamin D status. Best Pract Res Clin Endocrinol Metab. 2011;25:671–80. doi: 10.1016/j.beem.2011.06.007. [DOI] [PubMed] [Google Scholar]
- 44.O’Neill CM, Kazantzidis A, Ryan MJ, Barber N, Sempos CT, Durazo-Arvizu RA, et al. Seasonal changes in vitamin D-Effective UVB availability in europe and associations with population serum 25-Hydroxyvitamin D. Nutrients 2016. doi:10.3390/nu8090533. [DOI] [PMC free article] [PubMed]
- 45.Deutscher Wetterdienst [German Meterological Service]. Datenbasis 2013, 2014, 2015: berechnete Mittelwerte [Data base 2013, 2014, 2015: calculated mean values. 2013, 2014, 2015]. 2013–2015. ftp://ftp-cdc.dwd.de/pub/CDC/. Accessed 15 Aug 2016.
- 46.Tonnesen R, Hovind PH, Jensen LT, Schwarz P. Determinants of vitamin D status in young adults: influence of lifestyle, sociodemographic and anthropometric factors. BMC Public Health. 2016;16:385. doi: 10.1186/s12889-016-3042-9. [DOI] [PMC free article] [PubMed] [Google Scholar]
- 47.Webb AR, Engelsen O. Calculated ultraviolet exposure levels for a healthy vitamin D status. Photochem Photobiol. 2006;82:1697–703. doi: 10.1111/j.1751-1097.2006.tb09833.x. [DOI] [PubMed] [Google Scholar]
- 48.Webb AR. Who, what, where and when—influences on cutaneous vitamin D synthesis. Prog Biophys Mol Biol. 2006;92:17–25. doi: 10.1016/j.pbiomolbio.2006.02.004. [DOI] [PubMed] [Google Scholar]
Associated Data
This section collects any data citations, data availability statements, or supplementary materials included in this article.
Data Availability Statement
The datasets obtained and/or analysed during the current study are available from the corresponding author on reasonable request.