

Abstract
Prolyl oligopeptidase B from Galerina marginata (GmPOPB) has recently been discovered as a peptidase capable of breaking and forming peptide bonds to yield a cyclic peptide. Despite the relevance of prolyl oligopeptidases in human biology and disease, a kinetic analysis pinpointing rate-limiting steps for a member of this enzyme family is not available. Macrocyclase enzymes are currently exploited to produce cyclic peptides with potential therapeutic applications. Cyclic peptides are promising druglike molecules because of their stability and conformational rigidity. Here we describe an in-depth kinetic characterization of a prolyl oligopeptidase acting as a macrocyclase enzyme. By combining steady-state and pre-steady-state kinetics, we propose a kinetic sequence in which a step after macrocyclization limits steady-state turnover. Additionally, product release is ordered, where the cyclic peptide departs first followed by the peptide tail. Dissociation of the peptide tail is slow and significantly contributes to the turnover rate. Furthermore, trapping of the enzyme by the peptide tail becomes significant beyond initial rate conditions. The presence of a burst of product formation and a large viscosity effect further support the rate-limiting nature of a physical step occurring after macrocyclization. This is the first detailed description of the kinetic sequence of a macrocyclase enzyme from this class. GmPOPB is among the fastest macrocyclases described to date, and this work is a necessary step toward designing broad-specificity efficient macrocyclases.
The prolyl oligopeptidase (POP) family comprises endo- and exopeptidases that can be identified in all domains of life.1 Their importance lies in the fact that very few general proteases can cleave at a proline residue because of the unique conformational properties they attribute to peptides. As the majority of peptide hormones and neuropeptides contain proline residues, biology has evolved specific proline oligopeptidases2 to process and degrade such substrates. Recently, an enzyme belonging to the prolyl oligopeptidase family but capable of catalyzing both cleavage and formation of a peptide bond (in a macrocyclization reaction) was identified.3 Prolyl oligopeptidase B from Galerina marginata (GmPOPB) participates in the biosynthesis of amanitins, a family of mushroom toxins. Amanitins are characterized by an eight-amino acid peptide core sequence, IWGIGC(N/D)P, a distinctive sulfoxide tryptathionine cross-link between tryptophan and cysteine, and varying degrees of hydroxylation (Scheme S1).4 Around 90% of all poison-related fatalities caused by mushrooms are due to cyclic peptide toxins of the amanitin family.5
Amanitins are ribosomally synthesized and post-translationally modified peptides (RiPPs),6 comprising a class of molecules that are attractive as sources of new medicines. RiPPs are characterized by their synthesis, catalyzed by individual enzymes working in cascade, acting on a genetically encoded peptide precursor, which contains a core peptide (comprising the final cyclic product) flanked by disposable recognition “tags”.6 The products are often highly modified by oxidation, hydroxylation, and prenylation.7 Macrocyclic RiPPs are particularly promising as druglike molecules as they are structurally rigid and inherently resistant to protease degradation and penetrate the cell.8 Four classes of peptide macrocyclases involved in RiPP biosynthesis have been identified to date.3,9−12 The most well characterized are PatGmac13 (and homologues), from the patellamide pathway, and the asparaginyl endopeptidase Butelase 1, from the plant Clitoria ternatea.10 PatGmac has been shown to be a highly versatile tool in the production of cyclic peptides.14−16 However, PatGmac reactions are very slow in vitro,11 although addition of reductant to Escherichia coli cultures improves production of the cyclic peptide patellin using the homologous tru enzymes by multiple orders of magnitude.17 Butelase 1 is remarkably fast and effective as a tool for producing large peptide macrocycles,18−20 but it cannot effectively cyclize peptide substrates containing nine or fewer amino acids.21 The initial characterization of the macrocyclization reaction of the GmPOPB enzyme has shown it possesses a catalytic rate much faster than that of PatGmac in vitro (albeit slower than Butelase 1), and that its natural substrate yields a macrocycle that contains eight amino acids.3
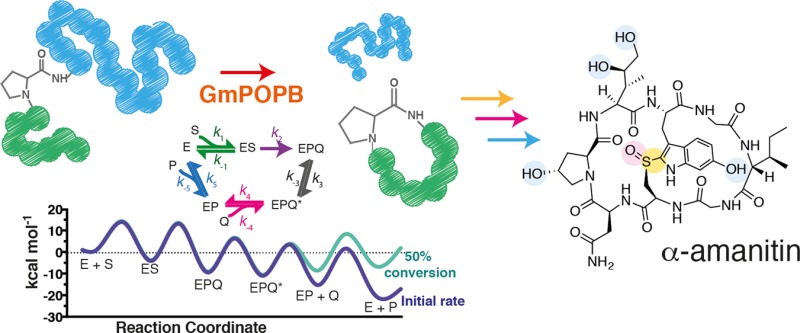
The substrate used by GmPOPB to form a cyclic peptide as a final product is ribosomally encoded as a 35-amino acid peptide. GmPOPB first catalyzes peptide bond hydrolysis in this precursor peptide, cleaving off 10 N-terminal residues (leader peptide). The resulting peptide with 25 amino acids (25mer) is then utilized by GmPOPB as a substrate for the macrocyclization reaction (Scheme S1). During the macrocyclase reaction, GmPOPB generates an eight-amino acid cyclic peptide from the N-terminal residues (the core), cleaving off the 17-C-terminal amino acid recognition sequence (peptide tail). This tail is thought to be required for peptide recognition by GmPOPB, and truncations were shown to cause loss of macrocyclase activity.3Scheme 1 summarizes the macrocyclization reaction.
Scheme 1. Macrocyclization Reaction Catalyzed by GmPOPB.

The core sequence is colored green, the core proline pink, and the peptide tail blue.
Here we have established the kinetic sequence for the macrocyclase activity of GmPOPB. We combined steady-state and pre-steady-state kinetics to dissect rate-limiting steps in the reaction. This work is the first step toward elucidating GmPOPB’s mechanism and should contribute to the engineering of more efficient macrocyclases.
Experimental Procedures
Materials
The 25mer peptide was purchased from Biosynthesis, as free amine and free carboxylic acid, at a purity of >90% and used without further purification. Buffers and chemicals, unless specified, were from Sigma. The peptide tail and cyclic peptide were produced enzymatically by performing a 5 mL reaction with 5 μM GmPOPB and 500 μM 25mer as the starting material. The unreacted peptide, cyclic product, and 17-amino acid peptide tail were separated by high-performance liquid chromatography (HPLC) (Agilent infinity 1260 series, Agilent Technologies) using a Macherey-Nagel Nucleodur C18 column (10 μm × 16 mm × 250 mm) and a gradient from a 0.1% TFA aqueous solution to 32–40% acetonitrile (10 mL/min). Fractions containing each peptide of interest were pooled; their identity and purity were verified by LC–MS, and the fractions were lyophilized for subsequent use. Figure S9 shows the HPLC trace for the purification of the cyclic peptide and recognition tail, as well as high-resolution mass spectrometry for the purified compounds. Concentrations of peptides were calculated on the basis of their absorbance at 280 nm (ε280-25mer = 11000 M–1 cm–1, ε280-cyclic = 5500 M–1 cm–1, and ε280-tail = 5500 M–1 cm–1).22
Expression and Purification of Recombinant Proteins
Plasmid pJExpress414 encoding the codon-optimized G. marginata POPB gene was purchased from DNA 2.0. Plasmids were transformed into BL21(DE3) cells (Agilent). Cultures (100 mL) were grown overnight at 37 °C in the presence of 100 μg/mL ampicillin and then diluted 100-fold into 6 L of Terrific Broth (TB) medium. These cultures were grown at 37 °C while being shaken (200 rpm) until the optical density at 600 nm (OD600) reached 0.6. Cells were cooled for 1 h to 16 °C, and protein expression was then induced by the addition of 0.5 mM isopropyl β-d-thiogalactopyranoside (IPTG, Generon). Cultures were incubated for an additional 16 h and centrifuged at 6000g for 15 min. Cell pellets were resuspended in 250 mL of nickel lysis/wash buffer [50 mM HEPES (pH 8.0), 300 mM NaCl, 10 mM imidazole, 10% glycerol, and 2 mM β-mercaptoethanol] supplemented with cOmplete EDTA-free protease inhibitor tablets (Roche Applied Science). The resulting suspension was lysed by two passages through a cell homogenizer at 30K psi and purified by nickel chromatography using a HisTrap FF column (GE Healthcare). Each desired protein was eluted using a step elution with lysis buffer supplemented with 250 mM imidazole (buffer B). Eluted protein was dialyzed overnight against buffer C [50 mM HEPES (pH 8.0), 50 mM NaCl, 10% glycerol, and 2 mM β-mercaptoethanol], while simultaneously, the His tag was being cleaved by TEV protease.23 This dialyzed TEV-cleaved mixture was loaded onto a HisTrap column connected in tandem to a HiTrap Q FF column (GE Healthcare). Both columns were washed with buffer C, and GmPOPB was eluted during this wash. Fractions were pooled and concentrated to <8 mL (at 10 mg/mL approximately). Protein was loaded onto a Superdex S200 gel filtration column (GE Healthcare) pre-equilibrated with storage buffer D [50 mM HEPES (pH 8.0), 50 mM NaCl, 10% glycerol, and 2 mM β-mercaptoethanol]. Fractions containing pure protein were combined, concentrated, divided into aliquots, flash-frozen, and stored at −80 °C. Protein concentrations were determined by the absorbance at 280 nm.22 Protein purity was assessed by sodium dodecyl sulfate–polyacrylamide gel electrophoresis (>95%).
Site-Directed Mutagenesis
To generate the inactive mutant S577A, the mutagenesis protocol described by Liu and Naismith was employed.24 Oligonucleotides for mutagenesis were purchased from IDT, and their sequence is shown in Table S2. To verify that no other alterations in the sequence were introduced, sequencing was performed using at least three primers to cover the entire gene sequence (Eurofins).
General Procedure for Kinetic Assays under Steady-State Conditions
The standard buffer for routine assays consisted of 50 mM Tris (pH 8.0), 50 mM NaCl, and 10 mM DTT. Reactions were started by adding GmPOPB. Unless stated otherwise, all experiments were performed in duplicate. The reaction was quenched at several time points by adding 50 μL of the reaction mixture to 20 μL of 6% TFA. Figure S8 shows that the reaction is quenched by this procedure. Reactants were separated from products for quantification by injecting 60 μL of each quenched time point onto a ZORBAX SB-C18, 5 μm, 9.4 mm × 50 mm (Agilent) column connected to an Agilent LC–MS instrument (G6130B Single Quad, Agilent Technologies). Reactants were separated from products using a gradient from A (H2O with 0.1% TFA or H2O with 0.1% formic acid) to 50% B (acetonitrile), at a rate of 1.5 mL/min for 8 min. The area of each peak (reactant and cyclic peptide product) was integrated, and the percentage of product formed was calculated by correcting the absorbance values for differences in the extinction coefficient of each peptide (ε280-25mer = 11000 M–1 cm–1, ε220-25mer = 46000 M–1 cm–1, ε280-cyclic = 5500 M–1 cm–1, ε220-cyclic = 34000 M–1 cm–1, and ε280-tail = 5500 M–1 cm–1). After this, the sum of product plus substrate was considered equal to the total initial amount of substrate present, and the concentration of product formed was calculated in molar. The amount of product formed in molar over time was plotted to yield the micromolar cyclic product formed per second. The slope of this line was corrected for the concentration of enzyme present to yield v/Et (s–1), replotted as a function of peptide concentration and fitted to eq 1 to obtain Michaelis–Menten parameters.
pH–Rate Profiles and Temperature Studies
Before measuring the temperature dependence and pH dependence of kcat and kcat/Km, we incubated the enzyme for 10 min at the desired pH or temperature, after which it was diluted in the standard reaction mixture and assayed under standard conditions [50 mM Tris (pH 8.0), 50 mM NaCl, 10 mM DTT, and 100 μM 25mer peptide substrate] to ensure that the protein was not unfolded and remained active upon being incubated under the tested conditions. For pH–rate profiles, reactions were performed at 37 °C with the 25mer substrate. Reactions were started by adding GmPOPB (concentrations ranging from 5 to 50 nM), and the following buffers were used, all at 100 mM: Bis-Tris (pH 6.5 and 6.8), Tris (pH 6.7, 7.1, 7.5, 7.7, 8.2, and 8.8 at 37 °C), CHES (pH 9.0 and 10.0), and CAPS (pH 10.0 and 10.5). Buffers with overlapping pH values were used when switching between buffers.25 Data from the kcat/Km–pH profile were fitted to eq 2. Temperature studies were performed in 100 mM HEPES (pH 8.0) with 50 mM NaCl and 10 mM DTT, at 5 °C increments from 10 to 45 °C. Data for the Arrhenius plot for kcat and kcat/Km were fitted to eq 4.
SKIEs and Viscosity
Solvent kinetic isotope effects (SKIEs) were measured with the 25mer peptide in either H2O or 98% D2O at 37 °C. Reactions were started by adding GmPOPB (20, 60, or 60 nM for reactions in H2O, D2O, or 9% glycerol, respectively), and initial velocities in the presence of varying concentrations of the peptide substrate were obtained. Effects caused by viscosity were evaluated by comparing the rates obtained in H2O, and 9% glycerol, to mimic the relative viscosity of D2O (ηr = 1.24).26 To eliminate effects caused by small variations in pH, measurements were performed at a plateau region observed in the pH–rate profiles (pL 8.0). pL values were measured using a pH meter, and buffers prepared in D2O had their pD value calculated with the relationship pD = pH* + 0.4, where pH* is the reading obtained on the pH meter.27 Curves for H2O, D2O, and 9% glycerol were performed simultaneously in duplicate, and each set of experiments was repeated three times. All data from separate experiments were averaged and analyzed to give the values reported here.
Pre-Steady-State Experiments Using a Quenched-Flow Apparatus
Single and multiple turnovers were monitored using a QFM-4000 (Biologic) quenched-flow apparatus (laboratory of D. Lilley at the University of Dundee, Dundee, U.K.). All experiments were performed at 20 °C, in duplicate. Equal volumes of GmPOPB and 25mer substrate were mixed, and the reaction was quenched with 6% TFA at various times and analyzed by LC–MS as described above. For single-turnover experiments, 44, 75, and 100 μM GmPOPB were mixed with 10 μM 25mer substrate and data were fitted to a single-exponential equation (eq 5). For multiple-turnover experiments, 10 μM GmPOPB was mixed with 100 or 200 μM 25mer substrate and data were fitted to a single-exponential equation followed by a linear phase (eq 6). All concentrations are final, after mixing. Final fitted numbers reported in Table 2 were obtained by global fitting using numerical integration in Kintek Global Explorer28 followed by Fitspace29 error analysis, as described below. Analytical fits were used to obtain only initial estimates for kinetic parameters. All fitted values reported in Table 2 and Figure 5 were obtained by global fitting using numerical integration.
Table 2. Rate Constants and Boundaries Obtained by Numerical Fitting of All Experiments to the Model Depicted in Figure 5a.
| parameter or rate constant | Kintek best-fit value | boundaries obtained by numerical fitting (χ2 = 0.996 at boundary) |
|---|---|---|
| k1b (μM–1 s–1) | 7.82 ± 0.05 | 7.5–8.11 |
| k–1b (s–1) | 0.313 ± 0.02 | |
| k2 (s–1) | 0.86 ± 0.01 | 0.774–0.932 |
| k3 (s–1) | 12.33 ± 1.69 | 5.05–27.7 |
| k–3 (μM–1 s–1) | 0.78 ± 0.08 | 0.435–0.952 |
| k4c (s–1) | 100 | 23.9–435 |
| k–4c (μM–1 s–1) | 60 | 58–286 |
| k5b (s–1) | 1.44 ± 0.01 | 1.42–1.47 |
| k–5b (μM–1 s–1) | 3.22 ± 0.01 |
Errors for Kintek best-fit values are standard deviations.
Rate constants that were linked during global fitting based on ITC Kd values (Figure S11).
Rate constants kept constant at their best-fit values during global fitting.
Figure 5.

Kinetic sequence determined here. Shown in the top panel is the generic nomenclature for the steps in the sequence. Shown in the middle panel are steps with intermediates in the GmPOPB kinetic sequence and rate constants determined by global fitting. Shown in the bottom panel is the energy profile for the entire reaction. Energy barriers were calculated according to eq 8. The purple curve represents initial rate conditions with 200 μM 25mer and 0.001 μM products. The green curve represents 50% conversion of the substrate into products (100 μM 25mer substrate, 100 μM cyclic peptide, and 100 μM peptide tail).
Pre-Steady-State Fluorescence Experiments
Binding and dissociation rate constants were measured by stopped-flow fluorescence quenching or enhancement on a SX-20 stopped-flow apparatus (Applied Photophysics), by exciting tryptophan residues at 285 nm and monitoring fluorescence emission above 320 nm. All experiments were performed at 20 °C. Traces shown are the average of 6–10 kinetic traces. A minimum of 1000 time points were collected per trace. Control experiments without enzyme were conducted to evaluate the presence of inner filter effects, which were insignificant in the range of peptide concentrations employed here. Traces obtained by mixing peptide and buffer were subtracted from traces obtained by mixing protein and peptide.
Analytical fitting was performed only when peptide concentrations exceeded 5 times the concentration of enzyme to maintain pseudo-first-order conditions. Analytical fits for the 25mer substrate and peptide tail are shown in Figures S2–S5. Final fitted numbers listed in Table 2 were obtained by global fitting using numerical integration in Kintek Global Explorer28 followed by Fitspace29 error analysis, as described below. Analytical fits were used to obtain only initial estimates for kinetic parameters. All fitted values reported in Table 2 and Figure 5 were obtained by global fitting using numerical integration. All data points were included when data were analyzed numerically (described below). For 25mer binding experiments, the GmPOPB-S577A concentration was 1 μM, and the 25mer peptide concentration was varied from 0.2 to 25 μM. For binding of the peptide tail, the GmPOPB concentration was 2 μM, and the peptide concentration was varied from 0.5 to 20 μM. For cyclic peptide binding, the GmPOPB-S577A concentration was 2 μM, the peptide tail (WTAEHVDQTLASGNDIC) concentration was 5.3 μM (in the same syringe as GmPOPB-S577A), and the cyclic peptide concentration was varied from 0.5 to 2 μM. Concentrations of >2 μM showed poor signal amplitude because most of the signal was lost in the instrument’s dead time. All concentrations are final (after mixing).
Isothermal Titration Calorimetry (ITC)
Titrations were performed on a MicroCal PEAQ-ITC instrument (MicroCal, Malvern Instruments, Northamption, MA), and the results were fitted using the PEAQ-ITC analysis software (MicroCal, Malvern Instruments). Stock solutions of 25- and 17mers were prepared in 20 mM Tris (pH 8.0) containing 1 mM DTT. Both were buffer-exchanged by three cycles of dilution in 50 mM Tris (pH 8.0) with 50 mM NaCl and 10 mM DTT followed by concentration using a Microsep Advance centrifugal device with a 1 kDa cutoff membrane (Pall Corp.). The native and S577A proteins were treated in the same manner but concentrated using a Vivaspin protein concentrator spin column (30 kDa cutoff, GE Healthcare). A final dilution to the concentration to be used for titration was performed using the buffer that passed through during the protein buffer exchange, both for the protein and peptide to match buffers. The stirred cell contained 300 μL of 20 μM protein, and the injection syringe contained 75 μL of 200 μM 25mer or peptide tail ligands. Titrations of peptide into protein solutions were conducted at 20 °C. A total of 19 injections of 2 μL were made at 120 s intervals; the first injection was discarded from analysis. Blank runs in which peptides were titrated into buffer were performed to correct for the heats of dilution and mixing, and the dilution isotherm for each peptide ligand was subtracted from the respective binding isotherm prior to curve fitting. Equilibrium dissociation constants (Kd) as well as ΔH and ΔS values for binding of each peptide to the protein were obtained by fitting the calorimetric data with a single-site model using stoichiometry parameter n fixed at 1.0. Fits in which stoichiometry parameter n was allowed to vary were performed, resulting in an n approaching 1 and no difference in Kd values within experimental error when n was varied or fixed at 1.0.
Equations Used for Analytical Data Fitting
Kinetic data were fitted to a Michaelis–Menten equation (eq 1)
| 1 |
where v is initial velocity, V/Et is the maximal velocity corrected for enzyme concentration, Km is the Michaelis–Menten constant, and S is the concentration of the peptide substrate.
pH–rate profile data were fitted to eq 2, describing the presence of a bell-shaped pH curve with one ionizable group in the acidic limb and one in the basic limb.
| 2 |
where y is the kinetic parameter, C is the pH-independent value of y, pH is the experimental pH, and pKa1 and pKa2 are apparent acid dissociation constants for ionizing groups.
Deuterium solvent isotope effects and viscosity effects were calculated by dividing the values obtained for kinetic parameters in H2O by those obtained in D2O. The ratio is the observed effect. This value has no units because it results from a division of H2Okcat/D2Okcat and (H2Okcat/Km)/(D2Okcat/Km). Errors were propagated using eq 3.
| 3 |
where δQ is the error on parameter Q (to be determined), δa is the error on parameter a, δb is the error on parameter b, etc.
Temperature effects were fitted to an Arrhenius equation (eq 4)
| 4 |
where k is kcat or kcat/Km at a given temperature, Ea is the energy of activation, T is the temperature in kelvin, R is the gas constant (1.98 cal mol–1), and A is a pre-exponential factor that correlates collision frequency and the probability of the reaction occurring when reactant molecules collide.
Data for single-turnover and multiple-turnover experiments were fitted to eqs 5 and 6, respectively
| 5 |
| 6 |
where y(t) is the amount of cyclic peptide formed (micromolar) at time t, A is the amplitude of the transient, k is the observed rate constant for the transient, C is the offset, and v is the slope of the linear phase observed in multiple-turnover experiments.
The apparent dissociation constant for a two-step binding process (Kov) is defined by eq 7
| 7 |
where k1 and k2 are association rate constants for the first and second phases, respectively, and k–1 and k–2 are dissociation rate constants for the first and second phases, respectively. Equation 7 was adapted from ref (30).
To obtain the free energy profile shown in Figure 5, eq 8 was used with a temperature of 20 °C (293.15 K)
| 8 |
where ΔGi† is the energy barrier for any given step, R is the gas constant (1.98 cal mol–1), T is the temperature in kelvin, κB and h are Boltzmann’s and Planck’s constants, respectively, and ki is the rate constant for any given step.
All data fitted analytically are represented as means ± the standard error.
Data Fitting by Numerical Integration
Global fitting combining quenched-flow and stopped-flow data from all experiments to the mechanism proposed here (single turnover and multiple turnover, binding of 25mer, binding of peptide tail, and binding of the cyclic peptide to the GmPOPB–tail complex, shown in Figure 5) and global fitting of individual experiments with concentration series (Table S1) were performed by regression analysis based upon numerical integration of the rate equations using KinTek Global Kinetic Explorer version 6.0 (KinTek Corp., Austin, TX).31 For different ligand concentrations, scaling factors were included in the data fitting process, and estimates for errors on parameters were derived by nonlinear regression and by Fitspace confidence contour analysis.28,29,31
Initially, each experiment was globally fitted in isolation to obtain estimates for kinetic rate constants and scaling factors, as well as to test for alternative models. During this phase, no constraints were imposed on fitting and all parameters were allowed to vary freely. Data obtained for each individual fit are listed in Table S1. Once a model was considered constrained and a good fit to the data from each separate experiment was performed, the parameters obtained were used as the starting point for the simultaneous global fitting of five experiments (single turnover, multiple turnover, binding of 25mer substrate, binding of peptide tail, and binding of cyclic peptide to GmPOPB-tail) to the model depicted in Figure 5. For global fitting of all experiments, k1 and k–1 and k5 and k–5 were linked according to Kd values from ITC experiments [Kd-25mer-S577A = 44 ± 10 nM, and Kd-tail = 442 ± 60 nM (Figure S11)]. Chemistry was considered irreversible (k–2 = 0). Additionally, k4 and k–4 were fixed at their best-fit values. After global fitting, results were analyzed by Fitspace contour analysis. A χ2 threshold limit of 0.833 was used for the boundary search, and results are reported as the χ2 threshold at the boundary for each parameter (χ2 = 0.996). Gray lines on Figures 2 and 3 represent Fitspace boundaries for the rate constants listed in Table 2.
Figure 2.
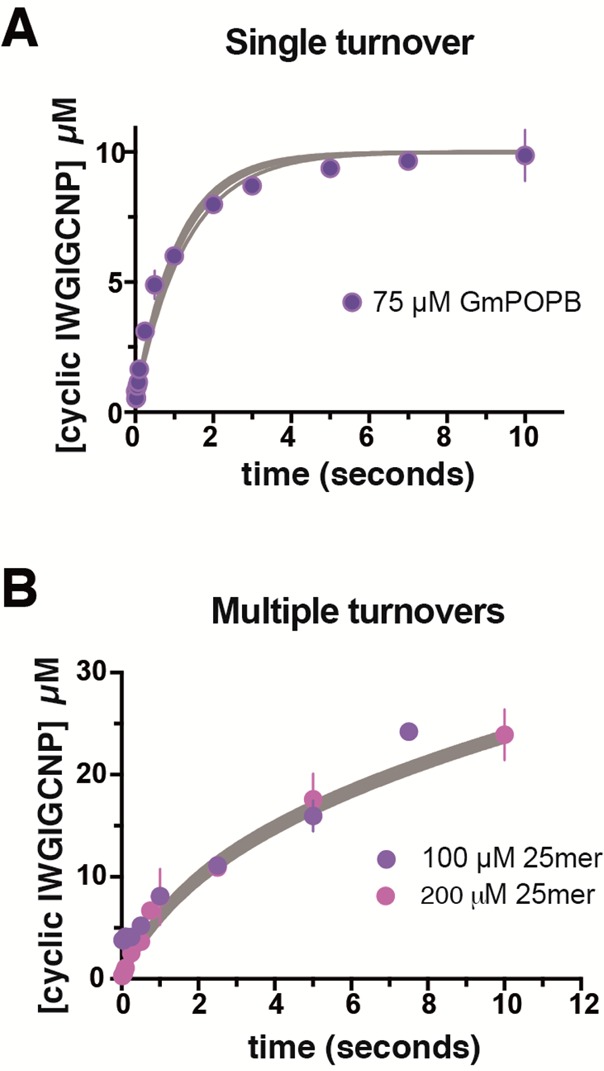
Global fitting of data from single-turnover and multiple-turnover experiments under pre-steady-state conditions. Fitspace boundaries at χ2 = 0.996 are shown as gray lines. (A) Single-turnover experiment with 75 μM GmPOPB and 10 μM 25mer substrate (purple circles). (B) Multiple-turnover experiment with 100 μM (purple circles) and 200 μM (pink circles) 25mer substrate and 10 μM GmPOPB. The reaction was quenched with a quenched-flow apparatus, and the concentration of the cyclic peptide product was determined using the LC–MS-based assay described in Experimental Procedures. For all data, error bars are standard errors of the mean.
Figure 3.

Stopped-flow binding. Global fitting of experiments under pre-steady-state conditions. Experiments were performed by monitoring tryptophan fluorescence (fluorescence excitation at 285 nm and emission above 320 nm). Fitspace boundaries at χ2 = 0.996 are shown as gray lines. (A) Binding of the tail sequence to GmPOPB. (B) Binding of the 25mer substrate to GmPOPB. (C) Binding of the cyclic peptide to the GmPOPB–tail complex. Data are shown as the change in fluorescence upon binding; i.e., traces were subtracted from data obtained with only the GmPOPB–tail complex. (D) Close-up of the red box in panel C showing two transients upon cyclic peptide binding.
Results
Kinetic Characterization of GmPOPB
An LC–MS spectrum of a typical time course reaction for the recombinantly produced enzyme operating under initial rate conditions is shown in Figure 1A. The following kinetic parameters were obtained in H2O: Km-25mer = 51 μM, and kcat-25mer = 35 min–1 (or 0.58 s–1) (at 37 °C); Km-25mer = 55 μM, and kcat-25mer = 14 min–1 (or 0.23 s–1) (at 20 °C).
Figure 1.

Steady-state characterization of GmPOPB. (A) Representative LC–MS trace for the reaction quenched at different time points showing a decrease for the substrate (25mer) and an increase for the cyclic peptide over time. (B) pH–rate profiles for GmPOPB. The kcat profile is colored blue, and the kcat/Km profile is colored purple. (C) Temperature studies. The kcat profile is colored blue, and the kcat/Km profile is colored purple. (D) Solvent kinetic isotope effects (H2O in purple circles, D2O in blue squares) and viscosity with 9% glycerol (pink circles). For all data, error bars are standard errors of the mean.
pH–Rate Profile and Temperature Effects
GmPOPB remains active over the broad pH rage studied here (6.5–10.5). Because of very high Km values at extreme pH values, it could not be assayed robustly outside this range; however, incubation for several minutes at pH 5 and 11 showed that activity was recovered upon a return to pH 8.0. No pH dependence was observed on kcat, while a bell-shaped profile with two ionizable groups (one general acid and one general base) was observed for kcat/Km (Figure 1B). pKa values of 7.6 ± 0.5 and 8.7 ± 0.4 were obtained. Temperature studies were performed from 10 to 45 °C, and a linear dependence of kcat on temperature was observed, indicating that the rate-determining step is constant within this temperature range (Figure 1C). Data fitting to an Arrhenius equation yielded an activation energy of 8.5 kcal mol–1 for kcat. This value is similar to the activation energy for proteolysis for the POP from Pyrococcus furiosus(32) but significantly smaller than the value reported for Sus scrofa (porcine) POP, which varied from 14 to 20 kcal mol–1 depending on the substrate used.33 The activation energy calculated for kcat/Km is 11.1 kcal mol–1. The activation energy for kcat/Km represents the highest energy barrier from the association of the free enzyme and free substrate, up to and including the first irreversible step in this reaction, usually considered to be the formation of the acyl–enzyme intermediate for a protease-type reaction.34
Solvent and Viscosity Effects
Given the kcat/Km profile exhibited a pronounced bell-shaped pH–rate profile (Figure 1B), solvent kinetic isotope effects were measured to probe the rate-limiting nature of protonation steps (Figure 1D). The following values were obtained: D2Okcat = 6.0 ± 0.8, and D2Okcat/Km = 3.5 ± 1.3 [which could suggest rate-limiting protonation step(s)]. Because D2O has a relative viscosity higher than that of H2O and has been shown to affect solvent isotope effect experiments35 as well as to affect the rate of reaction when conformational changes are rate-limiting,36 a control experiment using glycerol at a concentration matching the relative viscosity of deuterated water was performed. The following viscosity effects were observed: 9%Glykcat = 7.3 ± 1.0, and 9%Glykcat/Km = 2.1 ± 0.9 (which are similar within experimental error to the values obtained in the isotope effect experiment).
Pre-Steady-State Kinetics
Single-Turnover and Burst Kinetics
We performed single- and multiple-turnover experiments to estimate the rate of chemistry. It is important to point out that the rate of chemistry reported here (k2) is not a microscopic rate constant but instead a macroscopic constant encompassing the rates of formation of the first tetrahedral intermediate, the acyl–enzyme intermediate, formation of a second tetrahedral intermediate leading to formation of the cyclic peptide, and any possible conformational changes that might be associated with these events. In the single-turnover experiments using 44 μM enzyme substrate, binding still contributed to the observed rate because the observed rate constant was smaller than those observed at 75 and 100 μM GmPOPB. Increasing the concentration of enzyme, we observed the same rate constant within experimental error when 75 and 100 μM GmPOPB were employed (Figure 2A). With 75 μM GmPOPB, by analytical fitting, a transient with a kchem-obs of 1.07 s–1 was observed, with an amplitude of 8.77 μM. Because the concentration of substrate used was 10 μM, this demonstrates that the enzyme utilized is close to 90% active. The fact that the macroscopic rate of chemistry is faster than kcat implies the system should exhibit burst kinetics, and indeed, we observed such behavior (Figure 2B). The value obtained for kburst was 1.26 s–1 (as expected, higher than kchem-obs), while the kcat obtained for the linear phase was 0.13 ± 0.07 s–1, in good agreement with the kcat obtained under initial rate conditions (Table 1). Quenched-flow data fitted globally (single and multiple turnovers) are shown in Figure 2, where Fitspace boundaries at χ2 = 0.996 are shown as gray lines.
Table 1. Kinetic Parameters, Equilibrium Constants, and Kinetic Constantsa.
| parameter or rate constant | value obtained by analytical fitting |
|---|---|
| Kd-25merb (nM) | 44 ± 10 |
| Kd-tailb (nM) | 442 ± 60 |
| Kd-tailc (nM) | 731 |
| Kov-cyclicd (nM) | 99.2 |
| Km-25mer (μM) | 55.4 ± 18.6 |
| kcat-25mer, experimental (s–1) | 0.23 ± 0.03 |
| kcat-25mer,e calculated (s–1) | 0.25 |
| kchem-obs (s–1) | 1.07 ± 0.08 |
| STO amplitude (μM) | 8.77 ± 0.18 |
| kburst (s–1) | 1.26 ± 0.56 |
| MTO (burst) amplitude (μM) | 8.4 ± 2.7 |
| kcat-burst (s–1) | 0.13 ± 0.07 |
All values were obtained at 20 °C, with 50 mM Tris-HCl (pH 8.0), 50 mM NaCl, and 10 mM DTT. For data fitted analytically, error values are standard errors of the mean using experimental values in duplicate, and not errors for the tolerance of the fit.
Measured by ITC (Figure S11).
Calculated by Kd-tail = k–5/k5.
Calculated according to eq S1.
Stopped-Flow Experiments for Binding and Product Release Steps
Stopped-flow data fitted globally are shown in Figure 3 (25mer binding, tail binding, and cyclic peptide binding to the GmPOPB–tail complex), and Fitspace boundaries at χ2 = 0.996 are shown as gray lines. Binding of the 25mer substrate (Figure 3A) and the tail sequence (Figure 3B) displayed single transients. Analytical fitting showed a linear dependence of kobs on peptide concentration (Figures S2 and S4). This is diagnostic of a single-step binding event. Additionally, Fitspace29 analysis testing both one-step and two-step binding mechanisms confirmed that 25mer and tail binding occurred each in a single step, as two-step binding mechanisms could not be fit to the data. Binding of the cyclic peptide product to the GmPOPB–tail complex was a two-step process, with a very fast transient followed by a slower phase (Figure 3C,D). Binding experiments using cyclic peptide and GmPOPB showed no observable change in the fluorescence signal (Figure S6). Because both the protein and the cyclic peptide contain tryptophan residues, a signal for binding (which was observed in all other binding experiments performed) was expected unless such interaction is very weak or nonexistent (Figure S6). After global fitting, the kinetic parameters obtained are listed in Table 2. Initial fitting was well constrained for all kinetic parameters except for k4 and k–4, a fast bimolecular step with very small amplitude for which most of the first transient was lost in the dead time of the stopped-flow instrument. Fitspace analysis when k4 and k–4 were free to vary revealed a very wide confidence interval, and these parameters were not well constrained by the data (Table S1). Therefore, k4 and k–4 were fixed at their best-fit values during global fitting. Figure 4 shows the results of the Fitspace error analysis, in which each pair of rate constants is well-constrained, possessing a well-defined local minimum. The best-fit values for each rate constant reveal that macromolecular rate k2 is comparable in magnitude to that of tail release (k5), indicating that both contribute to the turnover rate.
Figure 4.
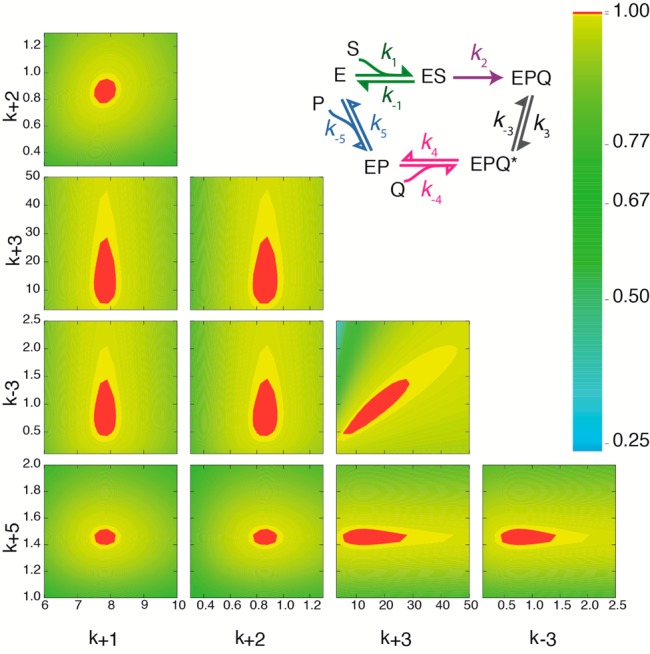
Fitspace contour error analysis of the global numerical fitting of the kinetic sequence proposed here. All experiments from Figures 3 and 4 were globally fitted to the mechanism depicted. For the simultaneous global fitting of all experiments, k1 and k–1 and k5 and k–5 were linked by their experimentally determined Kd values (Kd-25mer-S577A = 44 ± 10 nM, and Kd-tail = 442 ± 60 nM). Chemistry was considered irreversible (k–2 = 0). Additionally, k4 and k–4 were fixed at their best-fit values. In these contour plots, k1, k2, k3, k–3, and k5 are shown as a function of each other, and defined boundaries are present for each kinetic parameter. χ2 at the boundary is 0.996.
Discussion
GmPOPB is an unusual peptidase, catalyzing the canonical reaction of its enzyme class, i.e., peptide bond cleavage following a proline, but also peptide bond formation to generate a cyclic peptide. Here we have for the first time determined the kinetic sequence for the macrocyclase reaction performed by a prolyl oligopeptidase enzyme. Despite substantial kinetic information being available for proteases of other classes, POPs remain less well explored. This is the first pre-steady-state study of both a POP and a macrocyclase enzyme.37
Previously, GmPOPB was produced in G. marginata mushrooms after transformation with Agrobacterium tumefaciens.3 Here, the enzyme was produced recombinantly in E. coli, and the kinetic parameters are comparable to those of the enzyme purified from mushroom, although kcat is 9-fold smaller.3 The most efficient macrocyclase characterized to date is Butelase 1 (kcat/Km = 10700 M–1 s–1 when using a modified sequence for cyclotide kalata B1).10 GmPOPB has a kcat/Km of 3255 M–1 s–1, being the most efficient macrocyclase when using short substrates (eight amino acids in the core sequence).
Our results show that GmPOPB employs acid–base catalysis with pKa values separated by only ∼1 pH unit. In comparison, when a dipeptide was used as a substrate for porcine POP, three ionizable groups with pKa values of 5, 7, and 9.5 were observed.38−40 In the porcine enzyme, titration of the catalytic histidine (His680, equivalent to His698 in GmPOPB) revealed a pKa of 6.25 for this group, slightly smaller than those observed for other serine proteases (∼7).41,42 The pKa value of 9.5 was attributed to instability of the protein at high pH,43 while the two lower pKa values were credited to two interconverting enzyme forms in solution at acidic pH.1 POP from P. furiosus showed pKa values for kcat/Km of 4.7, 7.7, and 8.7.32 However, this enzyme displayed a high solvent kinetic isotope effect and was thought to possess a mechanism akin to that of chymotrypsin, in which proton transfer is the rate-limiting step.32
Because the putative catalytic triad of GmPOPB includes histidine 698, it is possible that both pKa values observed here reflect ionization states for this residue. According to the mechanism proposed in Scheme S2, histidine 698 has a neutral charge when substrate binds but is protonated when tetrahedral intermediates are formed. This is in agreement with the bell-shaped kcat/Km pH–rate profile observed for GmPOPB. The values are in the vicinity observed for apparent pKa values for histidine residues in enzymatic hydrophobic pockets.44,45 Importantly, GmPOPB is a macrocyclase capable of utilizing the longest peptide substrate described for a POP,37 and the two pKa values observed are close, suggesting that ionizable groups occupy a different environment in comparison to that of porcine POP, which solely hydrolyzes peptide bonds. Explaining pKa shifts in enzyme active sites is not trivial because there can be a contribution from electrostatics, hydrogen bonding, and other processes.45−47 Mutagenesis studies are being performed to determine the role of histidine 698 and other conserved residues in the vicinity of the active site of GmPOPB.
Our steady-state results pointed toward a step other than a bond forming or breaking event as being rate-limiting. The absence of pH dependence on kcat, a large viscosity effect, and a very small or nonexistent solvent kinetic isotope effect are indicative of a rate-limiting binding event. Analysis under pre-steady-state conditions revealed a burst of product formation and a slow dissociation rate constant for one of the products of the reaction (the peptide tail). A simulation performed with Kintek Global Explorer in which the value for the dissociation rate constant for the tail (k5) was varied revealed the effect this rate constant has on steady-state turnover (Figure S7). If the fitted value for k5 (1.44 s–1) was decreased to 0.5 s–1, while all other kinetic parameters remained unchanged (except for k–5 to preserve the experimental Kd value), kcat decreased to 0.074 s–1. This illustrates the dramatic influence that release of the tail peptide has on the turnover rate.
Pre-steady-state experiments establish product release is ordered, with the cyclic peptide departing the enzyme first. Analysis of the goodness of fit of the data to the kinetic sequence proposed here by Fitspace error analysis reveals narrow confidence intervals for the fitted kinetic parameters and well-defined minima in the Fitspace contour plots (Figure 4). Furthermore, there is excellent agreement between measured and calculated turnover numbers based on a rate equation for the proposed kinetic sequence (Table 1 and eq S1).
The single-turnover rate reported here (k2) is in fact a macromolecular rate constant and consequently includes several microscopic steps. Under single-turnover conditions, we saturated the substrate with high concentrations of the enzyme so that the rate measured encompasses steps that start with the enzyme–substrate complex and end with the enzyme–product complex. This includes chemistry (Scheme S2)—formation of the tetrahedral intermediate, formation of the acyl–enzyme intermediate (as for other serine proteases), and decomposition of the acyl–enzyme intermediate by nucleophilic attack by the 25mer N-terminal amine instead of water, unique to macrocyclases—and any conformational changes that accompany these chemical steps. Any one of these or a combination could set a lower limit to the rate (k2) observed here. Steady-state experiments performed with porcine POP suggested that the steps following chemistry could be rate-limiting, but rate constants were not measured for individual steps.48
Close inspection of the energy barriers when the reaction is occurring under initial velocity conditions as opposed to when 50% of the 25mer substrate has been consumed shows that rebinding of the tail sequence contributes significantly to the turnover rate as the reaction progresses and the concentration of the tail increases (Figure 5, bottom). In a simple equilibrium kinetic analysis, the tail was shown to be an inhibitor of the enzyme (Figure S10) supporting this model.
The need to understand an enzymatic process to improve it has been emphasized for reactions that are important in biocatalysis.49 Engineering of the heterocyclase enzyme LynD involved in the formation of thiazolines in cyanobactin biosynthesis reduced the size of the required peptide substrate from >50 amino acids to only 12.50 No macrocyclase enzyme has been engineered to improve or diversify function, although their natural substrate promiscuity has been exploited.14−19,51 This is the first kinetic characterization of a macrocyclase and a necessary step toward designing a better catalyst for macrocyclization.
Acknowledgments
We thank Dr. Rafael Guimaraes da Silva for helpful discussions about enzyme kinetics. We also thank Professor David Lilley, Dr. Alasdair Freeman, and Dr. Anne-Cecile Declais at the University of Dundee for training and usage of their QFM-4000 quenched-flow apparatus.
Glossary
Abbreviations
- POP
prolyl oligopeptidase
- GmPOPB
prolyl oligopeptidase from G. marginata
- PatGmac
macrocyclase domain from Prochloron sp. involved in patellamide biosynthesis
- RiPPs
ribosomally synthesized and posttranslationally modified peptides
- STO
single turnover
- MTO
multiple turnovers
- LC–MS
liquid chromatography–mass spectrometry
- ITC
isothermal titration calorimetry.
Supporting Information Available
The Supporting Information is available free of charge on the ACS Publications website at DOI: 10.1021/acs.biochem.7b00012.
Kinetic parameters obtained fitting each experiment individually, equations used for data fitting, and supporting figures (PDF)
Author Present Address
§ Wellcome Trust Centre for Human Genetics, University of Oxford, Roosevelt Drive, Oxford OX3 7BN and RCaH, Harwell Campus, Oxford OX11 0FA, UK.
This project was funded by European Research Council (339367 NCB-TNT), UK Biotechnology and Biological Sciences Research Council (K015508/1) and by the Royal Society Wolfson Merit Award (J.H.N.).
The authors declare no competing financial interest.
Supplementary Material
References
- Polgar L. (2002) The prolyl oligopeptidase family. Cell. Mol. Life Sci. 59, 349–362. 10.1007/s00018-002-8427-5. [DOI] [PMC free article] [PubMed] [Google Scholar]
- Garcia-Horsman J. A.; Mannisto P. T.; Venalainen J. I. (2007) On the role of prolyl oligopeptidase in health and disease. Neuropeptides 41, 1–24. 10.1016/j.npep.2006.10.004. [DOI] [PubMed] [Google Scholar]
- Luo H.; Hong S. Y.; Sgambelluri R. M.; Angelos E.; Li X.; Walton J. D. (2014) Peptide macrocyclization catalyzed by a prolyl oligopeptidase involved in alpha-amanitin biosynthesis. Chem. Biol. 21, 1610–1617. 10.1016/j.chembiol.2014.10.015. [DOI] [PMC free article] [PubMed] [Google Scholar]
- Hallen H. E.; Luo H.; Scott-Craig J. S.; Walton J. D. (2007) Gene family encoding the major toxins of lethal Amanita mushrooms. Proc. Natl. Acad. Sci. U. S. A. 104, 19097–19101. 10.1073/pnas.0707340104. [DOI] [PMC free article] [PubMed] [Google Scholar]
- Barbato M. P. (1993) Poisoning from accidental ingestion of mushrooms. Med. J. Aust. 158, 842–847. [DOI] [PubMed] [Google Scholar]
- Arnison P. G.; Bibb M. J.; Bierbaum G.; Bowers A. A.; Bugni T. S.; Bulaj G.; Camarero J. A.; Campopiano D. J.; Challis G. L.; Clardy J.; Cotter P. D.; Craik D. J.; Dawson M.; Dittmann E.; Donadio S.; Dorrestein P. C.; Entian K. D.; Fischbach M. A.; Garavelli J. S.; Goransson U.; Gruber C. W.; Haft D. H.; Hemscheidt T. K.; Hertweck C.; Hill C.; Horswill A. R.; Jaspars M.; Kelly W. L.; Klinman J. P.; Kuipers O. P.; Link A. J.; Liu W.; Marahiel M. A.; Mitchell D. A.; Moll G. N.; Moore B. S.; Muller R.; Nair S. K.; Nes I. F.; Norris G. E.; Olivera B. M.; Onaka H.; Patchett M. L.; Piel J.; Reaney M. J.; Rebuffat S.; Ross R. P.; Sahl H. G.; Schmidt E. W.; Selsted M. E.; Severinov K.; Shen B.; Sivonen K.; Smith L.; Stein T.; Sussmuth R. D.; Tagg J. R.; Tang G. L.; Truman A. W.; Vederas J. C.; Walsh C. T.; Walton J. D.; Wenzel S. C.; Willey J. M.; van der Donk W. A. (2013) Ribosomally synthesized and post-translationally modified peptide natural products: overview and recommendations for a universal nomenclature. Nat. Prod. Rep. 30, 108–160. 10.1039/C2NP20085F. [DOI] [PMC free article] [PubMed] [Google Scholar]
- Ortega M. A.; van der Donk W. A. (2016) New Insights into the Biosynthetic Logic of Ribosomally Synthesized and Post-translationally Modified Peptide Natural Products. Cell Chem. Biol. 23, 31–44. 10.1016/j.chembiol.2015.11.012. [DOI] [PMC free article] [PubMed] [Google Scholar]
- Driggers E. M.; Hale S. P.; Lee J.; Terrett N. K. (2008) The exploration of macrocycles for drug discovery-an underexploited structural class. Nat. Rev. Drug Discovery 7, 608–624. 10.1038/nrd2590. [DOI] [PubMed] [Google Scholar]
- Barber C. J.; Pujara P. T.; Reed D. W.; Chiwocha S.; Zhang H.; Covello P. S. (2013) The two-step biosynthesis of cyclic peptides from linear precursors in a member of the plant family Caryophyllaceae involves cyclization by a serine protease-like enzyme. J. Biol. Chem. 288, 12500–12510. 10.1074/jbc.M112.437947. [DOI] [PMC free article] [PubMed] [Google Scholar]
- Nguyen G. K.; Wang S.; Qiu Y.; Hemu X.; Lian Y.; Tam J. P. (2014) Butelase 1 is an Asx-specific ligase enabling peptide macrocyclization and synthesis. Nat. Chem. Biol. 10, 732–738. 10.1038/nchembio.1586. [DOI] [PubMed] [Google Scholar]
- Koehnke J.; Bent A.; Houssen W. E.; Zollman D.; Morawitz F.; Shirran S.; Vendome J.; Nneoyiegbe A. F.; Trembleau L.; Botting C. H.; Smith M. C.; Jaspars M.; Naismith J. H. (2012) The mechanism of patellamide macrocyclization revealed by the characterization of the PatG macrocyclase domain. Nat. Struct. Mol. Biol. 19, 767–772. 10.1038/nsmb.2340. [DOI] [PMC free article] [PubMed] [Google Scholar]
- Harris K. S.; Durek T.; Kaas Q.; Poth A. G.; Gilding E. K.; Conlan B. F.; Saska I.; Daly N. L.; van der Weerden N. L.; Craik D. J.; Anderson M. A. (2015) Efficient backbone cyclization of linear peptides by a recombinant asparaginyl endopeptidase. Nat. Commun. 6, 10199. 10.1038/ncomms10199. [DOI] [PMC free article] [PubMed] [Google Scholar]
- Lee J.; McIntosh J.; Hathaway B. J.; Schmidt E. W. (2009) Using marine natural products to discover a protease that catalyzes peptide macrocyclization of diverse substrates. J. Am. Chem. Soc. 131, 2122–2124. 10.1021/ja8092168. [DOI] [PMC free article] [PubMed] [Google Scholar]
- Oueis E.; Jaspars M.; Westwood N. J.; Naismith J. H. (2016) Enzymatic Macrocyclization of 1,2,3-Triazole Peptide Mimetics. Angew. Chem. 128, 5936–5939. 10.1002/ange.201601564. [DOI] [PMC free article] [PubMed] [Google Scholar]
- Oueis E.; Jaspars M.; Westwood N. J.; Naismith J. H. (2016) Enzymatic Macrocyclization of 1,2,3-Triazole Peptide Mimetics. Angew. Chem., Int. Ed. 55, 5842–5845. 10.1002/anie.201601564. [DOI] [PMC free article] [PubMed] [Google Scholar]
- Sardar D.; Lin Z.; Schmidt E. W. (2015) Modularity of RiPP Enzymes Enables Designed Synthesis of Decorated Peptides. Chem. Biol. 22, 907–916. 10.1016/j.chembiol.2015.06.014. [DOI] [PMC free article] [PubMed] [Google Scholar]
- Tianero M. D.; Pierce E.; Raghuraman S.; Sardar D.; McIntosh J. A.; Heemstra J. R.; Schonrock Z.; Covington B. C.; Maschek J. A.; Cox J. E.; Bachmann B. O.; Olivera B. M.; Ruffner D. E.; Schmidt E. W. (2016) Metabolic model for diversity-generating biosynthesis. Proc. Natl. Acad. Sci. U. S. A. 113, 1772–1777. 10.1073/pnas.1525438113. [DOI] [PMC free article] [PubMed] [Google Scholar]
- Cao Y.; Nguyen G. K.; Chuah S.; Tam J. P.; Liu C. F. (2016) Butelase-Mediated Ligation as an Efficient Bioconjugation Method for the Synthesis of Peptide Dendrimers. Bioconjugate Chem. 27, 2592–2596. 10.1021/acs.bioconjchem.6b00538. [DOI] [PubMed] [Google Scholar]
- Nguyen G. K.; Hemu X.; Quek J. P.; Tam J. P. (2016) Butelase-Mediated Macrocyclization of d-Amino-Acid-Containing Peptides. Angew. Chem., Int. Ed. 55, 12802–12806. 10.1002/anie.201607188. [DOI] [PubMed] [Google Scholar]
- Hemu X.; Qiu Y.; Nguyen G. K.; Tam J. P. (2016) Total Synthesis of Circular Bacteriocins by Butelase 1. J. Am. Chem. Soc. 138, 6968–6971. 10.1021/jacs.6b04310. [DOI] [PubMed] [Google Scholar]
- Nguyen G. K.; Qiu Y.; Cao Y.; Hemu X.; Liu C. F.; Tam J. P. (2016) Butelase-mediated cyclization and ligation of peptides and proteins. Nat. Protoc. 11, 1977–1988. 10.1038/nprot.2016.118. [DOI] [PubMed] [Google Scholar]
- Pace C. N.; Vajdos F.; Fee L.; Grimsley G.; Gray T. (1995) How to measure and predict the molar absorption coefficient of a protein. Protein Sci. 4, 2411–2423. 10.1002/pro.5560041120. [DOI] [PMC free article] [PubMed] [Google Scholar]
- Oke M.; Carter L. G.; Johnson K. A.; Liu H.; McMahon S. A.; Yan X.; Kerou M.; Weikart N. D.; Kadi N.; Sheikh M. A.; Schmelz S.; Dorward M.; Zawadzki M.; Cozens C.; Falconer H.; Powers H.; Overton I. M.; van Niekerk C. A.; Peng X.; Patel P.; Garrett R. A.; Prangishvili D.; Botting C. H.; Coote P. J.; Dryden D. T.; Barton G. J.; Schwarz-Linek U.; Challis G. L.; Taylor G. L.; White M. F.; Naismith J. H. (2010) The Scottish Structural Proteomics Facility: targets, methods and outputs. J. Struct. Funct. Genomics 11, 167–180. 10.1007/s10969-010-9090-y. [DOI] [PMC free article] [PubMed] [Google Scholar]
- Liu H.; Naismith J. H. (2008) An efficient one-step site-directed deletion, insertion, single and multiple-site plasmid mutagenesis protocol. BMC Biotechnol. 8, 91. 10.1186/1472-6750-8-91. [DOI] [PMC free article] [PubMed] [Google Scholar]
- Cook P. F., and Cleland W. W. (2007) Enzyme Kinetics and Mechanism, Garland Science, London. [Google Scholar]
- Karsten W. E.; Lai C.; Cook P. F. (1995) Inverse Solvent Isotope Effects in the NAD-Malic Enzyme Reaction Are the Result of the Viscosity Difference between D20 and H20: Implications for Solvent Isotope Effect Studies. J. Am. Chem. Soc. 117, 5914–5918. 10.1021/ja00127a002. [DOI] [Google Scholar]
- Glasoe P. K.; Long F. A. (1960) Use of glass electrodes to measure acidities in deuterium oxide. J. Phys. Chem. 64, 188–190. 10.1021/j100830a521. [DOI] [Google Scholar]
- Johnson K. A.; Simpson Z. B.; Blom T. (2009) Global kinetic explorer: a new computer program for dynamic simulation and fitting of kinetic data. Anal. Biochem. 387, 20–29. 10.1016/j.ab.2008.12.024. [DOI] [PubMed] [Google Scholar]
- Johnson K. A.; Simpson Z. B.; Blom T. (2009) FitSpace explorer: an algorithm to evaluate multidimensional parameter space in fitting kinetic data. Anal. Biochem. 387, 30–41. 10.1016/j.ab.2008.12.025. [DOI] [PubMed] [Google Scholar]
- Hiromi K. (1979) Kinetics of fast enzyme reactions: Theory and practice, Halstead Press, New York. [Google Scholar]
- Johnson K. A. (2009) Fitting enzyme kinetic data with KinTek Global Kinetic Explorer. Methods Enzymol. 467, 601–626. 10.1016/S0076-6879(09)67023-3. [DOI] [PubMed] [Google Scholar]
- Harris M. N.; Madura J. D.; Ming L. J.; Harwood V. J. (2001) Kinetic and mechanistic studies of prolyl oligopeptidase from the hyperthermophile Pyrococcus furiosus. J. Biol. Chem. 276, 19310–19317. 10.1074/jbc.M010489200. [DOI] [PubMed] [Google Scholar]
- Szeltner Z.; Rea D.; Renner V.; Juliano L.; Fulop V.; Polgar L. (2003) Electrostatic environment at the active site of prolyl oligopeptidase is highly influential during substrate binding. J. Biol. Chem. 278, 48786–48793. 10.1074/jbc.M309555200. [DOI] [PubMed] [Google Scholar]
- Powers J. C.; Asgian J. L.; Ekici O. D.; James K. E. (2002) Irreversible inhibitors of serine, cysteine, and threonine proteases. Chem. Rev. 102, 4639–4750. 10.1021/cr010182v. [DOI] [PubMed] [Google Scholar]
- Schowen K. B.; Schowen R. L. (1982) Solvent isotope effects of enzyme systems. Methods Enzymol. 87, 551–606. 10.1016/S0076-6879(82)87031-6. [DOI] [PubMed] [Google Scholar]
- Jacob M.; Schmid F. X. (1999) Protein folding as a diffusional process. Biochemistry 38, 13773–13779. 10.1021/bi991503o. [DOI] [PubMed] [Google Scholar]
- Szeltner Z.; Polgar L. (2008) Structure, function and biological relevance of prolyl oligopeptidase. Curr. Protein Pept. Sci. 9, 96–107. 10.2174/138920308783565723. [DOI] [PubMed] [Google Scholar]
- Polgar L. (1991) pH-dependent mechanism in the catalysis of prolyl endopeptidase from pig muscle. Eur. J. Biochem. 197, 441–447. 10.1111/j.1432-1033.1991.tb15930.x. [DOI] [PubMed] [Google Scholar]
- Szeltner Z.; Rea D.; Juhasz T.; Renner V.; Mucsi Z.; Orosz G.; Fulop V.; Polgar L. (2002) Substrate-dependent competency of the catalytic triad of prolyl oligopeptidase. J. Biol. Chem. 277, 44597–44605. 10.1074/jbc.M207386200. [DOI] [PubMed] [Google Scholar]
- Kahyaoglu A.; Haghjoo K.; Guo F.; Jordan F.; Kettner C.; Felfoldi F.; Polgar L. (1997) Low barrier hydrogen bond is absent in the catalytic triads in the ground state but Is present in a transition-state complex in the prolyl oligopeptidase family of serine proteases. J. Biol. Chem. 272, 25547–25554. 10.1074/jbc.272.41.25547. [DOI] [PubMed] [Google Scholar]
- Fulop V.; Szeltner Z.; Renner V.; Polgar L. (2001) Structures of prolyl oligopeptidase substrate/inhibitor complexes. Use of inhibitor binding for titration of the catalytic histidine residue. J. Biol. Chem. 276, 1262–1266. 10.1074/jbc.M007003200. [DOI] [PubMed] [Google Scholar]
- Hedstrom L. (2002) Serine protease mechanism and specificity. Chem. Rev. 102, 4501–4524. 10.1021/cr000033x. [DOI] [PubMed] [Google Scholar]
- Szeltner Z.; Renner V.; Polgar L. (2000) The noncatalytic beta-propeller domain of prolyl oligopeptidase enhances the catalytic capability of the peptidase domain. J. Biol. Chem. 275, 15000–15005. 10.1074/jbc.M000942200. [DOI] [PubMed] [Google Scholar]
- Grimsley G. R.; Scholtz J. M.; Pace C. N. (2009) A summary of the measured pK values of the ionizable groups in folded proteins. Protein Sci. 18, 247–251. 10.1002/pro.19. [DOI] [PMC free article] [PubMed] [Google Scholar]
- Harris T. K.; Turner G. J. (2002) Structural basis of perturbed pKa values of catalytic groups in enzyme active sites. IUBMB Life 53, 85–98. 10.1080/15216540211468. [DOI] [PubMed] [Google Scholar]
- Schubert M.; Poon D. K.; Wicki J.; Tarling C. A.; Kwan E. M.; Nielsen J. E.; Withers S. G.; McIntosh L. P. (2007) Probing electrostatic interactions along the reaction pathway of a glycoside hydrolase: histidine characterization by NMR spectroscopy. Biochemistry 46, 7383–7395. 10.1021/bi700249m. [DOI] [PubMed] [Google Scholar]
- Kahyaoglu A.; Jordan F. (2002) Direct proton magnetic resonance determination of the pKa of the active center histidine in thiolsubtilisin. Protein Sci. 11, 965–973. 10.1110/ps.3890102. [DOI] [PMC free article] [PubMed] [Google Scholar]
- Polgar L. (1992) Prolyl endopeptidase catalysis. A physical rather than a chemical step is rate-limiting. Biochem. J. 283 (Part 3), 647–648. 10.1042/bj2830647. [DOI] [PMC free article] [PubMed] [Google Scholar]
- Ringborg R. H.; Woodley J. M. (2016) The application of reaction engineering to biocatalysis. Reaction Chemistry & Engineering 1, 10–22. 10.1039/C5RE00045A. [DOI] [Google Scholar]
- Koehnke J.; Mann G.; Bent A. F.; Ludewig H.; Shirran S.; Botting C.; Lebl T.; Houssen W. E.; Jaspars M.; Naismith J. H. (2015) Structural analysis of leader peptide binding enables leader-free cyanobactin processing. Nat. Chem. Biol. 11, 558–563. 10.1038/nchembio.1841. [DOI] [PMC free article] [PubMed] [Google Scholar]
- Cao Y.; Nguyen G. K.; Tam J. P.; Liu C. F. (2015) Butelase-mediated synthesis of protein thioesters and its application for tandem chemoenzymatic ligation. Chem. Commun. (Cambridge, U. K.) 51, 17289–17292. 10.1039/C5CC07227A. [DOI] [PubMed] [Google Scholar]
Associated Data
This section collects any data citations, data availability statements, or supplementary materials included in this article.