Abstract
Histone deacetylase (HDAC) inhibitors can induce programmed cell death in cancer cells, although the underlying mechanism is obscure. In this study, we show that two distinct HDAC inhibitors, butyrate and suberoylanilide hydroxamic acid (SAHA), induced caspase-3 activation and cell death in multiple human cancer cell lines. The activation of caspase-3 was via the mitochondria/cytochrome c-mediated apoptotic pathway because it was abrogated in mouse embryonic fibroblasts with knockout of Apaf-1, the essential mediator of the pathway. Overexpression of Bcl-XL in HeLa cells also blocked caspase activation by the HDAC inhibitors. Nevertheless, Apaf-1 knockout, overexpression of Bcl-XL, and pharmacological inhibition of caspase activity did not prevent SAHA and butyrate-induced cell death. The cells undergoing such caspase-independent death had unambiguous morphological features of autophagic cell death. Therefore, HDAC inhibitors can induce both mitochondria-mediated apoptosis and caspase-independent autophagic cell death. Induction of autophagic cell death by HDAC inhibitors has clear clinical implications in treating cancers with apoptotic defects.
Keywords: apoptosis, chemotherapy
Cancer cells evade programmed cell death to support malignant growth. Thus, understanding the mechanisms of programmed cell death and designing therapeutic approaches to trigger cell death in cancer cells are critical for treating the disease (1, 2). There are two major morphologically distinctive forms of programmed cell death, apoptosis and autophagic cell death.
Apoptotic cell death is executed by a family of cysteine proteases, caspases (3). There are two well characterized mammalian caspase activation pathways, the death receptor pathway and the mitochondria/cytochrome c-mediated pathway. In the death receptor pathway, binding of agonists to members of the TNF/nerve growth factor receptor superfamily can induce activation of the initiating caspase, caspase-8, which in turn activates the effector caspase, caspase-3 (4, 5). In the cytochrome c-mediated pathway, diverse stimuli converge at mitochondria and cause cytochrome c release to cytoplasm, an event regulated by the Bcl-2 family of proteins (6–8). Released cytochrome c induces the key mediator Apaf-1 to form a multimeric protein complex, the apoptosome. The apoptosome activates caspase-9, which subsequently activates the downstream executioner caspases (9, 10).
Both the death receptor and the cytochrome c-mediated apoptotic pathways are drug targets for cancer treatment. For example, targeting a member of the TNF receptor family, Apo2, by its ligand Apo2L/TNF-related apoptosis-inducing ligand, can induce cell death in cancers without significant toxicity to normal cells (11). The cytochrome c pathway can be activated by many conventional cancer therapeutic approaches, including radiation therapy and all genotoxic-based chemotherapies (2).
Autophagic cell death is another important physiological cell death process. This mode of cell death is characterized by massive degradation of cellular contents, including essential organelles such as mitochondria, by means of complicated intracellular membrane/vesicle reorganization and lysosomal activity (12–16). It is involved in development and stress responses and has been observed in multiple neurodegenerative diseases (12–16). Because the mechanism is not well defined, some autophagic cell death events might have been attributed to apoptosis. Moreover, these two modes of cell death frequently occur in parallel. For example, gene profiling of Drosophila cells undergoing steroid-induced developmental cell death identified clustered up-regulation of several apoptosis-related genes with autophagy-related genes (17, 18); deprivation of neural growth factor induced simultaneous autophagic and apoptotic cell death in primary sympathetic neurons (19). However, caspases are not required for autophagic cell death (12–16), and Bcl-2 and Bcl-XL do not inhibit autophagic cell death in a mammary epithelial morphogenesis model (20). Furthermore, like apoptosis, autophagic cell death is involved in tumorigenesis: autophagic activity was found to be suppressed in malignant tumors (16); some autophagic regulators, such as Beclin 1 (21–24) and death-associated protein kinase (25–28), are putative tumor suppressors. Currently, there is no cancer therapeutic approach that specifically targets the autophagic cell death machine.
It has been reported that histone deacetylase (HDAC) inhibitors preferentially kill transformed cells or cancer cells in both cell cultures and animal models (29). These compounds also induce cell growth arrest and differentiation. Such properties make them good candidates for targeted therapies. According to their chemical structures, HDAC inhibitors can be classified into several groups, including (i) short-chain fatty acids, such as sodium butyrate; (ii) hydroxamic acids, such as suberoylanilide hydroxamic acid (SAHA) (30); and (iii) cyclic tetrapeptides, such as trapoxin.
HDAC inhibitors can increase acetylation of histones and various other proteins. HDAC, along with their counterparts, histone acetyl transferases, regulate the status of histone acetylation and thus are involved in transcriptional regulation and cell differentiation (31, 32). Because HDAC are overexpressed in many cancers, and the death-inducing capability of different HDAC inhibitors correlates with their HDAC-inhibitory potency, it is widely accepted that the cell death-inducing function of HDAC inhibitors is due to their ability to inhibit HDAC activity (29, 33).
However, the mechanisms by which HDAC inhibitors induce cell death are not well understood. In this report, we used genetically engineered cell lines to dissect the molecular determinants of cell death induced by butyrate and SAHA, two HDAC inhibitors from different structural classes. We found that HDAC inhibitors induced both apoptosis via the cytochrome c-mediated caspase activation pathway and caspase-independent autophagic cell death. Induction of two modes of programmed cell death by HDAC inhibitors indicates that these drugs might be particularly valuable when treating cancers with apoptotic defects.
Materials and Methods
Chemicals and Cell Lines. SAHA was obtained from Aton Pharma (Tarrytown, NY). Sodium butyrate was from Sigma. N-benzyloxycarbonyl-Val-Ala-Asp-fluoromethylketone (Z-VAD-FMK) and caspase-3 fluorogenic substrate were from Calbiochem. Antibodies against cytochrome c, Bcl-XL, and β-tubulin were from BD Biosciences. Apaf-1-knockout and wild-type mouse embryonic fibroblasts were from T. Mak (University of Toronto, Toronto) (34). HeLa cell lines with Bcl-XL or vector alone stably transfected were from M. Fang and X. Wang (University of Texas Southwestern Medical Center, Dallas) (35). Normal HeLa cells were from American Type Culture Collection. Cells were cultured in DMEM supplemented with 10% FBS at 37°C with 5% CO2. Upon treatment, the culture medium was replaced with fresh medium containing indicated concentrations of butyrate or SAHA.
Subcellular Fractionation. At the indicated time points after treatment, culture dishes were scraped to detach cells, and cells were collected by centrifugation at 2,000 × g for 10 min at 4°C, washed once with PBS, and pelleted again. Cell pellets were then suspended in a 5× volume of buffer A (20 mM Hepes/10 mM KCl/1.5 mM MgCl2/1 mM EDTA/1 mM EGTA/1 mM DTT) supplemented with mixture proteases inhibitors (Roche Diagnostics) and 250 mM sucrose. After incubating on ice for 15 min, the cells were broken by passing through 22-gauge needles 25 times. The resulting cell lysates were subjected to sequential centrifugation at 1,000 × g and 12,000 × g, each for 10 min at 4°C, to pellet nuclei and heavy membranes. The supernatants were then centrifuged at 10,000 × g for 30 min at 4°C to pellet light membranes. The resulting supernatants were the cytosolic fractions.
Measurement of Caspase-3 Activity. Fifteen micrograms of cytosolic proteins from individual samples was incubated with 15 μM fluorogenic Asp-Glu-Val-Asp (DEVD) substrate (Calbiochem) in 20 μl of buffer A in a 384-well microplate. Generation of fluorescent signal (relative fluorescent units/min), indicative of caspase-3 activity, was measured by using an automated spectrophotometer at 30°C. Three independent experiments were performed to determine standard deviation.
Measurement of Apoptosis. After treatment, cells were harvested (adherent cells were detached from culture plates by trypsinization and combined with floating cells), pelleted by centrifugation, and suspended in PBS. Cell densities were counted by using a hemacytometer. Subsequently, 1 × 10⁶ cells were incubated with Hoechst dye 33342 as instructed (Roche Diagnostics), and apoptosis was measured by flow cytometry. Three independent experiments were performed to determine standard deviation.
Transmission Electron Microscopy. Cells were harvested, pelleted, and fixed in 2.5% glutaraldehyde/2% paraformaldehyde in cacodylate buffer. After rinse with cacodylate buffer, the samples were postfixed in 2% osmium tetroxide for 1 h. The samples were then rinsed with water, followed by dehydration in a graded series of alcohol (50%, 75%, and 95–100% alcohol) followed by propylene oxide, and kept overnight in 1:1 propylene oxide/poly Bed 812. The samples were embedded in Poly Bed 812 and cured in a 60°C oven. Ultrathin sections were obtained with a Reichert Ultracut S microtome. Sections were stained with uranyl acetate and lead citrate and photographed by using a Jeol 1200 EX 11 transmission electron microscope.
Results
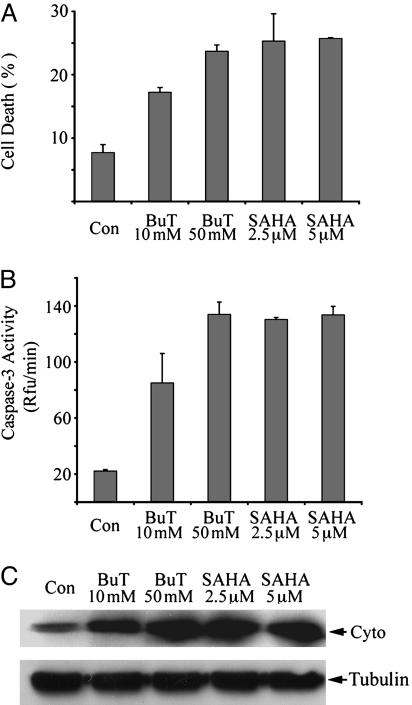
HDAC Inhibitors Induced Caspase Activation and Apoptosis in HeLa Cells. We chose two structurally different HDAC inhibitors, sodium butyrate and SAHA, to study the mechanisms by which HDAC inhibitors initiate cell death. In HeLa cells, after treatment with both HDAC inhibitors with effective concentrations for inhibition of HDAC activity (millimolar-level for butyrate and micromolar-level for SAHA), massive cell death was observed in 2 days. The cell death could be detected by using Hoechst staining, which detects chromosomal condensation, a hallmark of apoptosis. After Hoechst staining, cell death was quantitated by flow cytometry (Fig. 1A). In butyrate- and SAHA-treated cells, caspase-3 was potently activated (Fig. 1B). HDAC inhibitors also caused DNA fragmentation in HeLa cells (data not shown). Therefore, butyrate and SAHA induced apoptosis in HeLa cells. These results are consistent with previous reports that HDAC inhibitors induce apoptosis with activation of caspases (36–38). We also found that butyrate and SAHA induced caspase activation and cell death in many other human cancer cell lines, including chemoresistant ovarian cancer cell line SKOV-3 and glioblastoma cell line U251 (data not shown).
Fig. 1.
Butyrate and SAHA induced apoptosis, caspase-3 activation, and cytochrome c release in HeLa cells. HeLa cells were harvested after 2 days of treatment with indicated concentrations of butyrate or SAHA. (A) Cell death was measured by Hoechst dye 33342 staining followed by flow cytometry as described. BuT, butyrate; Con, control. (B) Cytosolic proteins of each sample were assayed for caspase-3 activity as described. (C) Cytosolic proteins (40 μg) were subjected to immunoblotting against cytochrome c (Cyto). Immunoblotting against β-tubulin was performed as the loading control.
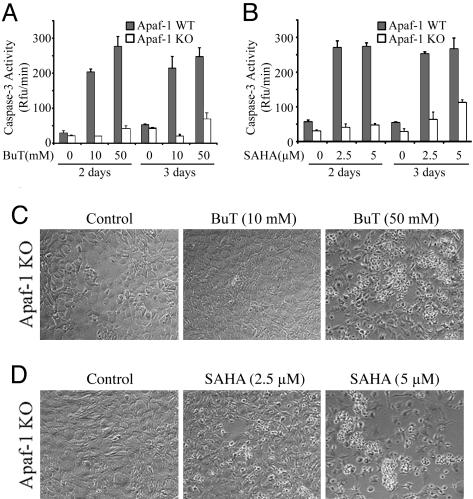
The Cytochrome c Pathway Is Required for HDAC Inhibitor-Induced Caspase Activation But Not Cell Death. To address whether HDAC inhibitors induce caspase activation and apoptosis via the cytochrome c pathway in HeLa cells, release of cytochrome c from mitochondria was analyzed. Immunoblot analysis showed that, in the cytosolic fractions free of mitochondria, cytochrome c levels were much higher if cells were treated with butyrate or SAHA (Fig. 1C). However, cytochrome c release can be either cause or consequence of caspase activation. For example, when caspase-8 and caspase-3 are activated through the death receptor pathway, the activated caspases can cleave the pro-death Bcl-2 member, Bid, which then causes cytochrome c release (39, 40). To test whether cytochrome c release is the consequence or the cause of caspase activation initiated by HDAC inhibitors, we performed experiments using transformed wild-type and Apaf-1-knockout mouse embryonic fibroblasts (MEFs) (34). Targeted deletion of Apaf-1, the direct target of cytochrome c, disrupted cytochrome c-mediated caspase activation, and the knockout MEFs are resistant to a variety of apoptotic stimuli, including UV irradiation and genotoxic reagents (34). After treatment with SAHA and butyrate for 2 and 3 days, caspase-3 was not activated in the knockout MEFs, except a slight increase after 3 days of treatment with higher doses of butyrate and SAHA (Fig. 2 A and B). As a control, in wild-type MEFs, caspase-3 was potently activated with lower doses of compounds after 2 days of treatment (Fig. 2 A and B). Apoptosis was also highly induced in the wild-type MEFs as measured by Hoechst staining (data not shown). Thus, HDAC inhibitor-initiated caspase activation is mediated by Apaf-1 and the cytochrome c pathway.
Fig. 2.
Apaf-1 is required for butyrate and SAHA-induced caspase-3 activation but not cell death. Apaf-1 wild-type (WT, filled bars) and knockout (KO, open bars) MEFs were harvested after the treatment with butyrate (A) or SAHA (B) for 2 days or 3 days, and caspase-3 activation was measured as described. Cell death of the KO cells was documented by light microscopy after treatment of butyrate (C) or SAHA (D) with indicated concentrations.
Surprisingly, 3 days after treatment with the HDAC inhibitors, cell death was apparently observed in the Apaf-1-knockout cells (Fig. 2 C and D). The death levels were dose- and time-dependent. At day 2, modest cell death was observed in the knockout cells treated with high concentrations of SAHA (5 μM) but not butyrate or low concentrations of SAHA (data not shown). At day 3, more dramatic cell death was observed in the knockout MEFs treated with 5 μM SAHA, and 2.5 μM SAHA also induced modest cell death. At day 3, 50 mM but not 10 mM butyrate also caused clear cell death (Fig. 2C). Therefore, HDAC inhibitors can cause both mitochondria/cytochrome c-mediated apoptosis and Apaf-1-independent cell death.
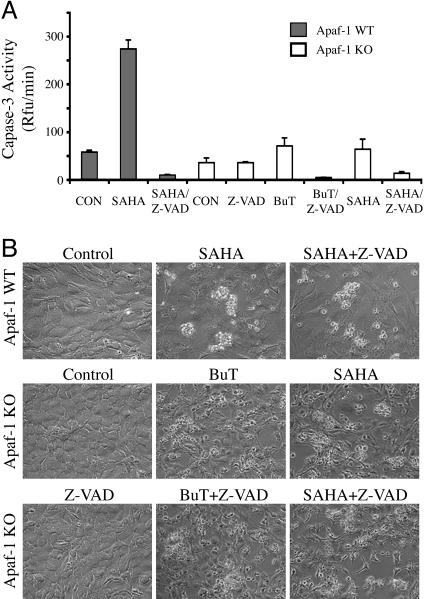
Caspase-Independent Cell Death Induced by HDAC Inhibitors. Caspase activity might not be required for the Apaf-1-independent cell death induced by butyrate and SAHA, or the residual caspase activation observed in Fig. 2 might be essential. To distinguish these two possibilities, we used a high concentration (40 μM) of Z-VAD-FMK, a potent cell-permeable caspase inhibitor. Z-VAD-FMK completely blocked SAHA-induced caspase activation in the wild-type MEFs, indicating the effectiveness of the inhibitor (Fig. 3A). However, the caspase inhibitor did not block the cell death induced by SAHA or butyrate in either wild-type or Apaf-1-knockout MEFs (Fig. 3B). Thus, caspase activation is not required in the Apaf-1-independent cell death induced by HDAC inhibitors.
Fig. 3.
Butyrate and SAHA induced caspase-independent cell death. (A) Apaf-1 wild-type (WT, filled bars) and knockout MEFs (KO, open bars) were treated with 5 μM SAHA or 50 mM butyrate in the presence or absence of 40 μM Z-VAD-FMK (Z-VAD), as indicated. After treatment (2 days for the WT cells and 3 days for the KO cells), the cells were harvested for measurement of caspase-3 activity. (B) Microscopic pictures of the treated cells showing cell death.
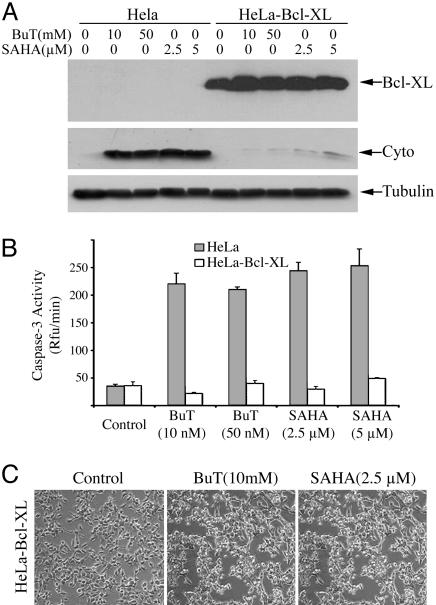
Overexpression of Bcl-XL Blocked Cytochrome c Release and Caspase Activation but Not HDAC Inhibitor-Induced Cell Death. To further confirm that butyrate and SAHA can induce programmed cell death independent of cytochrome c-mediated caspase activation, we tested the effect of these two compounds on a HeLa cell line stably transfected with Bcl-XL. This cell line is resistant to genotoxic-induced apoptosis (35). Overexpression of Bcl-XL blocked HDAC inhibitor-triggered cytochrome c release, compared with cells stably transfected with vector alone (Fig. 4A). As expected, it also inhibited butyrate/SAHA-induced caspase activation (Fig. 4B). This result further confirms that HDAC inhibitor-induced caspase activation occurs solely via the cytochrome c pathway. However, the cell death induced by SAHA and butyrate was not blocked by overexpression of Bcl-XL (Fig. 4C).
Fig. 4.
Overexpression of Bcl-XL blocked butyrate- and SAHA-induced cytochrome c release and caspase-3 activation, but not cell death. HeLa cell lines stably transfected with Bcl-XL (HeLa-Bcl-XL) or vector alone (HeLa) were treated for 2 days with various concentrations of butyrate or SAHA as indicated. (A) Cells were harvested, and cytosolic proteins (40 μg) were subjected to immunoblotting to detect Bcl-XL, cytochrome c, and β-tubulin. (B) Caspase-3 activity was measured after treatment (filled bars, control HeLa cells; open bars, Bcl-XL-overexpressing cells). (C) Two days after treatment with 10 mM butyrate or 2.5 μM SAHA, death of the Bcl-XL-overexpressing HeLa cells was documented by light microscopy.
HDAC Inhibitors Can Induce Autophagic Cell Death Independent of Caspase Activation. The uniqueness of the caspase-independent cell death induced by butyrate and SAHA prompted us to examine its morphology closely. Although dying cells to some degree resembled apoptotic cells, such as formation of membrane blebs, they could not be measured by methods detecting other classic parameters of apoptosis, such as chromosomal condensation or DNA fragmentation (data not shown). On the other hand, dying cells became rounded, detached from culture plates, and appeared to have more cytoplasmic vacuoles, all features suggesting autophagic cell death.
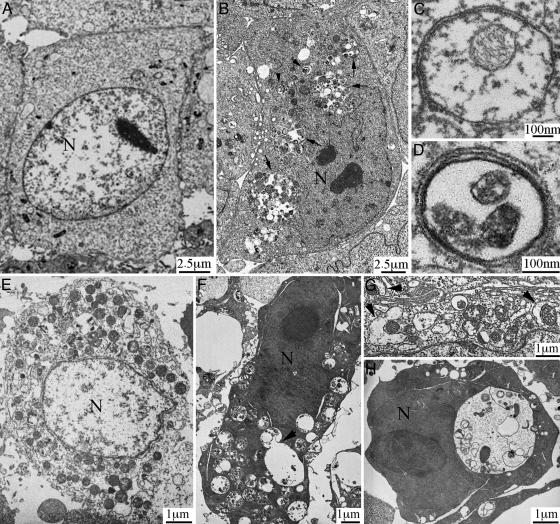
To date, the most convincing and standard method to detect autophagy is to examine the ultrastructure of cells by transmission electron microscopy (16). Therefore, we applied such “gold standard” to examine the ultrastructural morphology of Apaf-1-knockout cells and Bcl-XL-overexpressing HeLa cells after SAHA or butyrate treatment for various times. The morphological characteristics demonstrated that SAHA induced autophagic cell death in these cells. Fig. 5 A–D shows the typical autophagic features of Apaf-1-knockout MEFs after treatment with 5 μM SAHA for 36 h. Whereas untreated cells had normal nuclear and cytoplasmic morphology (Fig. 5A), >60% of treated cells (≈200 examined) developed typical autophagic morphology. In summary (Fig. 5B), nuclei were distorted, many small vesicles (arrowheads) and huge vacuoles (arrows) appeared in the cytoplasm, and these membrane compartments contained multiple cellular organelles. Higher magnification showed that most membrane vesicles possessed double or multiple membrane boundaries, with mitochondria and/or other cellular organelles inside (Fig. 5 C and D). These morphological features clearly reflect the classical autophagic characteristics (12–16); therefore, the observed double/multiple-membrane vesicles were autophagosomes, and the larger vacuoles were the autophagic vacuoles. Fig. 5 E and F shows examples of HeLa cells overexpressing Bcl-XL, without and with SAHA treatment, respectively. Furthermore, our analysis of SAHA/butyrate-induced autophagic cell death revealed a dynamic process. For example, we observed the autophagic induction stage, in which small double membrane structures form and approach toward mitochondria (Fig. 5G, arrowheads). We also saw docking and fusion of autophagosomes with autophagic vacuoles (Fig. 5F, arrowhead). Furthermore, in some cells, large autophagic vacuoles occupied the major cellular space, and most mitochondria have already been degraded (Fig. 5H). Such massive degradation of essential cellular structures is probably the point of no return for autophagic cell death.
Fig. 5.
HDAC inhibitors induced caspase-independent, autophagic cell death. (A–D) Apaf-1-knockout MEFs were treated without (A) or with (B–D) 5 μM SAHA for 36 h, and transmission electron microscopic study was conducted as described. Nuclei were labeled N. Autophagic structures, autophagosome (arrowheads) and autophagic vacuoles (arrows), were detected in SAHA-treated cells. C and D are pictures with higher magnification showing detailed autophagosome structure. (E and F) Bcl-XL-overexpressing HeLa cells, without (E) or with (F) treatment with 5 μM SAHA for 2 days. The arrowhead in F shows an autophagosome fusing with an autophagic vacuole. (G) Arrowheads show double membrane structures approaching mitochondria (from a SAHA-treated Apaf-1-knockout MEF cell). (H) A SAHA-treated, Bcl-XL-overexpressing HeLa cell, containing a single large autophagic vacuole and very few mitochondria.
Discussion
HDAC inhibitors can induce programmed cell death preferentially in transformed cells, making them promising cancer chemotherapeutic agents (29). Butyrate, a short fatty-acid HDAC inhibitor is an approved anticancer medicine; SAHA (30), a hydroxamic acid HDAC inhibitor with much higher potency, requires clinical trials (41). In this report, we examined the biochemical mechanisms of programmed cell death induced by butyrate and SAHA. We found that these two compounds exerted essentially the same death mechanisms. Butyrate and SAHA induced caspase-3 activation and apoptosis through the mitochondria/cytochrome c-mediated apoptotic pathway, and caspase activation could be blocked by deletion of Apaf-1, the caspase inhibitor Z-VAD-FMK, and overexpression of Bcl-XL. However, abrogation of caspase activation did not prevent cells from death (Figs. 2, 3, 4). The inefficiency of Bcl-XL in inhibiting cell death (Fig. 4) also suggests that the caspase-independent cell death was not caused by endonuclease G (42, 43) and apoptosis-inducing factor (44), two other mitochondrial proapoptotic proteins that can coordinately degrade chromosomal DNA independent of caspase activity (45). By conducting the ultrastructural study using transmission electron microscopy, we demonstrated that the HDAC inhibitor-induced, caspase-independent cell death is autophagic cell death (Fig. 5).
Our finding that HDAC inhibitors can induce both caspase-dependent apoptosis and caspase-independent autophagic cell death has clear therapeutic implications. It has been documented that most, if not all, radiation- and chemotherapy-resistant cancers have apoptotic defects (1, 2). In particular, the mitochondria/cytochrome c pathway mediates apoptosis induced by radiation therapy and all genotoxic-based chemotherapies, and it is frequently deregulated in human cancer tissues. For example, Apaf-1 expression is severely attenuated in many malignant melanomas (46), and antiapoptotic members of the Bcl-2 family are up-regulated in a variety of human cancers (6–8). Our work shows that even when Apaf-1 gene is deleted (Fig. 2) or Bcl-XL is overexpressed (Fig. 4), butyrate and SAHA can still trigger caspase-independent autophagic cell death, indicating the potential advantage of HDAC inhibitors in treating cancers with apoptotic defects.
Induction of two modes of cell death by HDAC inhibitors could also reconcile some controversies in previous reports. It has been reported that caspase activity was required for HDAC inhibitor-potentiated cell death (36–38). However, it has also been reported that caspase inhibition could not block HDAC inhibitor-induced cell death (47, 48), which is consistent with our observation. On the other hand, contradictory to our results, it was reported that Bcl-2 and Bcl-XL could prevent HDAC inhibitor-induced cell death (37, 48). We reason that these discrepancies might arise from the fact that HDAC inhibitors can induce both apoptotic and autophagic cell death. Therefore, the methods used for cell death analysis might have a direct impact on interpretation of results. For example, we found that methods specific for apoptosis, such as TUNEL staining (detecting DNA fragmentation) and Hoechst staining (detecting chromosomal condensation), could not score cells dying by autophagy (data not shown), whereas methods that detect loss of plasma membrane integrity, such as trypan blue staining, are very subjective and cannot distinguish necrosis, late-stage apoptosis, or late-stage autophagic cell death. Thus, it is important to develop methods that can accurately measure different mechanisms of cell death, especially autophagic cell death.
Because of the lack of methods for measuring autophagic cell death specifically and quantitatively, the mechanistic study of autophagic cell death has been difficult. Lack of appropriate tools to induce autophagic cell death is another major obstacle. Currently, nutrient deprivation is the only widely used method to induce autophagy in mammalian cells. We suggest that the capability of HDAC inhibitors in initiating autophagic cell death makes them not only promising therapeutic agents in treating cancers with apoptotic defects, but also useful pharmacological tools for studying the fundamental biology of mammalian autophagic cell death, which is now emerging as an important and exciting field.
Acknowledgments
We thank Dr. T. Mak for Apaf-1-knockout MEF cells, Drs. X. Wang and M. Fang for HeLa-Bcl-XL cell lines, Dr. W. Pao for critical reading, Dr. P.J. Hendrikx for assistance on flow cytometry, and N. Lampen for assistance on electron microscopy. These studies were supported, in part, by National Cancer Institute Grant CA-0974823, the David H. Koch Prostate Cancer Research Award, the Susan and Jack Rudin Foundation, and the Robert J. and Helen C. Kleberg Foundation. Y.S. is a Tiffany Townsend Daniels/American Brain Tumor Association fellow. X.J. is an Alfred W. Bressler Scholar and a V Scholar.
Author contributions: Y.S., P.A.M., and X.J. designed research; Y.S., Z.G., and X.J. performed research; Y.S., Z.G., P.A.M., and X.J. analyzed data; and Y.S., P.A.M., and X.J. wrote the paper.
Abbreviations: HDAC, histone deacetylase; SAHA, suberoylanilide hydroxamic acid; Z-VAD-FMK, N-benzyloxycarbonyl-Val-Ala-Asp-fluoromethylketone; MEF, mouse embryonic fibroblast.
References
- 1.Hanahan, D. & Weinberg, R. A. (2000) Cell 100, 57–70. [DOI] [PubMed] [Google Scholar]
- 2.Johnstone, R. W., Ruefli, A. A. & Lowe, S. W. (2002) Cell 108, 153–164. [DOI] [PubMed] [Google Scholar]
- 3.Thornberry, N. A. & Lazebnik, Y. (1998) Science 281, 1312–1316. [DOI] [PubMed] [Google Scholar]
- 4.Ashkenazi, A. & Dixit, V. M. (1998) Science 281, 1305–1308. [DOI] [PubMed] [Google Scholar]
- 5.Peter, M. E. & Krammer, P. H. (2003) Cell Death Differ. 10, 26–35. [DOI] [PubMed] [Google Scholar]
- 6.Chao, D. T. & Korsmeyer, S. J. (1998) Annu. Rev. Immunol. 16, 395–419. [DOI] [PubMed] [Google Scholar]
- 7.Harris, M. H. & Thompson, C. B. (2000) Cell Death Differ. 7, 1182–1191. [DOI] [PubMed] [Google Scholar]
- 8.Adams, J. M. & Cory, S. (2001) Trends Biochem. Sci. 26, 61–66. [DOI] [PubMed] [Google Scholar]
- 9.Budihardjo, I., Oliver, H., Lutter, M., Luo, X. & Wang, X. (1999) Annu. Rev. Cell Dev. Biol. 15, 269–290. [DOI] [PubMed] [Google Scholar]
- 10.Jiang, X. & Wang, X. (2004) Annu. Rev. Biochem. 73, 87–106. [DOI] [PubMed] [Google Scholar]
- 11.Ashkenazi, A., Pai, R. C., Fong, S., Leung, S., Lawrence, D. A., Marsters, S. A., Blackie, C., Chang, L., McMurtrey, A. E., Hebert, A., et al. (1999) J. Clin. Invest. 104, 155–162. [DOI] [PMC free article] [PubMed] [Google Scholar]
- 12.Klionsky, D. J. & Emr, S. D. (2000) Science 290, 1717–1721. [DOI] [PMC free article] [PubMed] [Google Scholar]
- 13.Bursch, W. (2001) Cell Death Differ. 8, 569–581. [DOI] [PubMed] [Google Scholar]
- 14.Stromhaug, P. E. & Klionsky, D. J. (2001) Traffic 2, 524–531. [DOI] [PubMed] [Google Scholar]
- 15.Reggiori, F. & Klionsky, D. J. (2002) Eukaryot. Cell 1, 11–21. [DOI] [PMC free article] [PubMed] [Google Scholar]
- 16.Gozuacik, D. & Kimchi, A. (2004) Oncogene 23, 2891–2906. [DOI] [PubMed] [Google Scholar]
- 17.Lee, C. Y., Clough, E. A., Yellon, P., Teslovich, T. M., Stephan, D. A. & Baehrecke, E. H. (2003) Curr. Biol. 13, 350–357. [DOI] [PubMed] [Google Scholar]
- 18.Gorski, S. M., Chittaranjan, S., Pleasance, E. D., Freeman, J. D., Anderson, C. L., Varhol, R. J., Coughlin, S. M., Zuyderduyn, S. D., Jones, S. J. & Marra, M. A. (2003) Curr. Biol. 13, 358–363. [DOI] [PubMed] [Google Scholar]
- 19.Xue, L., Fletcher, G. C. & Tolkovsky, A. M. (1999) Mol. Cell Neurosci. 14, 180–198. [DOI] [PubMed] [Google Scholar]
- 20.Mills, K. R., Reginato, M., Debnath, J., Queenan, B. & Brugge, J. S. (2004) Proc. Natl. Acad. Sci. USA 101, 3438–3443. [DOI] [PMC free article] [PubMed] [Google Scholar]
- 21.Aita, V. M., Liang, X. H., Murty, V. V., Pincus, D. L., Yu, W., Cayanis, E., Kalachikov, S., Gilliam, T. C. & Levine, B. (1999) Genomics 59, 59–65. [DOI] [PubMed] [Google Scholar]
- 22.Liang, X. H., Jackson, S., Seaman, M., Brown, K., Kempkes, B., Hibshoosh, H. & Levine, B. (1999) Nature 402, 672–676. [DOI] [PubMed] [Google Scholar]
- 23.Yue, Z., Jin, S., Yang, C., Levine, A. J. & Heintz, N. (2003) Proc. Natl. Acad. Sci. USA 100, 15077–15082. [DOI] [PMC free article] [PubMed] [Google Scholar]
- 24.Qu, X., Yu, J., Bhagat, G., Furuya, N., Hibshoosh, H., Troxel, A., Rosen, J., Eskelinen, E. L., Mizushima, N., Ohsumi, Y., et al. (2003) J. Clin. Invest. 112, 1809–1820. [DOI] [PMC free article] [PubMed] [Google Scholar]
- 25.Inbal, B., Bialik, S., Sabanay, I., Shani, G. & Kimchi, A. (2002) J. Cell Biol. 157, 455–468. [DOI] [PMC free article] [PubMed] [Google Scholar]
- 26.Raveh, T. & Kimchi, A. (2001) Exp. Cell Res. 264, 185–192. [DOI] [PubMed] [Google Scholar]
- 27.Tang, X., Khuri, F. R., Lee, J. J., Kemp, B. L., Liu, D., Hong, W. K. & Mao, L. (2000) J. Natl. Cancer Inst. 92, 1511–1516. [DOI] [PubMed] [Google Scholar]
- 28.Kim, D. H., Nelson, H. H., Wiencke, J. K., Christiani, D. C., Wain, J. C., Mark, E. J. & Kelsey, K. T. (2001) Oncogene 20, 1765–1770. [DOI] [PubMed] [Google Scholar]
- 29.Marks, P. A., Richon, V. M., Miller, T. & Kelly, W. K. (2004) Adv. Cancer Res. 91, 137–168. [DOI] [PubMed] [Google Scholar]
- 30.Richon, V. M., Webb, Y., Merger, R., Sheppard, T., Jursic, B., Ngo, L., Civoli, F., Breslow, R., Rifkind, R. A. & Marks, P. A. (1996) Proc. Natl. Acad. Sci. USA 93, 5705–5708. [DOI] [PMC free article] [PubMed] [Google Scholar]
- 31.Kuo, M. H. & Allis, C. D. (1998) BioEssays 20, 615–626. [DOI] [PubMed] [Google Scholar]
- 32.Narlikar, G. J., Fan, H. Y. & Kingston, R. E. (2002) Cell 108, 475–487. [DOI] [PubMed] [Google Scholar]
- 33.Kim, D. H., Kim, M. & Kwon, H. J. (2003) J. Biochem. Mol. Biol. 36, 110–119. [DOI] [PubMed] [Google Scholar]
- 34.Yoshida, H., Kong, Y. Y., Yoshida, R., Elia, A. J., Hakem, A., Hakem, R., Penninger, J. M. & Mak, T. W. (1998) Cell 94, 739–750. [DOI] [PubMed] [Google Scholar]
- 35.Nijhawan, D., Fang, M., Traer, E., Zhong, Q., Gao, W., Du, F. & Wang, X. (2003) Genes Dev. 17, 1475–1486. [DOI] [PMC free article] [PubMed] [Google Scholar]
- 36.Nakata, S., Yoshida, T., Horinaka, M., Shiraishi, T., Wakada, M. & Sakai, T. (2004) Oncogene 23, 6261–6271. [DOI] [PubMed] [Google Scholar]
- 37.Henderson, C., Mizzau, M., Paroni, G., Maestro, R., Schneider, C. & Brancolini, C. (2003) J. Biol. Chem. 278, 12579–12589. [DOI] [PubMed] [Google Scholar]
- 38.Maggio, S. C., Rosato, R. R., Kramer, L. B., Dai, Y., Rahmani, M., Paik, D. S., Czarnik, A. C., Payne, S. G., Spiegel, S. & Grant, S. (2004) Cancer Res. 64, 2590–2600. [DOI] [PubMed] [Google Scholar]
- 39.Luo, X., Budihardjo, I., Zou, H., Slaughter, C. & Wang, X. (1998) Cell 94, 481–490. [DOI] [PubMed] [Google Scholar]
- 40.Li, H., Zhu, H., Xu, C. J. & Yuan, J. (1998) Cell 94, 491–501. [DOI] [PubMed] [Google Scholar]
- 41.Kelly, W. K., Richon, V. M., O'Connor, O., Curley, T., MacGregor-Curtelli, B., Tong, W., Klang, M., Schwartz, L., Richardson, S., Rosa, E., et al. (2003) Clin. Cancer Res. 9, 3578–3588. [PubMed] [Google Scholar]
- 42.Li, L. Y., Luo, X. & Wang, X. (2001) Nature 412, 95–99. [DOI] [PubMed] [Google Scholar]
- 43.Parrish, J., Li, L., Klotz, K., Ledwich, D., Wang, X. & Xue, D. (2001) Nature 412, 90–94. [DOI] [PubMed] [Google Scholar]
- 44.Susin, S. A., Lorenzo, H. K., Zamzami, N., Marzo, I., Snow, B. E., Brothers, G. M., Mangion, J., Jacotot, E., Costantini, P., Loeffler, M., et al. (1999) Nature 397, 441–446. [DOI] [PubMed] [Google Scholar]
- 45.Wang, X., Yang, C., Chai, J., Shi, Y. & Xue, D. (2002) Science 298, 1587–1592. [DOI] [PubMed] [Google Scholar]
- 46.Soengas, M. S., Capodieci, P., Polsky, D., Mora, J., Esteller, M., Opitz-Araya, X., McCombie, R., Herman, J. G., Gerald, W. L., Lazebnik, Y. A., et al. (2001) Nature 409, 207–211. [DOI] [PubMed] [Google Scholar]
- 47.Finzer, P., Krueger, A., Stohr, M., Brenner, D., Soto, U., Kuntzen, C., Krammer, P. H. & Rosl, F. (2004) Oncogene 23, 4807–4817. [DOI] [PubMed] [Google Scholar]
- 48.Ruefli, A. A., Ausserlechner, M. J., Bernhard, D., Sutton, V. R., Tainton, K. M., Kofler, R., Smyth, M. J. & Johnstone, R. W. (2001) Proc. Natl. Acad. Sci. USA 98, 10833–10838. [DOI] [PMC free article] [PubMed] [Google Scholar]


