

The Earth’s rotation forced life to evolve under cyclic day and night environmental changes. In order to anticipate such daily cycles, prokaryote and eukaryote free-living organisms evolved intrinsic clocks that regulate physiological and behavioral processes. Daily rhythms have been observed in organisms living within hosts, such as parasites. Whether parasites have intrinsic molecular clocks or whether they simply respond to host rhythmic physiological cues remains unknown. Here we show that Trypanosoma brucei, the causative agent of human sleeping sickness, has an intrinsic circadian clock that regulates its metabolism in two different stages of the life cycle. We found that in vitro approximately 10% of genes in T. brucei are expressed with a circadian rhythm. The maximum expression of these genes occurs at two different phases of the day and may depend on a post-transcriptional mechanism. Circadian genes are enriched in cellular metabolic pathways, and coincide with two peaks of intracellular ATP concentration. Moreover, daily changes in the parasite population lead to differences in suramin sensitivity, a drug commonly used to treat this infection. These results demonstrate that parasites have an intrinsic circadian clock, independent from the host and that regulates parasite biology throughout the day.
Bloodstream and insect procyclic-form parasites have an intrinsic circadian transcriptome
Here we asked whether T. brucei has an intrinsic circadian clock. Since T. brucei is an extracellular parasite, the in vitro culture provides a controllable environment with no interference from the circadian rhythm of the host. In eukaryotes, the current model for circadian timekeeping depends on a clock gene feedback1. However, clock genes are not phylogenetically conserved among fungi, plants and vertebrates, indicating that each phylum evolved an intrinsic clock with different components2,3. Furthermore, single-cell studies in cultures of mammalian fibroblasts have shown that although each individual fibroblast in the population has an intrinsic clock that cycles for multiple days with a period of 24h, the clocks of the fibroblasts become rapidly desynchronized4. Resynchronization of cells in culture requires submitting them to an entrainment protocol, which typically consist of temperature cycles, light/darkness or serum shock5,6.
We chose an unbiased approach by probing the parasite transcriptome by RNA-sequencing, searching for transcripts oscillating with a 24h period. Since parasites were kept in culture, and desynchronization within the population of parasites was likely to happen, we decided to entrain parasites by exposing them to light/dark cycles, a strong environmental stimulus in many species. Bloodstream-form parasites were synchronized to 12h intervals of light and darkness for three days. On the 4th and 5th days, parasites were kept in either these alternating conditions or in constant-darkness (so-called “free running” conditions in the circadian rhythm field), during which parasite RNA was collected every 4h and subjected to RNA-seq analysis (Supplementary Fig. 1).
To determine whether there were any genes with a circadian expression pattern in both conditions (alternating and constant), we used three well-established algorithms to test if transcript levels cycled with a 24h period (see Methods). We identified 366 genes cycling in the presence of the light/dark stimulus and 242 genes cycling in constant-darkness. To determine the false discovery rate (FDR) for detection of cycling transcripts empirically, we performed a permutation test in which we randomized the original time of sample collection and calculated the number of cycling genes for 10,000 iterations. This test identified roughly the same number of cycling genes as in the non-randomized analysis, suggesting that those 366 and 242 genes are not statistically significant (Supplementary Fig. 2). Together with fact that the number of cycling genes identified is very low, we conclude that light is a weak environmental cue for T. brucei bloodstream-forms, which may not be surprising for a parasite that is not free-living.
Since light/dark cycles did not appear to entrain bloodstream-form parasites, we attempted to entrain parasites with a different environmental cue: temperature cycles. These cycles act as a universal entraining signal in mice, able to synchronize cell-autonomous oscillators throughout the body6. Inside the mammalian host parasites are exposed to the circadian variation in body temperature, rising to a peak during the active phase of the host7. Mammalian bloodstream-forms cultures were subjected to temperature cycles (32°C/37°C cycles) for three days and RNA collected on days 4 and 5 from cultures kept in alternating conditions or at constant at 37°C (Figure 1a and Supplementary Fig. 3a). These temperature-entrained samples collected during either alternating or constant conditions were subjected to RNA-seq analysis to measure the changes of transcript levels during the two day time-lapse.
Fig. 1.
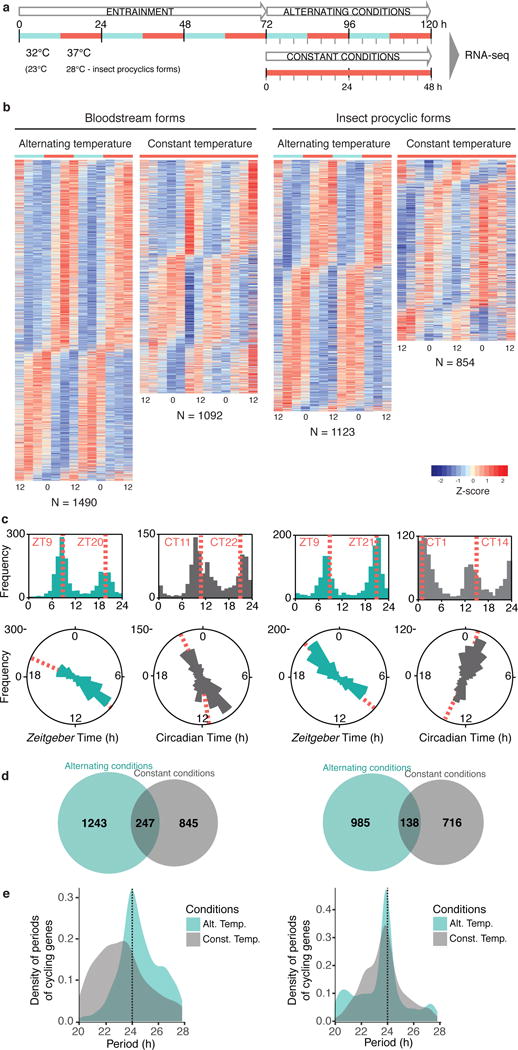
T. brucei has a circadian transcriptome in two stages of the life cycle, mammalian bloodstream and insect procyclic-forms. (a) Populations of parasites were entrained to 12h: 12h temperature intervals for three days, after which they were kept in alternating conditions or released into constant conditions for two days. During these two days, RNA was collected every 4h for RNA-seq (see Methods and Supplementary Fig. 3). (b) Gene expression heatmap views of temperature-entrained cycling genes of bloodstream and procyclic-forms. Each row represents a gene, ordered vertically by phase, determined by ARSER. N=Total number of cycling genes identified. Supplementary Data 1–2. (c) Phase distribution of cycling genes entrained by temperature. The phase of each gene’s rhythm across the day is represented in a histogram plot (top) and rose plot (bottom). The mean circular phase of the different phase clusters is indicated by an orange dashed line. (d) Venn diagram of number of cycling genes identified in temperature-entrained cycling and constant conditions for bloodstream (left) and insect procyclic-forms (right). (e) Period distribution of genes cycling in alternating (teal) and constant (grey) temperature in both life cycle stages. The total area under the curve is one for each condition. In alternating temperature conditions, the period of cycling genes is centred around 24h, while in constant temperature, the distribution of period of cycling genes is broader. The dashed line indicates the expected entraining period of 24h for the alternating conditions.
Within each temperature-entrained dataset, an unbiased comparison of the 13 samples using hierarchical clustering and principal component analysis showed that a cyclic pattern component accounted for ~27% of the total variance, being the first component in both bloodstream-form datasets. This shows that the time of sample collection is a key factor in these samples (Supplementary Fig. 3c). Circadian analysis of temperature-entrained bloodstream-forms (Fig. 1 and Supplementary Data 1) revealed that ~1100–1500 transcripts cycled, in which 1,490 genes (~15% of genome) oscillate in alternating conditions and 1,092 genes (~11% of genome) in constant temperature (Fig. 1b and Supplementary Fig. 3 and 4). Two examples of cycling transcripts are shown in Fig. 2a–b.
Fig. 2.
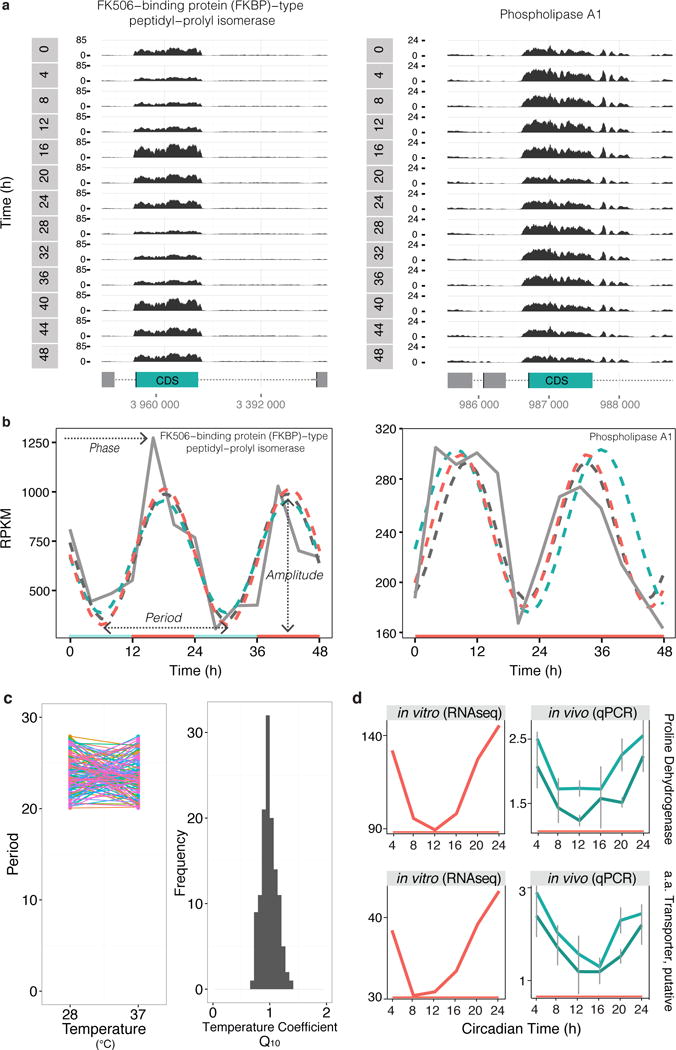
Circadian expression is temperature compensated and detected in vivo during a mouse infection. (a) Genome browser views of RNA-seq coverage from bloodstream-form parasites in temperature-entrained conditions for two genes: Tb927.10.16100, FK506-binding protein (FKBP)-type peptidyl-prolyl isomerase, putative and Tb927.1.4830, phospholipase A1 (genes represented in teal) out of the ~1100 genes cycling. CDS (coding sequence) is represented as a green rectangle and intergenic regions as gray dotted line. Reads coverage is shown in black as reads per million total reads (RPM) across 48h. (b) RPKM (reads per kilobase of transcript per million mapped reads) quantification of RNA-seq read coverage and circadian algorithm fits. ARSER fit is represented in a dark gray dashed line, JTK_CYCLE in teal and Fisher’s G-Test in orange. Represented genes are same as above: FKBP (JTK_CYCLE, ARSER and Fisher’s G-Test p<0.01) and phospholipase A1 (ARSER and Fisher’s G-Test p<0.05). (c) Period of oscillation of 127 common cycling genes at constant temperatures of 28°C and 37°C. Distribution of the estimated temperature coefficient (Q10) for the period of the 127 common cycling genes. (d) Expression of two representative cycling genes in vitro (left) and in vivo (right) (9 genes cycled in vivo out of the 11 genes tested, more examples in Supplementary Fig. 5). Transcript values in vitro were retrieved from RNA-seq analysis of bloodstream-form transcriptome in constant temperature. To measure transcript levels in vivo, RNA was extracted from parasites in the blood of infected mice. Transcript levels of proline dehydrogenase (Tb927.7.210) and putative amino acid transporter (Tb927.8.7650) were normalized to non-cycling transcripts of zinc finger protein 3 (ZFP3, Tb927.3.720, teal) and acidic phosphatase (Tb927.5.610, dark teal). N = 18 (3 mice/time point). Error bars represent standard error. Genes were found cycling significantly by ARSER, p<0.05.
Unlike what we observed when bloodstream-form parasites were subjected to light/dark cycles, upon temperature-entrainment the permutation test revealed that the number of cycling genes identified in the correct sampling order was significantly higher than when sampling order was randomly permutated (FDR < 0.05, Supplementary Fig. 2), indicating that we are detecting transcript oscillations above background noise and therefore the temperature-entrainment protocol can synchronize the bloodstream-form parasite population. But are these oscillations dependent on temperature-entrainment or would they be detected in cultures without entrainment? To confirm that temperature-entrainment was required, we compared the cycling genes identified in two constant conditions (both at 37°C in darkness): either after temperature-entrainment (1092 genes) or light/dark cycles (242 genes) (Supplementary Fig. 5b). As explained above, we did not detect statistically significant oscillating genes after light/dark cycles, suggesting that the circadian clocks of the parasites in the population remained asynchronous. Therefore, the constant-darkness dataset is a fair proxy of ‘no entrainment’ conditions. If a transcript oscillation is dependent on entrainment, this gene should only oscillate after temperature-entrainment. Indeed, 1050 of 1092 genes (96%) exclusively oscillate after temperature-entrainment, suggesting those transcript oscillations are temperature-entrainment dependent.
The majority of the oscillating genes have a maximum expression at environmental Zeitgeber Time (ZT) ZT8 and ZT20 (Fig. 1c), a bimodal distribution that is also typical in other eukaryotes8. In constant temperature, phases are shifted ~2–3h corresponding to Circadian Time (CT) CT11 and CT22 (Fig. 1c). As observed in other systems9,10, we found that the oscillatory transcriptome is divergent between alternating and constant conditions and three categories were identified: i) genes oscillating in alternating conditions only (temperature-driven and clock independent) (1,243 genes of bloodstream-forms); ii) genes oscillating in both alternating and constant conditions (clock-driven genes) (247 genes); iii) genes oscillating in constant conditions only (genes whose cycling is suppressed or masked during entrainment conditions) (845 genes) (Fig. 1d). A hallmark of circadian rhythm predicts that if parasites are entrained to temperature cycles, we should expect that in the presence of entrainment the period of the cycling transcripts to be precisely 24h and when the stimulus is removed (constant conditions) the period should remain close to 24h, but not as precisely. This is indeed what we observed. The median period of the 247 genes cycling in alternating temperature was centred around 24h and it was shorter in constant temperature. The variance of the period lengths was significantly tighter in alternating temperature compared to constant conditions (Kolmogorov-Smirnov test, p<2.2×10⁻¹⁶, Fig. 1e and Supplementary Fig. 6). These results indicate, once again, that entrainment of these transcript oscillations is dependent on temperature cycles.
Among the mammalian bloodstream-forms, there are actually two distinct stages of the life cycle that are transcriptionally different: the replicative bloodstream slender and the short-lived cell-cycle arrested bloodstream stumpy-forms. Slender-forms differentiate into the transmissible stumpy-form, via a mechanism of quorum sensing typically triggered in vitro at densities higher than ~106 parasites/mL11. These two life cycle stages are transcriptionally and metabolically different, which could add noise to our circadian studies12,13. In order to have cultures with replicative slender-forms only, we kept each culture below 106 parasites/mL. To further confirm that our parasite population was primarily composed by slender-forms, we repeated the temperature-entrainment with a GFP::PAD1utr reporter cell line, in which a GFP gene is followed by a PAD1 3′ UTR that confers maximum expression in stumpy-forms14(Supplementary Fig. 7). By FACS, we assessed GFP expression and cell cycle profile by propidium iodide staining. We found that ~95% of our cultures were GFP-negative with no apparent G1-cell cycle arrest, indicating that most parasites were in slender-form in all time points. We conclude that slender-forms alone can be responsible for the observed circadian gene expression.
When the host is bitten by a tsetse fly, T. brucei stumpy-forms differentiate into procyclic-forms that are adapted to live in the mid-gut of the fly where the temperature is much lower (~28°C). Even though the transcriptome of bloodstream and insect procyclic-forms is ~30% distinct15, we tested whether insect procyclic trypanosomes share a circadian transcriptome temperature-entraining with 23°C/28°C cycles (Fig. 1a and Supplementary Fig. 3). As seen in bloodstream-forms, an unbiased comparison of the 13 samples in each dataset using hierarchical clustering and principal component analysis showed that a cyclic pattern component accounted for 20–27% of the total variance, being the first component in both datasets. In these trypanosomes, we identified 1,123 genes cycling in alternating conditions and 854 genes cycling endogenously, i.e., after temperature-entrainment was removed (Fig. 1a–d and Supplementary Data 2 and Fig. 3–4). Of these, 127 genes (~1–2% of transcriptome) oscillate in both life cycle stages, while 965 are specific to bloodstream and 727 are specific to procyclic-forms (Supplementary Fig. 5a). The analysis to confirm if oscillations are dependent on temperature-entrainment cannot be done for the insect procyclic-forms because we did not perform light/dark entrainment in this life cycle stage.
Overall, these data show that in each of the two stages of the life cycle of T. brucei, ~10% of the transcriptome undergoes circadian oscillations, suggesting that having a circadian rhythm might have conferred an evolutionary advantage throughout the parasite life cycle. The fact that most cycling genes differ between the two stages indicates that the circadian clock can sense and adapt to the different host environments, another hallmark of circadian clocks8.
Daily transcriptome is temperature compensated
We showed above that transcript oscillations are entrained by temperature cycles. Another canonical property of circadian clocks is temperature compensation: the ability of the period of a rhythm to remain relatively constant at various physiologically permissive temperatures6. The Q10 temperature coefficient measures the rate of change in a biological system when temperature is increased 10°C. Whereas kinetics of most biological systems double or triple when increasing 10°C (and thus Q10 within 2 and 3), the rate of biological reactions regulated by a circadian rhythm does not change with a temperature increase (Q10 ~1)6. To test if T. brucei transcript oscillations are temperature compensated, we compared the periods of 127 genes that oscillate in constant 28°C and constant 37°C (Supplementary Fig. 5a). We observed no significant changes and the average Q10 is 0.99 ± 0.13 (standard deviation, Fig. 2c) showing that the circadian clock in T. brucei is temperature compensated.
Parasite gene transcripts also cycle in a mouse infection
As the identification of the trypanosome circadian transcriptome was performed from parasites grown in culture, next we tested whether transcript oscillations could also be found in vivo, i.e., in parasites from an infected mouse. For this, we collected blood every 4h, RNA was extracted and subjected to qPCR. We confirmed that transcript levels of most genes also cycled in vivo (Fig. 2d and Supplementary Fig. 5d, nine transcripts cycled out of 11 tested), including proline dehydrogenase and a putative amino acid transporter.
When we compare the circadian transcriptome of T. brucei (bloodstream and procyclic) with other organisms, we note that T. brucei has fewer cycling transcripts than a mouse liver (~10 versus 20%, respectively)16, but it is has significantly more than those identified in human and mouse immortalized cell lines (0.1–1.2%)17,18. The amplitude of the oscillations in bloodstream is on average ~1.4-fold (~40% difference), which is within the range of what is described (~2.3-fold in the mouse liver16 and low in cell lines17,18). This lower amplitude found in culture systems may be due to asynchrony within the cell population (diluting the maximum and minimum expression levels), as well as, the absence of additional entraining cues present in vivo. In fact, for the genes we studied in vivo, we observed on average higher amplitude than in vitro (1.86- ±0.06 and 1.49-fold ±0.1 SD, respectively, p<0.001, two-tailed Mann-Whitney test). The fact that Gim5A transcript (Supplementary Fig. 5d) showed opposite phases when measured in vitro RNA-seq and in vivo real-time PCR suggests once more that there may be additional entraining signals in vivo that differentially affect the amplitude and phase of gene expression19.
Taken together, these results show that host physiological rhythms (in vivo) and temperature (in culture) are capable of synchronizing T. brucei parasites, and that the transcriptome circadian oscillation is driven by an endogenous clock.
Circadian regulation is post-transcriptional
Even though in eukaryotes the circadian timekeeping mechanism is based on a transcription/translation feedback loop model, recent studies have shown that post-transcriptional and post-translational steps impose further levels of circadian regulation20. T. brucei and other Kinetoplastida are peculiar eukaryotes as most of the genome is organized in polycistronic units (PCUs) that are constitutively transcribed and, as a result, gene expression is mainly regulated post-transcriptionally21,22. To determine whether T. brucei circadian gene expression was also post-transcriptionally regulated, we tested whether cycling genes clustered in specific PCUs. We found that cycling genes show a uniform distribution among most PCUs (similar proportion of cycling and non-cycling genes, Kolmogorov-Smirnov p > 0.1), with no bias for a specific position within a PCU (Kolmogorov-Smirnov test, p > 0.5), nor enrichment for genes peaking at a specific phase (Kolmogorov-Smirnov test, p > 0.1, Fig. 3a–d and Supplementary Fig. 8). The fact that co-transcribed genes can either not cycle or cycle with a maximum expression at opposing phases indicates that the timekeeping mechanism used by T. brucei is primarily based on post-transcriptional regulation, which represents a different mechanism of timekeeping in eukaryotes.
Fig. 3.

T. brucei cycling gene expression is post-transcriptionally regulated. (a–b) Distribution of cycling genes genes across chromosomes 1, 2 and 3 (all 11 chromosomes are represented in Supplementary Fig. 8). The transcription start site (TSS) at the beginning of each polycistronic unit (PCUs) and direction of transcription is indicated by a vertical black flag. Genes are either: gray when non-cycling; orange when cycling with maximal expression between Circadian time CT3-CT18 for (a) bloodstream or CT18-CT9 for (b) insect procyclic-forms; and teal when cycling with maximal expression between CT19-CT2 for (a) bloodstream or CT10-CT19 for (b) insect procyclic-forms. (c–d) Cycling genes with different phases of expression encoded in the same PCU in (c) bloodstream-forms and in (d) insect procyclic-forms. A representative PCU from each of the first three chromosomes is depicted (chromosomes 1–3 have 11, 17 and 12 PCUs, respectively. From these, in bloodstream-forms, 8/11, 10/17 and 10/12 PCUs have cycling genes. In procyclic-forms 7/11, 6/17 and 10/12 PCUs have cycling genes). (e) Cell cycle profile analysis of bloodstream parasites throughout the 4th day of alternating temperature. Parasites were fixed and stained with propidium iodide and analysed by FACS. ZT refers to Zeitgeiber time, in which ZT = 0h corresponds to the beginning of the cold period (32°C). Error bars represent standard error. N=3 biological replicates. (f) Expression profile of two cell cycle associated genes (DNA topoisomerase II, putative (TOP2), Tb927.11.11540 and cdc2-related kinase 3, putative (CRK3), Tb927.10.4990) measured with RNA-seq from cultures in constant temperature. RPKM refers to reads per kilobase of transcript per million mapped reads.
Circadian transcriptome is not a consequence of the cell cycle
In culture, T. brucei parasites replicate every ~6–7h in bloodstream-forms and every ~11–12h in procyclic-forms. Although circadian oscillations have a period of ~24h, we wondered whether temperature-entrainment could synchronize the cell cycle of parasites and as a result, cell cycle could be contributing to the circadian oscillations of transcripts. To rule out this possibility, we temperature-entrained T. brucei bloodstream cultures and collected cells throughout the day to measure DNA content. Not surprisingly, we observed that parasite cultures in alternating conditions grew slower than in constant 37°C (7:33h versus 6:53h doubling time, respectively). However, the frequency of dividing cells in the population was constant throughout the day (~30% in G2/M) suggesting that parasite cell division was not synchronized to occur at a certain time of the day (Fig. 3E). Furthermore, among cycling transcripts, we detected no enrichment of cell cycle associated genes (Supplementary table 1), as illustrated by the expression profile of DNA topoisomerase II and cdc2-related kinase 3 (Fig. 3f). Together, these data indicate that the cyclic pattern of T. brucei bloodstream transcriptome is not dependent on the cell cycle.
The metabolism of the parasite population changes throughout the day
To explore the biological relevance of a circadian clock in T. brucei, we performed a temporal Gene Ontology (GO) analysis. We assigned the genes that cycled in constant temperature in bloodstream and procyclic-forms into 12 groups based on the phase of maximal expression and evaluated the enrichment of GO terms (Fig. 4a and Supplementary Data 4). We found that 95% of cycling GO terms are enriched in only one phase cluster in bloodstream-form (93% in insect procyclic-forms), suggesting that specific cellular processes are upregulated at different times of the day. One such process is carbohydrate metabolism, in which 13 out of 31 genes annotated to this GO term peaked expression at CT22-24 (Fig. 4a). Among those genes, ten belong to the glycolysis pathway (Supplementary Fig. 9). The insect-stage parasite circadian gene expression also seems to upregulate different cellular functions throughout the day. For example, vesicle-mediated transport GO term is composed of 13 genes, nine of which peak at CT0-2 (Fig. 4a).
Fig. 4.

The T. brucei circadian transcriptome regulates metabolism related genes. (a) Heatmap view of GO term enrichment of both bloodstream and insect-stage parasite circadian gene expression throughout the day (2h phase cluster, p<0.05, Hypergeometric test, Supplementary Data 4). Side plots show individual gene expression profile of the manually curated most significantly enriched GO term in the selected clusters. In each plot, we have indicated the number of cycling genes with the designated phase, out of the total number of genes in the specific GO term. Relative expression refers to relative expression calculated by RPKM (reads per kilobase of transcript per million mapped reads) levels of each gene normalized by its mean across the 13 time points. (b) Metabolic pathways are enriched in intrinsic cycling genes expressed at different times of the day. The total area under the curve is one for each pathway. Genes belonging to six out of the 55 KEGG pathways are shown. (c) Parasite intracellular ATP concentrations were measured on day four from cultures in alternating or constant temperature from two independent experiments from a minimum of six biological replicates per condition.
A pathway analysis (KEGG) confirmed that many cycling genes are involved in metabolism or metabolism-associated functions. Even though a cycling gene peaks only once a day, other genes from the same metabolic pathway may not oscillate, peak at the same phase or an opposite phase (Fig. 4b). This overall transcript oscillation of metabolism-associated genes suggests that during the 24h day the parasite population undergo qualitative and quantitative metabolic adaptations. Because expression of most cycling genes peaks at two opposing phases of the day (Fig. 4b), it is likely that, as observed in mammals, parasites experience metabolic ‘rush hours’ twice a day8. To test this hypothesis, we temperature-entrained T. brucei bloodstream cultures and collected cells throughout the day to measure intracellular ATP concentrations. We found that ATP content was higher at ZT/CT8 and ZT/CT20, which coincided with the time at which metabolic genes present the highest transcript levels (Fig. 4c).
Circadian rhythms impact parasite resistance to challenges
From the pathway analysis in bloodstream-forms, we also identified some cycling genes involved in redox metabolism (Fig. 4b and Supplementary Fig. 10). To test if such gene expression oscillations lead to different levels of sensitivity to oxidative stress throughout the day, we temperature-entrained bloodstream-forms and, starting every 4h through the day we incubated parasites with H2O2 for 1h and measured their viability. We observed a time-dependent sensitivity to H2O2 treatment, which was 2.6-fold higher at CT4 than at CT16 (p<0.001, Fig. 5a). These results confirm that circadian metabolic gene expression patterns have functional consequences to the overall metabolic and redox state of bloodstream-form parasites.
Fig. 5.

The T. brucei circadian transcriptome affects the sensitivity of the parasite to stresses. (a) Dose response curve from oxidative stress sensitivity challenge and the respective IC50 calculated at different times of the day. Bloodstream-form parasites were treated with serial dilution of H2O2 concentrations. Non-linear regression (variable slope, four parameters) comparison shows LogIC50 is different (p<0.0001) between time points. N = 6 biological replicates. Error bars represent the standard error. CT refers to Circadian Time. (b) Dose response curve from suramin treatment of parasites at different times of the day and the respective IC50 calculated for each time point. Bloodstream-form parasites were collected around the clock and treated with serial dilution of suramin concentrations and viability measured. Non-linear regression (variable slope, four parameters) comparison shows LogIC50 is different (p<0.0001) between time points. N = 9 biological replicates tested in three independent experiments. Error bars represent the standard error. CT refers to Circadian Time, in which CT0 is the time when cultures would be transitioned to the cold (32°C) during the entrainment period, but instead here they are kept in constant temperature (37°C) free-running conditions.
Since parasites display a different transcriptome at different times of the day, we wondered whether this would affect the sensitivity of bloodstream-form parasites to suramin, a drug commonly used in the field to treat sleeping sickness patients. Similar to the oxidative stress experiment, we temperature-entrained bloodstream-form parasites and beginning every 4h through the day we tested cell viability upon a 24h in vitro treatment with suramin. We observed that the parasites are more resistant to suramin treatment beginning at CT8, which is reflected in a higher IC50 (p<0.001), as 2.5-fold higher drug concentration is needed to kill these parasites (Fig. 5b). Thus, we conclude that during the day bloodstream-form parasites are not equally sensitive to suramin treatment.
Discussion
Various studies in pathogens23–27 and microbiota28,29 have described daily rhythms in microorganisms living inside hosts. However in these experiments it was not established whether such behavior was endogenously controlled by the pathogen, or whether rhythms were imposed by the host. Indeed the 24h variations in the microbiome appear to be driven by the host and by its feeding regime28,29. Because T. brucei is extracellular and it can be easily cultured, it is an ideal system to study whether a pathogen has an intrinsic mechanism to keep time. By analysing the transcriptome of parasites grown in vitro after entrainment to temperature, we found that T. brucei has a circadian oscillating transcriptome.
What is the difference between a circadian rhythm and a response to a subtle heat-shock? A circadian clock has three bona-fide hallmarks that we found in trypanosomes: it has a free running period of ~24h in constant conditions, it is entrainable and it is temperature compensated. The first hallmark was met when we found ~1100 genes that oscillate in constant conditions with a free running period of ~24h. Entrainment is supported by two observations. First, 96% of the temperature-entrained transcript oscillations in bloodstream-forms are absent under light/dark cycle conditions where entrainment did not appear to occur (Supplementary Fig. 5b). Second, the period and phase of T. brucei oscillating genes were close but somewhat different between alternating and constant conditions (Fig. 1c and e). The hallmark of temperature compensation was demonstrated by the fact that the period of oscillating genes remains ~24h when parasites are either at 37°C or 28°C (Fig. 2c).
In this study we showed that replicative slender bloodstream-form and procyclic-form parasites have circadian transcriptomes that regulate multiple metabolic pathways. In addition, its is possible that with a circadian clock parasites are better prepared to escape the host immune response, which is itself under circadian control30. A circadian clock may also be important for transmission success: since tsetse fly has a daily biting pattern31, having transmissible forms ready to match when the vector tsetse is more likely to bite would be an advantage. Also within tissues, parasites with a timekeeping mechanism could anticipate fluctuations in nutrient availability within the interstitial spaces. Although it is likely that the transmissible non-replicative stumpy-form32 and the recently described adipose tissue form14 also have circadian rhythms, this still requires further analysis.
The transcriptomic oscillations result in cyclic changes in the parasite population with a ~24h period, primarily at the metabolic level. Since bloodstream-form parasites divide every 7h, parasites in the morning are different from those in the evening, an unprecedented concept in disease-causing pathogens. These rhythms are likely an important adaptation since in vivo their host environment (mammal or insect) also undergoes circadian changes30,33.
Many questions remain to be answered in the future. What is the daily transcriptome of bloodstream-forms in vivo? Due to the complexity of the host environment, we would expect to identify a larger number of parasite oscillating genes and with more robust amplitudes. What are the core clock genes that drive these oscillations in gene expression? This will be essential not only to understand the molecular mechanism underlying circadian rhythm in trypanosomes, but also to use it as a tool to demonstrate which of the oscillations detected in vivo are a result of an intrinsic parasite clock and which ones are imposed by the host. Finally, it will be interesting to test whether light and dark cycles can entrain procyclic-forms, as these parasites are more exposed to light while in the tsetse fly.
This study demonstrates the potential of high-throughput approaches for identifying circadian patterns in the transcriptome of non-model organisms and it provides a foundation for the search of the master regulators of this process in T. brucei and for the search for endogenous clocks in other important infectious agents such as the malaria parasite.
Methods
Ethics Statement
All animal care and experimental procedures were performed in accordance with University of Texas Southwestern Medical Center (UTSW) IACUC guidelines, approved by the Ethical Review Committee at the University of Southwestern Medical Center and performed under the IACUC-2012-0021 protocol.
Parasites and Culture Conditions
T. brucei AnTat 1.1E, a pleomorphic clone, derived from an EATRO1125 clone was originally isolated from blood of Tragelaphus scriptus in Uganda. For all the experiments, we used AnTat 1.1E 90-13, a transgenic cell-line encoding the tetracyclin repressor and T7 RNA polymerase34.
Bloodstream-forms were grown routinely in HMI-11 at 37°C in 5% CO235. For all RNA-seq experiments individual cultures of parasites were prepared, adjusting the initial parasite density so that parasite cultures would be at 106 parasites/mL at each collection time point. Parasite numbers were calculated using a Hemocytometer. Synchronizations were done for three days in alternating temperature or light conditions. For the bloodstream-forms - Temperature RNA-seq experiment, culture flasks were moved every 12h between incubators either at 32°C or 37°C or remained at constant 37°C. In the bloodstream-forms - Light/Dark entrainment RNA-seq experiment, a warm white LED 3W lamp was used to illuminate the cultures inside the incubator. Temperature was kept at 37°C and fluctuations were monitored and shown to be less than 0.1°C. At the end of day three (72 h), culture flasks were split into alternating or constant conditions groups. RNA samples were collected every 4h for two days (a total of 13 samples per condition, with the second cycle acting as biological replicate).
Differentiation of bloodstream-forms to procyclic-forms was induced by adding 6 mM cis-acconitate to DTM medium and by reducing temperature to 28°C. The newly differentiated procyclic cultures were maintained as described previously36. Differentiation was assessed by EP Procyclin expression, using anti-Trypanosoma brucei Procyclin, FITC mouse IgG1 (Cedarlane Labs). For the procyclic-form RNA-seq experiment, culture flasks were moved every 12h between incubators either at 23°C or 28°C or remained at constant 28°C. For a schematic representation see Figure 1A and Supplementary Fig. 1 and 2.
To confirm that the bloodstream-form cultures were primarily composed of slender forms, we used a GFP::PAD1utr reporter cell line, in which a GFP gene is followed by a PAD1 3′ UTR that confers maximum expression in stumpy forms.
Transcriptome Sequencing (RNA-seq)
RNA was isolated from ~107 Trypanosoma brucei cells (density of ~106/mL) with TRIzol reagent according to the manufacturer’s instructions (Life Technologies). 1 μg of total RNA was enriched for mRNA using Poly-A beads for RNA-seq according to the manufacturer’s instructions (Invitrogen). The removal of ribosomal RNAs was confirmed on a Bioanalyzer Nano Chip (Agilent Technologies). Sequencing libraries were constructed using the TruSeq RNA Sample preparation protocol (Illumina). RNA-sequencing of libraries was performed in the HiSeq2000 platform (Illumina) with 50-bp reads according to manufacturer’s instructions by the UTSW McDermott Next Generation Sequencing Core and Beijing Genomics Institute (BGI). Read quality was assessed using the FASTQC quality control tool (http://www.bioinformatics.babraham.ac.uk/projects/fastqc/). The SolexaQA suite of programs37 was used to trim raw reads to their longest contiguous segment above a PHRED quality threshold of 28, and reads smaller than 25 nucleotides long were discarded. Reads were mapped to the T. brucei TREU927 reference genome using bowtie (v1.0.0)38 allowing for 2 mismatches and only non-ambiguous alignments (options –v 2 –m 1). The number of reads mapping to each gene was determined, and then normalized to RPKM (reads per kilobase of transcript per million mapped reads) (excluding a highly expressed VSG gene from the calculation) using the R software environment and the packages GenomicAlignments39, Biostrings40 and rtracklayer41 from Bioconductor42.
The number of uniquely mapped reads in each sample (~20 million reads) was enough to detect the expression of more than 80% percent of annotated T. brucei genes (5 or more reads mapped over CDS), and it was verified that this number does not increase significantly with added depth. The distribution of RPKM values in each sample was plotted and verified to be similar across all samples.
Time Series Analysis for Circadian Cycling
Hierarchical clustering analysis was performed and heatmaps of Spearman correlations from centered log2 transformed RPKM values (Supplementary Figs. 1b and 3c–d) were done in the R software environment using the function heatmap.2 from the gplots package43. Principal component analysis (PCA) was done on centered and log2 transformed RPKM values using the function princomp.
RNA cycling was assessed by three programs: GeneCycle44, that implements Fisher’s G-Test, JTK_CYCLE45 and ARSER46. For Fisher’s G-Test and JTK_CYCLE analyses, RPKM data were detrended by linear regression. A gene was considered cycling if two out of three programs detected periodic expression with threshold of p ≤ 0.05 and mean expression higher than 10 RPKM. This cutoff was defined by assessing the coefficient of variation in relation to the mean expression across all time points. The amplitude, period and phase reported by ARSER were used for further analyses. The heatmaps of phases in figure 1b and Supplementary Fig. 1d plot the z-score transformed RPKM values, ordered by the phase determined by ARSER. The peaks of expression phase distributions were determined by fitting a mixed von Mises-Fisher model to the bimodal phase distributions using the R software environment and the movMF package47, extracting the means of the two von Mises-Fisher distributions.
To determine the false discovery rate (FDR) of identification of cycling genes the time point of collection were randomized and number of cycling genes assessed. These permutation tests were run 10,000 times for each of the six datasets.
Chromosome Distribution of Cycling Genes
Uniform distribution of cycling genes among PCUs was tested by comparing the distribution of proportions of cycling/non-cycling genes per PCU with a distribution obtained by randomly sampling 10,000 times the same number of genes from the genome. To test if cycling genes displayed a bias in their positioning within PCUs, the distance of each gene to its nearest upstream transcription start site (TSS) was calculated and then the distributions of these distances for cycling genes only and for all genes were compared. In order to test if cycling genes within a PCU tend to peak at the same phase, the distribution of proportions of each phase cluster within PCUs with a random distribution obtained by randomly permuting the cluster assignment of cycling genes 10,000 times were compared. For these three analyses significance was assessed by a Kolmogorov-Smirnov test.
Mice Infection and Real-Time Quantitative PCR Analysis
The infections of 18 wild-type male C57BL/6J mice, 6–10 week old (UT Southwestern Medical Center Mouse Breeding Core Facility) described in this manuscript were performed by intraperitoneal (i.p.) injection of 2,000 T. brucei AnTat 1.1E parasites14. Prior to infection, T. brucei cryostabilates were thawed and parasite viability and numbers were assessed by mobility under a microscope. Mice were individually housed in activity wheel-equipped cages under Light:Dark 12:12h for 7 days after which animals were kept in dark conditions. Chow and water were available ad libitum. Locomotor activity was recorded and analyzed using ClockLab software (Actimetrics, Wilmette, IL) to determine the circadian phase, as previously described48, for each animal on day 20 post-infection. Mice were assigned to six time points of collection, and every 4h three mice were sacrificed and terminal cardiac blood samples were collected. All mice included in the study were infected, confirmed by measuring the parasitemia. Group sizes were determined based on early in vivo experiments using this experimental model14, and animals were randomly selected for each time-point of collection. All quantitative analyses were performed in a blinded manner. RNA was extracted with TRIzol LS according to the manufacturer’s instructions (Life Technologies), and reverse transcription and real-time PCR were performed as described previously49. Primer efficiencies were determined using standard curves with 3-log10 coverage. Transcript levels were normalized to genes zinc finger protein 3 (ZFP3, Tb927.3.720) and a putative acidic phosphatase (Tb927.5.610) whose expression remained constant in both temperature and light alternating conditions. Primer sequences are listed in Supplementary table 2.
Assessment of Metabolic Activity and Cell Cycle Stage
Bloodstream-form parasites were cultured and entrained by temperature as described above for the RNA-seq experiment. Samples were collected every 4h throughout the day.
For metabolic activity assessment through measurement of ATP concentration from parasite population, parasitemia was assessed and metabolic activity was measured according to the manufacturer’s instructions of CellTiter-Glo® Luminescent Cell Viability Assay (Promega) from 1 × 10⁵ parasites centrifuged and resuspended in 25μl trypanosome dilution buffer (TDB, 5 mM KCl, 80 mM NaCl, 1 mM MgSO4, 20mM Na2HPO4, 2 mM NaH2PO4, 20 mM glucose, pH 7.7). ATP concentration was measured in two independent experiments from a minimum of six biological replicates.
For cell cycle analysis, 2 × 10⁶ parasites were fixed by slowly adding ethanol to a final concentration of 70%. Fixed trypanosomes were pelleted and stained with 0.5 mL in PBS/2 mM EDTA containing 10 μg RNAse A and 1 mg propidium iodide for 30 min at 37°C. Percentage of cells dividing was measured in three independent experiments from a minimum of 30 000 events. Intensity of red fluorescence was measured using a FACSCalibur flow cytometer (BD Biosciences) and data were analyzed using FlowJo.
Functional analysis of cycling genes
Cycling genes identified by RNA-seq were clustered in 12 groups (CT0-CT2, CT2-CT4, etc.) based on their expression peak. T. brucei GO term annotations were obtained from TriTrypDB. GO term enrichment was assessed in each group by Hypergeometric test using GOstats50 and by Fisher’s Exact Test and plotted as heatmap in figure 4a. Manually curated GO term was defined when both statistical tests show enrichment (p<0.05) and more than 3 genes annotated to a GO term were cycling with the determined phase (see Supplementary Data 4).
Suramin and H2O2 sensitivity assay
Bloodstream-form parasites were cultured and entrained by temperature as described above for the RNA-seq experiment. Every 4h, parasites were harvested from exponential phase cultures, counted and plated in 96 well flat-bottom microtiter plates at a parasite density of 10,000–20,000 cells/well. Serial dilution concentrations (1:3) of suramin (Sigma) were added. The compound was applied in triplicate at eight concentrations and incubated for 24h at 37°C. For the oxidative stress experiment, H2O2 (Sigma) at six different dilutions were tested (1:10) and parasites were incubated for one hour at 37°C. Alamar Blue (Sigma) was used to determine cell viability by adding at ten percent of the well volume followed by 4h incubation at 37°C. Fluorescence was measured with 530ex/590em nm and percentage of live cells calculated by normalizing to non treated parasites. Calculation of IC50 values was done by 4-parameter nonlinear curve fit (GraphPad Prism) and significance assessed by the extra sum-of-squares F test. H2O2 sensitivity was tested in two independent experiments from a total of six biological replicates. Suramin resistance was tested in three independent experiments and IC50 values are shown as the mean of those experiments (N = 9).
Data availability
The RNA-seq datasets are often referred to as CW for cold/warm alternating conditions, WW for warm/warm constant conditions, LD light/dark alternating conditions and DD for dark/dark constant conditions. RPKM and circadian oscillation analysis of all these datasets are available in the present manuscript as Supplementary Data 1–3. RNA-seq datasets generated as part of this study have also been submitted to the ArrayExpress database (https://www.ebi.ac.uk/arrayexpress/) under accession ID E-MTAB-4952.
Supplementary Material
Acknowledgments
We thank Meg Phillips for help in starting parasite cultures at UT Southwestern and advice on the suramin sensitivity experiments, Prachi Nakashe for the library preparations of the light/dark datasets, Michael Broderick for help during the oxidative stress experiment, Leonor Pinho, Iza Kornblum and Gokhul Kilaru for technical support, Jeremy Stubblefield for help during the blood collection, Dave Barry, Meg Phillips, Carla Green and Margarida Vaz for reading the manuscript and Christian Janzen for the GFP-PAD1utr cell-line. The work was supported by HHMI International Early Career Scientist (55007419) to L.M.F., by Fundação para a Ciência e Tecnologia SFRH/BD/51286/2010 to F.R-F and IF/00595/2014 to N.L.B-M. J.S.T. is an Investigator in the Howard Hughes Medical Institute.
Footnotes
Supplementary Materials is linked to the online version of the paper at www.nature.com/nmicrobiol.
Author contributions:
F.R-F., L.M.F. and J.S.T designed the study. F.R-F. performed the experiments. D.P-N., F.R-F., N.L.B-M., L.M.F. and J.S.T analyzed the data. F.R-F. wrote the manuscript and all authors contributed to reviewing the manuscript.
The authors declare no competing financial interests.
Readers are welcome to comment on the online version of the paper.
The data reported in the paper are available in the Supplementary Data 1 – 4.
References and Notes
- 1.Young MW, Kay SA. Time zones: a comparative genetics of circadian clocks. Nat Rev Genet. 2001;2:702–715. doi: 10.1038/35088576. [DOI] [PubMed] [Google Scholar]
- 2.Rosbash M. The implications of multiple circadian clock origins. PLoS Biol. 2009;7:e62. doi: 10.1371/journal.pbio.1000062. [DOI] [PMC free article] [PubMed] [Google Scholar]
- 3.Bell-Pedersen D, et al. Circadian rhythms from multiple oscillators: lessons from diverse organisms. Nat Rev Genet. 2005;6:544–556. doi: 10.1038/nrg1633. [DOI] [PMC free article] [PubMed] [Google Scholar]
- 4.Welsh DK, Yoo SH, Liu AC, Takahashi JS, Kay SA. Bioluminescence imaging of individual fibroblasts reveals persistent, independently phased circadian rhythms of clock gene expression. Curr Biol. 2004;14:2289–2295. doi: 10.1016/j.cub.2004.11.057. doi:S0960982204009157 [pii] 10.1016/j.cub.2004.11.057. [DOI] [PMC free article] [PubMed] [Google Scholar]
- 5.Balsalobre A, Damiola F, Schibler U. A serum shock induces circadian gene expression in mammalian tissue culture cells. Cell. 1998;93:929–937. doi: 10.1016/s0092-8674(00)81199-x. [DOI] [PubMed] [Google Scholar]
- 6.Buhr ED, Yoo SH, Takahashi JS. Temperature as a universal resetting cue for mammalian circadian oscillators. Science. 2010;330:379–385. doi: 10.1126/science.1195262. doi:330/6002/379[pii] 10.1126/science.1195262. [DOI] [PMC free article] [PubMed] [Google Scholar]
- 7.Refinetti R, Menaker M. The circadian rhythm of body temperature. Physiol Behav. 1992;51:613–637. doi: 10.1016/0031-9384(92)90188-8. [DOI] [PubMed] [Google Scholar]
- 8.Zhang R, Lahens NF, Ballance HI, Hughes ME, Hogenesch JB. A circadian gene expression atlas in mammals: implications for biology and medicine. Proc Natl Acad Sci U S A. 2014;111:16219–16224. doi: 10.1073/pnas.1408886111. [DOI] [PMC free article] [PubMed] [Google Scholar]
- 9.van der Linden AM, et al. enome-wide analysis of light- and temperature-entrained circadian transcripts in Caenorhabditis elegans. PLoS Biol. 2010;8:e1000503. doi: 10.1371/journal.pbio.1000503. [DOI] [PMC free article] [PubMed] [Google Scholar]
- 10.Hughes ME, Grant GR, Paquin C, Qian J, Nitabach MN. Deep sequencing the circadian and diurnal transcriptome of Drosophila brain. Genome research. 2012;22:1266–1281. doi: 10.1101/gr.128876.111. [DOI] [PMC free article] [PubMed] [Google Scholar]
- 11.Mony BM, et al. Genome-wide dissection of the quorum sensing signalling pathway in Trypanosoma brucei. Nature. 2013 doi: 10.1038/nature12864. [DOI] [PMC free article] [PubMed] [Google Scholar]
- 12.Dejung M, et al. Quantitative Proteomics Uncovers Novel Factors Involved in Developmental Differentiation of Trypanosoma brucei. PLoS Pathog. 2016;12:e1005439. doi: 10.1371/journal.ppat.1005439. [DOI] [PMC free article] [PubMed] [Google Scholar]
- 13.Kabani S, et al. Genome-wide expression profiling of in vivo-derived bloodstream parasite stages and dynamic analysis of mRNA alterations during synchronous differentiation in Trypanosoma brucei. BMC genomics. 2009;10:427. doi: 10.1186/1471-2164-10-427. [DOI] [PMC free article] [PubMed] [Google Scholar]
- 14.Trindade S, et al. Trypanosoma brucei Parasites Occupy and Functionally Adapt to the Adipose Tissue in Mice. Cell Host Microbe. 2016 doi: 10.1016/j.chom.2016.05.002. [DOI] [PMC free article] [PubMed] [Google Scholar]
- 15.Nilsson D, et al. Spliced leader trapping reveals widespread alternative splicing patterns in the highly dynamic transcriptome of Trypanosoma brucei. PLoS Pathog. 2010;6:e1001037. doi: 10.1371/journal.ppat.1001037. [DOI] [PMC free article] [PubMed] [Google Scholar]
- 16.Koike N, et al. Transcriptional Architecture and Chromatin Landscape of the Core Circadian Clock in Mammals. Science. 2012 doi: 10.1126/science.1226339. doi:science.1226339 [pii] 10.1126/science.1226339. [DOI] [PMC free article] [PubMed] [Google Scholar]
- 17.Hoffmann J, et al. Non-circadian expression masking clock-driven weak transcription rhythms in U2OS cells. PLoS One. 2014;9:e102238. doi: 10.1371/journal.pone.0102238. [DOI] [PMC free article] [PubMed] [Google Scholar]
- 18.Hughes ME, et al. Harmonics of circadian gene transcription in mammals. PLoS Genet. 2009;5:e1000442. doi: 10.1371/journal.pgen.1000442. [DOI] [PMC free article] [PubMed] [Google Scholar]
- 19.Izumo M, et al. Differential effects of light and feeding on circadian organization of peripheral clocks in a forebrain Bmal1 mutant. eLife. 2014;3 doi: 10.7554/eLife.04617. [DOI] [PMC free article] [PubMed] [Google Scholar]
- 20.Reddy AB, Rey G. Metabolic and nontranscriptional circadian clocks: eukaryotes. Annu Rev Biochem. 2014;83:165–189. doi: 10.1146/annurev-biochem-060713-035623. [DOI] [PMC free article] [PubMed] [Google Scholar]
- 21.Figueiredo LM, Cross GA, Janzen CJ. Epigenetic regulation in African trypanosomes: a new kid on the block. Nat Rev Microbiol. 2009;7:504–513. doi: 10.1038/nrmicro2149. [DOI] [PubMed] [Google Scholar]
- 22.Clayton CE. Life without transcriptional control? From fly to man and back again. EMBO J. 2002;21:1881–1888. doi: 10.1093/emboj/21.8.1881. [DOI] [PMC free article] [PubMed] [Google Scholar]
- 23.Asio SM, Simonsen PE, Onapa AW. Analysis of the 24-h microfilarial periodicity of Mansonella perstans. Parasitol Res. 2009;104:945–948. doi: 10.1007/s00436-008-1312-x. [DOI] [PubMed] [Google Scholar]
- 24.Lindstrom KM, et al. Feather mites and internal parasites in small ground finches (Geospiza fuliginosa, Emberizidae) from the Galapagos Islands (Equador) J Parasitol. 2009;95:39–45. doi: 10.1645/GE-1655.1. [DOI] [PubMed] [Google Scholar]
- 25.Gryczynska A, Dolnik O, Mazgajski TD. Parasites of Chaffinch (Fringilla coelebs) population. Part I. Coccidia (Protozoa, Apicomplexa) Wiadomosci parazytologiczne. 1999;45:495–500. [PubMed] [Google Scholar]
- 26.Dolnik OV, Metzger BJ, Loonen MJ. Keeping the clock set under the midnight sun: diurnal periodicity and synchrony of avian Isospora parasites cycle in the High Arctic. Parasitology. 2011;138:1077–1081. doi: 10.1017/S0031182011000795. doi:S0031182011000795 [pii] 10.1017/S0031182011000795. [DOI] [PubMed] [Google Scholar]
- 27.Hawking F. The clock of the malaria parasite. Scientific American. 1970;222:123–131. doi: 10.1038/scientificamerican0670-123. [DOI] [PubMed] [Google Scholar]
- 28.Thaiss CA, et al. Transkingdom control of microbiota diurnal oscillations promotes metabolic homeostasis. Cell. 2014;159:514–529. doi: 10.1016/j.cell.2014.09.048. [DOI] [PubMed] [Google Scholar]
- 29.Zarrinpar A, Chaix A, Yooseph S, Panda S. Diet and feeding pattern affect the diurnal dynamics of the gut microbiome. Cell Metab. 2014;20:1006–1017. doi: 10.1016/j.cmet.2014.11.008. [DOI] [PMC free article] [PubMed] [Google Scholar]
- 30.Curtis AM, Bellet MM, Sassone-Corsi P, O’Neill LA. Circadian Clock Proteins and Immunity. Immunity. 2014;40:178–186. doi: 10.1016/j.immuni.2014.02.002. [DOI] [PubMed] [Google Scholar]
- 31.Brady J, C AJ. The control of circadian activity rhythms in tsetse flies: environment or physiological clock? Physiological Entomology. 1978;3:177–190. [Google Scholar]
- 32.MacGregor P, Savill NJ, Hall D, Matthews KR. Transmission stages dominate trypanosome within-host dynamics during chronic infections. Cell Host Microbe. 2011;9:310–318. doi: 10.1016/j.chom.2011.03.013. doi:S1931-3128(11)00100-4 [pii] 10.1016/j.chom.2011.03.013. [DOI] [PMC free article] [PubMed] [Google Scholar]
- 33.Bass J, Takahashi JS. Circadian integration of metabolism and energetics. Science. 2010;330:1349–1354. doi: 10.1126/science.1195027. doi:330/6009/1349 [pii] 10.1126/science.1195027. [DOI] [PMC free article] [PubMed] [Google Scholar]
- 34.Engstler M, Boshart M. Cold shock and regulation of surface protein trafficking convey sensitization to inducers of stage differentiation in Trypanosoma brucei. Genes Dev. 2004;18:2798–2811. doi: 10.1101/gad.323404. [DOI] [PMC free article] [PubMed] [Google Scholar]
- 35.Hirumi H, Hirumi K. Continuous cultivation of Trypanosoma brucei blood stream forms in a medium containing a low concentration of serum protein without feeder cell layers. J Parasitol. 1989;75:985–989. [PubMed] [Google Scholar]
- 36.Knusel S, Roditi I. Insights into the regulation of GPEET procyclin during differentiation from early to late procyclic forms of Trypanosoma brucei. Mol Biochem Parasitol. 2013;191:66–74. doi: 10.1016/j.molbiopara.2013.09.004. [DOI] [PubMed] [Google Scholar]
- 37.Cox MP, Peterson DA, Biggs PJ. SolexaQA: At-a-glance quality assessment of Illumina second-generation sequencing data. BMC bioinformatics. 2010;11:485. doi: 10.1186/1471-2105-11-485. [DOI] [PMC free article] [PubMed] [Google Scholar]
- 38.Langmead B, Trapnell C, Pop M, Salzberg SL. Ultrafast and memory-efficient alignment of short DNA sequences to the human genome. Genome Biol. 2009;10:R25. doi: 10.1186/gb-2009-10-3-r25. [DOI] [PMC free article] [PubMed] [Google Scholar]
- 39.Lawrence M, et al. Software for computing and annotating genomic ranges. PLoS computational biology. 2013;9:e1003118. doi: 10.1371/journal.pcbi.1003118. [DOI] [PMC free article] [PubMed] [Google Scholar]
- 40.Biostrings: String objects representing biological sequences, and matching algorithms.
- 41.Lawrence M, Gentleman R, Carey V. rtracklayer: an R package for interfacing with genome browsers. Bioinformatics. 2009;25:1841–1842. doi: 10.1093/bioinformatics/btp328. [DOI] [PMC free article] [PubMed] [Google Scholar]
- 42.Huber W, et al. Orchestrating high-throughput genomic analysis with Bioconductor. Nat Methods. 2015;12:115–121. doi: 10.1038/nmeth.3252. [DOI] [PMC free article] [PubMed] [Google Scholar]
- 43.gplots: Various R Programming Tools for Plotting Data. 2015 [Google Scholar]
- 44.Wichert S, Fokianos K, Strimmer K. Identifying periodically expressed transcripts in microarray time series data. Bioinformatics. 2004;20:5–20. doi: 10.1093/bioinformatics/btg364. [DOI] [PubMed] [Google Scholar]
- 45.Hughes ME, Hogenesch JB, Kornacker K. JTK_CYCLE: an efficient nonparametric algorithm for detecting rhythmic components in genome-scale data sets. J Biol Rhythms. 2010;25:372–380. doi: 10.1177/0748730410379711. [DOI] [PMC free article] [PubMed] [Google Scholar]
- 46.Yang R, Su Z. Analyzing circadian expression data by harmonic regression based on autoregressive spectral estimation. Bioinformatics. 2010;26:i168–174. doi: 10.1093/bioinformatics/btq189. [DOI] [PMC free article] [PubMed] [Google Scholar]
- 47.Kurt Hornik BG. movMF: An R Package for Fitting Mixtures of von Mises-Fisher Distributions. Journal of Statistical Software. 2014:1–31. [Google Scholar]
- 48.Siepka SM, Takahashi JS. Methods to record circadian rhythm wheel running activity in mice. Methods Enzymol. 2005;393:230–239. doi: 10.1016/S0076-6879(05)93008-5. doi:S0076687905930085 [pii] 10.1016/S0076-6879(05)93008-5. [DOI] [PMC free article] [PubMed] [Google Scholar]
- 49.Siepka SM, et al. Circadian mutant Overtime reveals F-box protein FBXL3 regulation of cryptochrome and period gene expression. Cell. 2007;129:1011–1023. doi: 10.1016/j.cell.2007.04.030. doi:S0092-8674(07)00541-7 [pii] 10.1016/j.cell.2007.04.030. [DOI] [PMC free article] [PubMed] [Google Scholar]
- 50.Falcon S, Gentleman R. Using GOstats to test gene lists for GO term association. Bioinformatics. 2007;23:257–258. doi: 10.1093/bioinformatics/btl567. [DOI] [PubMed] [Google Scholar]
Associated Data
This section collects any data citations, data availability statements, or supplementary materials included in this article.
Supplementary Materials
Data Availability Statement
The RNA-seq datasets are often referred to as CW for cold/warm alternating conditions, WW for warm/warm constant conditions, LD light/dark alternating conditions and DD for dark/dark constant conditions. RPKM and circadian oscillation analysis of all these datasets are available in the present manuscript as Supplementary Data 1–3. RNA-seq datasets generated as part of this study have also been submitted to the ArrayExpress database (https://www.ebi.ac.uk/arrayexpress/) under accession ID E-MTAB-4952.