Abstract
Brain-derived neurotrophic factor (BDNF) and its receptor TrkB are crucial for many forms of neuronal plasticity1, 2, 3, 4, 5, 6, including structural long-term potentiation (sLTP)7, 8, which is a correlate of an animal’s learning7, 9, 10, 11, 12. However, it is unknown whether BDNF release and TrkB activation occur during sLTP, and if so, when and where. Here, using a fluorescence resonance energy transfer-based sensor for TrkB and two-photon fluorescence lifetime imaging microscopy13, 14, 15, 16, we monitor TrkB activity in single dendritic spines of CA1 pyramidal neurons in cultured murine hippocampal slices. In response to sLTP induction9, 14, 15, 16, we find fast (onset < 1 min) and sustained (>20 min) activation of TrkB in the stimulated spine that depends on NMDAR (N-methyl-d-aspartate receptor) and CaMKII signalling and on postsynaptically synthesized BDNF. We confirm the presence of postsynaptic BDNF using electron microscopy to localize endogenous BDNF to dendrites and spines of hippocampal CA1 pyramidal neurons. Consistent with these findings, we also show rapid, glutamate-uncaging-evoked, time-locked BDNF release from single dendritic spines using BDNF fused to superecliptic pHluorin17, 18, 19. We demonstrate that this postsynaptic BDNF–TrkB signalling pathway is necessary for both structural and functional LTP20. Together, these findings reveal a spine-autonomous, autocrine signalling mechanism involving NMDAR–CaMKII-dependent BDNF release from stimulated dendritic spines and subsequent TrkB activation on these same spines that is crucial for structural and functional plasticity.
To address the role of BDNF–TrkB signalling in sLTP, we developed a fluorescence resonance energy transfer (FRET)-based sensor for TrkB consisting of two components: (1) TrkB fused to monomeric enhanced green fluorescent protein (TrkB–eGFP), and (2) an SH2 domain of the TrkB binding partner phospholipase Cγ1 (PLC-γ1)21 fused to two copies of monomeric red fluorescent protein-1 (mRFP1–PLC–mRFP1; Fig. 1a and Supplementary Information). After TrkB activation via phosphorylation of Tyr816, the affinity of mRFP1–PLC–mRFP1 for TrkB–eGFP increases21, thereby allowing FRET to occur between the fluorophores (Supplementary Information). We validated the sensor in HeLa cells and cultured cortical neurons by showing it to be sensitive to BDNF, specific for Tyr816phosphorylation, and reversible when imaged by two-photon fluorescence lifetime imaging microscopy (2pFLIM) (Extended Data Fig. 1, Supplementary Information). Furthermore, we demonstrated that the sensor could functionally replace endogenous TrkB in neurons of cultured hippocampal slices (Extended Data Fig. 2, Supplementary Information).
Figure 1. sLTP induces rapid, persistent, and largely spine specific TrkB activation.
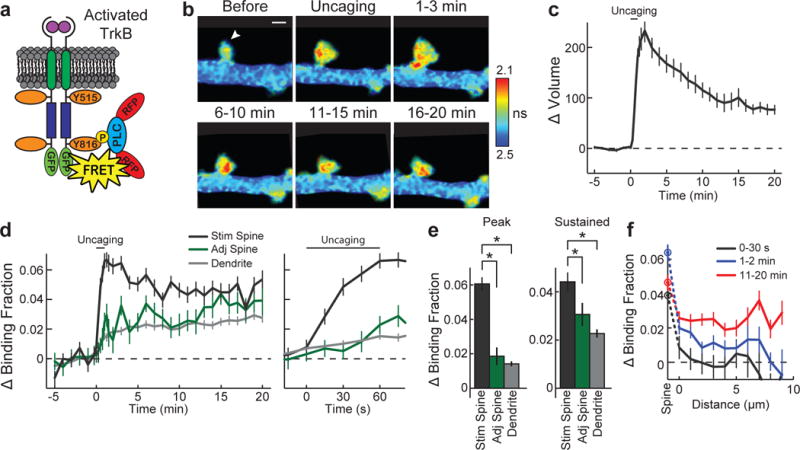
a, Sensor design. b, 2pFLIM images of TrkB activation averaged across indicated time points. Arrowhead represents point of uncaging. Warmer colours indicate shorter lifetimes and higher TrkB activity. Image size is 6.8 × 4.4 μm. c, Time course of volume change for the stimulated spine. n = 50 cells/54 spines. d, e, Time course (d) and quantification (e) of peak (1.25–2 min) and sustained (10–20 min) activation for experiments in c measured as the change in sensor binding fraction in stimulated spines, adjacent spines and dendrites. Right panel in d shows magnified time course. n = 50/54 for stimulated spines and dendritic shafts, and 50/59 for adjacent spines (cells/spines). f, Spatial profile of TrkB activation—change in binding fraction of the dendrite plotted as a function of the distance from the stimulated spine. n = 48/52 (cells/stimulated spines). Data are mean ± s.e.m. *P < 0.05, analysis of variance (ANOVA) with Dunnet’s test.
Using this sensor, we biolistically transfected cultured rat hippocampal slices and imaged CA1 pyramidal neurons with 2pFLIM. In response to glutamate uncaging targeted to a single dendritic spine (30 pulses at 0.5 Hz), spine volume rapidly increased by ~220% (transient phase) before relaxing to an increased state of ~90% lasting at least 60 min (sustained phase; Fig. 1b, c, Extended Data Fig. 3a)—changes independent of protein synthesis (Extended Data Fig. 3c, d) and largely consistent with previous descriptions of sLTP (Extended Data Fig. 3a, Supplementary Information)9, 14, 15, 16. At the same time, TrkB rapidly activated in the stimulated spine, peaking at ~1–2 min and remaining elevated for at least 60 min (Fig. 1b, d, e, Extended Data Figs 3b, 4 and Supplementary Information). For the first 30–60 s after the onset of glutamate uncaging, this activation was largely restricted to the stimulated spine (Fig. 1d–f, Supplementary Information). However, with time, TrkB activation in adjacent regions slowly increased, suggesting spreading of TrkB activation (Fig. 1d–f). The validity of the observed signal was confirmed by its dependence on kinase activity and Tyr816 phosphorylation and independence of sensor concentration and temperature (Extended Data Figs 5, 6, 7, Supplementary Information).
To explore mechanisms underlying this TrkB activation, we asked whether it required NMDAR-mediated Ca2+ influx7, 9, 15, 16 and subsequent CaMKII activation9, 15. Application of either the NMDAR inhibitor d-2-amino-5-phosphonovalerate (d-AP5; 100 μM) or the CaMKII inhibitor CN21 (ref. 22; 10 μM) impaired TrkB activation during the transient and sustained phases of sLTP while also inhibiting spine volume change (Fig. 2a–d), suggesting that TrkB is in part downstream of both NMDAR and CaMKII activation.
Figure 2. TrkB activation during sLTP depends on NMDAR-CaMKII signalling and post-synaptic BDNF.
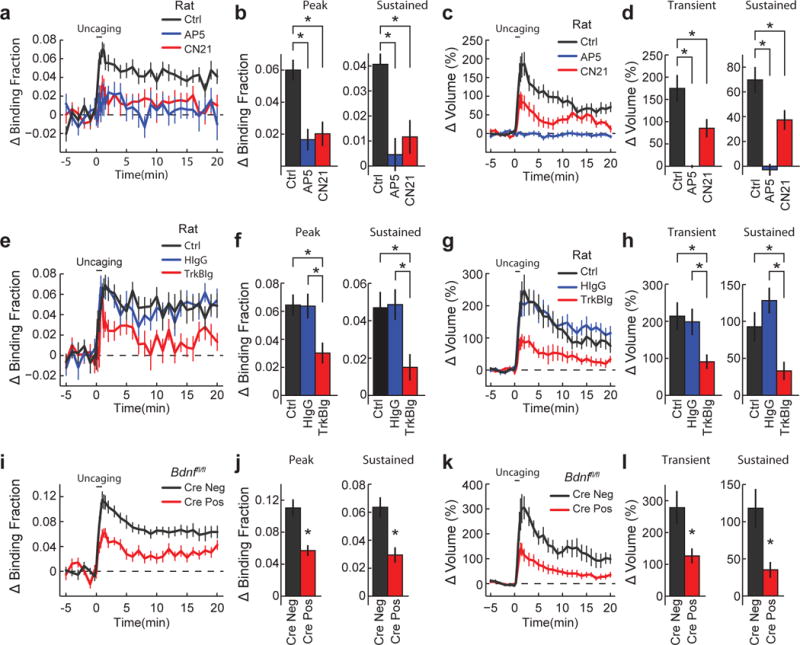
a, b, Time course (a) and quantification (b) of peak and sustained TrkB activation in stimulated spines in the presence of pharmacological inhibitors. Ctrl, control; AP5 denotes an NMDAR inhibitor; CN21 denotes a CaMKII inhibitor. n = 19/19 control, 6/10 AP5, and 7/16 CN21 (cells/spines). c, d, Time course (c) and quantification (d) of transient (1–2 min) and sustained (10–20 min) spine volume change for experiments in a and b. e–h, Similar experiments to a–d but with different pharmacological conditions. HIgG, human IgG; TrkB-Ig, an extracellular scavenger of BDNF. n = 16/18 control, 6/11 HIgG, and 8/14 TrkB-Ig (cells/spines). i–l, Similar experiments to a–d but in Bdnffl/fl hippocampal slices transfected with the TrkB sensor with or without Cre-recombinase (Cre− or Cre+, respectively). n = 7/15 Cre− and 9/17 Cre+ (cells/spines). Data are mean ± s.e.m. *P < 0.05, ANOVA with Dunnet’s test (b, d), Tukey’s test (f, h) or a two-tailed t-test (j, l).
Next, we asked whether BDNF contributes to this TrkB activation. Using the extracellular BDNF scavenger TrkB-Ig (6–8 μg ml−1), we found impaired TrkB activation throughout sLTP with a similar impairment of spine volume change (Fig. 2e–h), suggesting a crucial role for BDNF in mediating glutamate-uncaging-induced TrkB activation. To examine the cellular source of BDNF underlying this activation, we sparsely transfected the sensor with Cre recombinase in slices from Bdnffl/fl mice, thereby selectively knocking-out BDNF synthesized in the postsynaptic cell, a perturbation without detectable effect on basal spine morphology23, 40, 41 (Extended Data Fig. 8a, b). This manipulation attenuated glutamate-uncaging-evoked TrkB activation and sLTP (Fig. 2i–l) while leaving CaMKII activation intact (Extended Data Fig. 8c–f). These results implicate autocrine BDNF as one mechanism underlying TrkB activation during sLTP: additional mechanisms could include other sources of BDNF (pre-synaptic, paracrine) or non-neurotrophin TrkB activators (such as zinc)24.
The dependence of glutamate-uncaging-induced TrkB activation on postsynaptically synthesized BDNF controversially suggests the existence of BDNF in dendrites or spines25. To provide more direct evidence, we used electron microscopy to examine BDNF localization in a previously characterized mouse line in which a C-terminal haemagglutinin (HA) epitope tag was added to the Bdnf coding sequence (Bdnf-HA)26. Using highly sensitive antibodies against the HA-tag, we found BDNF not only in axons but also in dendrites and spines of CA1 pyramidal cells of these mice (Fig. 3).
Figure 3. Endogenous BDNF localizes to axons, dendrites, and dendritic spines.
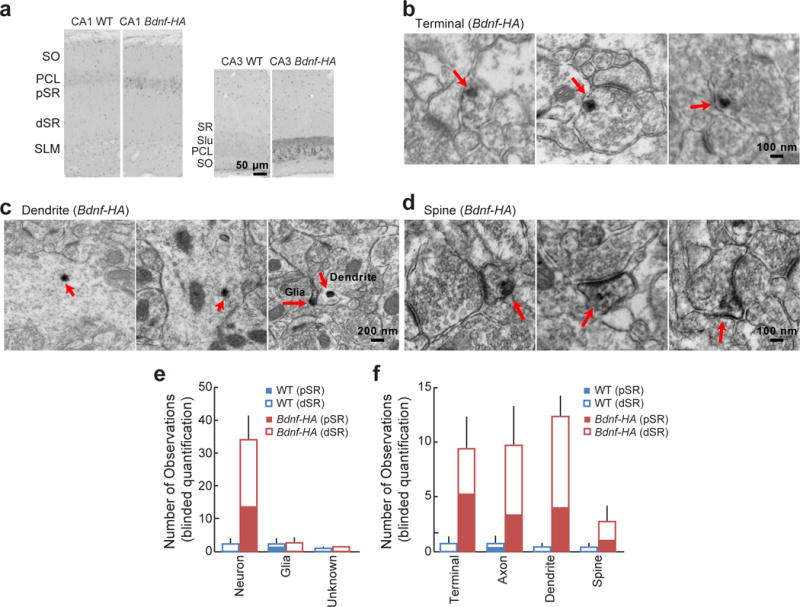
a, Immunoperoxidase labelling of HA in hippocampal areas CA1 (left) and CA3 (right) from Bdnf-HA and wild-type (WT) mice, visualized by light microscopy. dSR, distal stratum radiatum; PCL, principal cell layer; pSR, proximal stratum radiatum; SLM, stratum lacunosum-moleculare; SO, stratum oriens. b–d, Immunoperoxidase labelling of HA in CA1 pyramidal neuron axon terminals (b), dendrites (c), and dendritic spines (d) of Bdnf-HA mice, visualized by electron microscopy. e, f, Quantification of observed immunoperoxidase labelling of HA in various cellular types (e) and subcellular compartments (f) in proximal and distal stratum radiatum in hippocampal slices from wild-type and Bdnf-HA mice. n = 3 animals each.
The localization of BDNF to dendritic spines, together with the rapid kinetics and initial spine restriction of glutamate-uncaging-induced TrkB activation, suggested an equally rapid release of BDNF from dendritic spines during the transient phase of sLTP. To assess this possibility, we used biolistics to transfect CA1 pyramidal cells with full-length BDNF containing the pH-sensitive fluorophore superecliptic pHluorin (SEP) fused to its C terminus, thus allowing visualization of exocytosed BDNF18, 19 (Extended Data Fig. 9a, Supplementary Information). In response to glutamate uncaging, we observed an increase in SEP fluorescence largely restricted to the stimulated spine (Fig. 4a, b, Supplementary Video 1), with two distinct kinetic profiles. The first was a transient, spike-like increase time-locked to each uncaging pulse (Fig. 4a–c), perhaps correlating with activity-induced BDNF release. The second was a slow increase in fluorescence commencing with the start of uncaging and peaking at its end, perhaps due to extracellular accumulation of released BDNF–SEP (Fig. 4a, b). After termination of uncaging, SEP fluorescence decayed back to baseline over the course of 10 min (Extended Data Fig. 9e).
Figure 4. Glutamate uncaging induces rapid release of postsynaptic BDNF.
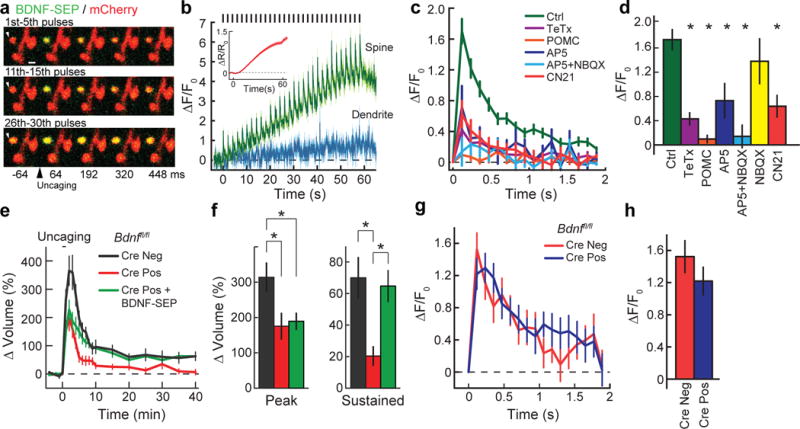
a, Two-photon images of glutamate-uncaging-evoked changes in BDNF–SEP fluorescence in dendritic spines of CA1 hippocampal neurons. Each row represents the uncaging-triggered average of the BDNF–SEP signal in response to individual uncaging pulses for the designated time window. Image size is 3.9 × 5.5 μm. b, Averaged time course of BDNF–SEP fluorescence change in spines and adjacent dendritic shafts in response to glutamate uncaging (timing of glutamate pulses indicated by black bars (top)). Inset shows the change in mCherry (mCh) fluorescence (red) in response to glutamate uncaging, indicative of spine volume change (sLTP). n = 26/187 (cells/spines). c, Uncaging-triggered average of the increase in BDNF–SEP fluorescence with glutamate uncaging. TeTx, neurons transfected with tetanus toxin, an inhibitor of exocytosis; POMC, neurons transfected with the POMC peptide, an inhibitor of activity-dependent BDNF release. n = 31/218 control, 6/82 TeTx, 2/29 POMC, 3/50 AP5, 2/46 AP5 + NBQX, 4/40 NBQX, and 7/88 CN21 (cells/spines). d, Peak of the uncaging-triggered averaged increase of BDNF–SEP fluorescence in c. e, Time course of glutamate-uncaging-induced spine volume change for Bdnffl/fl hippocampal slices transfected with eGFP (Cre−), eGFP plus Cre (Cre+), or eGFP, Cre and BDNF–SEP. n = 9/13 Cre−, 6/11 Cre+ and 8/13 Cre+ plus BDNF–SEP (cells/spines). f, Transient (1–2 min) and sustained (10–40 min) spine volume change for experiments in e. g, h, Similar experiments to c and d but in Bdnffl/fl hippocampal slices in the absence or presence of Cre. n = 10/105 Cre− and 15/132 Cre+ (cells/spines). Data are mean ± s.e.m. See Extended Data Fig. 9h for data in d represented as median ± interquartile interval. *P < 0.05, Kruskal–Wallis test with Dunn’s test (d) or an ANOVA with Tukey’s test (f).
Several lines of evidence suggested that these transient, spike-like increases in SEP fluorescence were in fact due to BDNF release from the spine. First, the observed fluorescence signal depended on pH, exocytosis, and BDNF sorting machinery27 (Fig. 4c, d, Extended Data Fig. 9d, Supplementary Information). Second, expression of BDNF–SEP rescued structural plasticity in the setting of postsynaptic BDNF knockout, thus suggesting that it could functionally replace endogenous BDNF in neurons (Fig. 4e, f, Supplementary Information). Third, the observed BDNF–SEP signal was independent of the presence of endogenous postsynaptic BDNF (Fig. 4g, h). Fourth, the kinetic profile of the signal paralleled the time course of TrkB activation, as one would expect for BDNF release (Extended Data Fig. 4). Collectively, these results suggest that the observed increase in SEP signal probably reports glutamate-dependent exocytosis and release of BDNF from stimulated spines.
To explore mechanisms underlying glutamate-induced BDNF release, we inhibited NMDARs (with AP5) or AMPARs (with NBQX) individually and together as well as inhibiting CaMKII with CN21 (Fig. 4c, d). We found the SEP signal to be largely blocked (AP5), unaffected (NBQX), completely blocked (AP5 plus NBQX), and partially blocked (CN21) by these perturbations (Fig. 4c, d). These findings suggest that BDNF release from spines is largely NMDAR–CaMKII dependent, consistent with our results for TrkB activation.
The converging evidence implicating autocrine BDNF–TrkB signalling in sLTP led us to ask whether this pathway was also involved in functional LTP (fLTP) at the CA3–CA1 synapse. To address this question, we induced fLTP by pairing low-frequency Schaffer collateral axon stimulation with depolarization of single CA1 pyramidal cells through whole-cell patch clamping. First, we examined the role of TrkB by using knock-in mice containing a point mutation in the TrkB kinase domain (F616A; TrkbF616A, also known as Ntrk2F616A), rendering the mutant TrkB uniquely susceptible to inhibition by the small molecule 1NMPP1 (ref. 28). 1NMPP1 inhibited both sLTP (in cultured slices) and fLTP (in acute slices) in slices isolated from TrkbF616A but not wild-type mice, revealing a requirement for TrkB kinase (Fig. 5a–d). In addition, scavenging extracellular BDNF with TrkB-Ig (2 μg ml−1) impaired both sLTP (in cultured slices) and fLTP (in acute slices) (Extended Data Fig. 10a–d), implicating BDNF as one mechanism underlying TrkB activation in this context.
Figure 5. Functional and structural LTP depends on post-synaptic BDNF-TrkB signalling.
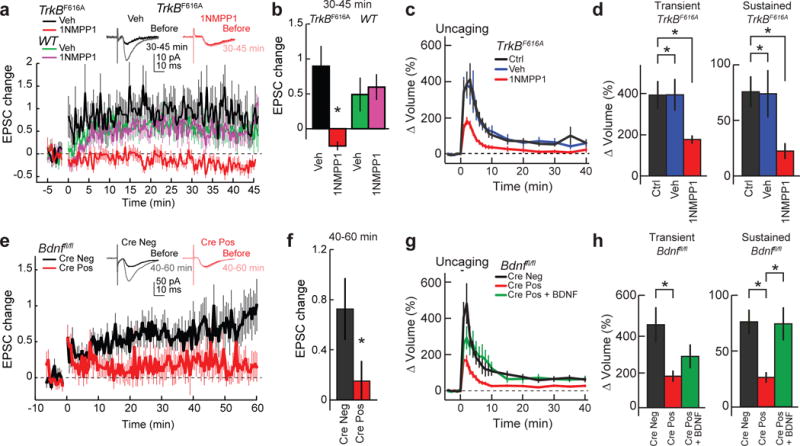
a, b, Time course (a) and quantification (b; 30–45 min) of excitatory postsynaptic current (EPSC) change recorded in CA1 pyramidal cells of hippocampal slices from TrkbF616A and wild-type mice, before and after LTP induction in the presence of vehicle or 1NMPP1. Representative traces of TrkbF616A slices with vehicle or 1NMPP1 are shown above the graphs. n = 11 TrkbF616A vehicle, 10 TrkbF616A 1NMPP1, 11 wild-type vehicle, and 13 wild-type 1NMPP1 (cells). c, d, Time course (c) and quantification (d) of transient and sustained glutamate-uncaging-induced spine volume change for TrkbF616A hippocampal slices in the absence or presence of vehicle or 1NMPP1. n = 20/20 control, 10/13 vehicle, and 16/20 1NMPP1 (cells/spines). e–h, Similar experiments to a and b but from Bdnffl/fl mice infected with or without Cre. Representative traces are shown above the graphs. n = 20 Cre− and 19 Cre+ (cells). g, h, Time course (g) and quantification (h) of transient and sustained glutamate-uncaging-induced spine volume change for Bdnffl/fl hippocampal slices transfected with eGFP or eGFP plus Cre. For Cre+ plus BDNF, Cre-positive cells were treated with BDNF for 10 min before glutamate uncaging. n = 13/14 Cre−, 22/32 Cre+, and 6/7 Cre+ plus BDNF (cells/spines). Data are mean ± s.e.m. *P < 0.05, two-tailed t-test (b, f) or ANOVA with Tukey’s test (d, h).
To determine whether autocrine BDNF–TrkB signalling in particular contributed to these forms of plasticity, we knocked out BDNF in a small population of CA1 pyramidal cells using either in utero infection of adeno-associated virus encoding synapsin-Cre in Bdnffl/fl mice for fLTP in acute slices or biolistic transfection of Cre in organotypic slices prepared from Bdnffl/fl mice for sLTP. The knockout of postsynaptic BDNF impaired both fLTP and sLTP, the latter of which was rescued by bath-applied BDNF (20 ng ml−1 for 10 min) (Fig. 5e–h). Collectively, these results reveal a requirement of a cell-autonomous, postsynaptic BDNF release and subsequent activation of postsynaptic TrkB for both structural and functional synaptic plasticity (Extended Data Fig. 10e, Supplementary Information).
Overall, we have described an autocrine signalling system within a single spine achieved by rapid BDNF release from the stimulated spine and subsequent TrkB activation on the same spine that, potentially in cooperation with other sources of BDNF and activators of TrkB, is essential for both structural and functional plasticity.
Methods
Reagents
Human recombinant BDNF and human recombinant β-NGF were purchased from Millipore, K252a and d-2-amino-5-phosphonovalerate (d-AP5) and 2,3-dihydroxy-6-nitro-7-sulfamoyl-benzo[f]quinoxaline-2,3-dione (NBQX) were from Tocris, human-IgG was from Sigma, and 1′-naphthylmethyl-4-amino-1-tert-butyl-3-(p-methylphenyl)pyrazolo[3,4-d] pyrimidine (1NMPP1) was from Santa Cruz and Shanghai Institute of Materia Medica, Chinese Academy of Sciences. TrkB-Ig was a gift from Regeneron and the tat-CN21 peptide (YGRKKRRQRRRKRPPKLGQIGRSKRVVIEDDR) was synthesized by GenScript.
Plasmids
TrkB–eGFP was prepared by inserting the coding sequence of mouse TrkB (obtained from a previously described plasmid29) into pEGFP-N1 (Clontech) containing the A206K monomeric mutation in eGFP and the CAG promoter30. The linker between TrkB and eGFP is TGRH. mRFP1–PLC–mRFP1 was prepared by inserting the coding sequence for the C-terminal SH2 domain of human PLC-γ1 (659–769; obtained from full-length, human PLC-γ1 purchased from Origene) into a tandem-mRFP1 plasmid containing the CAG promoter. The linkers between the mRFP1s and PLC-γ1 (659–769) are RSRAQASNS for the N terminus and GSG for the C terminus. TrkBY816F–eGFP was prepared by introducing a point mutation using the Site-Directed Mutagenesis Kit (Stratagene). Tandem mCherry (mCh–mCh) was generated as previously described16. HA–BDNF–Flag was a gift from A. West. The coding sequence for SEP (obtained from SEP-GluA1; ref. 31) was incorporated onto the 3′ end of HA–BDNF–Flag to generate HA–BDNF–Flag-SEP. HA–BDNF–Flag–mRFP1 was generated in a similar fashion. A plasmid containing mCh-IRES-TeTX was a gift from M. Ehlers. POMC-mCh was generated by amplifying the POMC peptide (MWCLESSQCQDLTTESNLLACIRACRLDL)27 using overhang PCR with a C-terminal linker (GGGGGGGGGGGGGGGGGGGGGGGGMADQLTEEWHRGTAGPGS). This amplicon was then inserted into the tandem mCh plasmid by replacing the coding sequence of the first mCh.
Animals
All animal procedures were approved by the Duke University School of Medicine Animal Care and Use Committee, Max Planck Florida Institute for Neuroscience, and Weill Cornell Medical College Institutional Animal Care and Use Committees and were conducted in accordance with the NIH Guide for the Care and Use of Laboratory Animals.
We used both male and female rats and mice. Rats and C57/B6 mice were obtained from Charles River, TrkbF616A mutant mice were provided by D. Ginty28, Bdnffl/fl and Trkbfl/fl mice were provided by L. Parada32, and Bdnf-HA mice were generated as previously described26. The genotype of each animal used was verified before and after preparing slices using PCR of genomic DNA isolated from tail DNA before and slice samples after.
Preparation of HeLa cells
HeLa cells were obtained from the Duke University Cell Culture Facility. These cells had been authenticated using short-tandem repeat profiling and evaluated for mycoplasma contamination. Cells were cultured and maintained as previously described16. Cells were transfected with Lipofectamine 2000 using the manufacturer’s protocol (Invitrogen). Concentrations used were 0.5 μl ml−1 Lipofectamine and 1 μg ml−1 total cDNA (1:1 ratio of TrkB–eGFP to mRFP1–PLC–mRFP1 DNA). Then, 24–48 h later, culture media was replaced with HEPES-buffered ACSF for imaging (HACSF; 20 mM HEPES, 130 mM NaCl, 2 mM NaHCO3, 25 mM d-glucose, 2.5 mM KCl and 1.25 mM NaH2PO4; adjusted to pH 7.4 and 310 mOsm). After a 30-min equilibration period, transfected cells were imaged using 2pFLIM as described below. Cell stimulation was performed by directly adding BDNF or vehicle to the HACSF bathing the cells.
Preparation of mixed cortical cultures
Mixed cortical cultures were prepared as described previously33 and transfected with Lipofectamine 2000 using a modified protocol. For transfection of neurons in 3.5 cm dishes, 1 μl Lipofectamine was mixed with 1 μg of plasmid DNA (1 μg per construct transfected) in 100 μl of culture media for 20 min. Culture media was removed from the 3.5 cm dish until only 1 ml remained. The Lipofectamine/DNA solution was added to the neurons for 45 min. At this point, all the media was removed and replaced with 2 ml conditioned culture media. After 24–48 h, culture media was replaced with HACSF. To stimulate cells, we added BDNF or NGF directly to the HACSF bathing the cells. 30 min after stimulation, we added K252a to the HACSF.
Preparation of organotypic hippocampal slices
Cultured hippocampal slices were prepared from post-natal day 5–7 rats or mice, as previously described34, in accordance with the animal care and use guidelines of Duke University Medical Center. After 5–12 days in culture, CA1 pyramidal neurons were transfected with biolistic gene transfer using gold beads (12 mg; Biorad) coated with plasmids containing 20–40 μg of total cDNA (TrkB sensor: 15 μg TrkB–eGFP and 15 μg mRFP1–PLC–mRFP1; TrkB sensor plus mCh: 5 μg TrkB–eGFP, 5 μg mRFP1–PLC–mRFP1, and 20 μg mCh–mCh; TrkB sensor plus mCh and Cre: 5 μg TrkB–GFP, 5 μg mRFP1–PLC–mRFP1, 5 μg tdTom-Cre, and 15 μg mCh–mCh; BDNF–SEP plus mCh: 20 μg BDNF–SEP and 10 μg mCh–mCh; BDNF–SEP plus TeTX: 20 μg BDNF–SEP and 10 μg mCh-IRES-TeTX; BDNF–SEP plus POMC: 20 μg BDNF–SEP and 10 μg POMC–mCh; eGFP: 20 μg eGFP; and eGFP plus Cre: 10 μg eGFP plus 10 μg tdTom-Cre). Neurons expressing the TrkB sensor were imaged 12–48 h after transfection. Neurons expressing the TrkB sensor with mCh or mCh plus Cre were imaged 5–7 days after transfection. The addition of the mCh proved critical in limiting the TrkB sensor expression thereby allowing neurons to survive longer with the sensor present. Neurons expressing only eGFP were imaged 1–7 days after transfection. Neurons expressing eGFP plus Cre were imaged 5–9 days after transfection.
2pFLIM
FRET imaging using a custom-built two-photon fluorescence lifetime imaging microscope was performed as previously described13, 35. Two-photon imaging was performed using a Ti-sapphire laser (MaiTai, Spectraphysics) tuned to a wavelength of 920 nm, allowing simultaneous excitation of eGFP, mRFP1 and mCh. All samples were imaged using <2 mW laser power measured at the objective. Fluorescence emission was collected using an immersion objective (60×, numerical aperture 0.9, Olympus), divided with a dichroic mirror (565 nm), and detected with two separate photoelectron multiplier tubes (PMTs) placed downstream of two wavelength filters (Chroma, HQ510-2p to select for green and HQ620/90-2p to select for red). The green channel was fitted with a PMT having a low transfer time spread (H7422-40p; Hamamatsu) to allow for fluorescence lifetime imaging, while the red channel was fitted with a wide-aperture PMT (R3896; Hamamatsu). Photon counting for fluorescence lifetime imaging was performed using a time-correlated single photon counting board (SPC-150; Becker and Hickl) controlled with custom software13, while the red channel signal was acquired using a separate data acquisition board (PCI-6110) controlled with Scanimage software36.
Two-photon glutamate uncaging
A second Ti-sapphire laser tuned at a wavelength of 720 nm was used to uncage 4-methoxy-7-nitroindolinyl-caged-l-glutamate (MNI-caged glutamate) in extracellular solution with a train of 4–6 ms, 4–5 mW pulses (30 times at 0.5 Hz) near a spine of interest. Experiments were performed in Mg2+ free artificial cerebral spinal fluid (ACSF; 127 mM NaCl, 2.5 mM KCl, 4 mM CaCl2, 25 mM NaHCO3, 1.25 mM NaH2PO4 and 25 mM glucose) containing 1 μM tetrodotoxin (TTX) and 4 mM MNI-caged l-glutamate aerated with 95% O2 and 5% CO2. Experiments were performed at 24–26 °C (room temperature) or 30–32 °C using a heating block holding the ACSF container. Temperature measurements were made from ACSF within the perfusion chamber holding the slice.
2pFLIM data analyses
To measure the fraction of donor bound to acceptor, we fit a fluorescence lifetime curve summing all pixels over a whole image with a double exponential function convolved with the Gaussian pulse response function:
in which τAD is the fluorescence lifetime of donor bound with acceptor, PD and PAD are the fraction of free donor and donor bound with acceptor, respectively, and H(t) is a fluorescence lifetime curve with a single exponential function convolved with the Gaussian pulse response function:
in which τD is the fluorescence lifetime of the free donor, τG is the width of the Guassian pulse response function, F0 is the peak fluorescence before convolution and t0 is the time offset, and erfc is the error function.
We fixed τD to the fluorescence lifetime obtained from free mEGFP (2.6 ns). To generate the fluorescence lifetime image, we calculated the mean photon arrival time, 〈t〉, in each pixel as:
then, the mean photon arrival time is related to the mean fluorescence lifetime, 〈τ〉, by an offset arrival time, t0, which is obtained by fitting the whole image:
For small regions-of-interest (ROIs) in an image (spines or dendrites), we calculated the binding fraction (PAD) as:
BDNF–SEP and BDNF–mRFP1 imaging
BDNF–SEP imaging was performed by interleaving 8 Hz two-photon imaging with two-photon glutamate uncaging (30 pulses at 0.5 Hz). Multiple (1–30) spines were imaged on each neuron. Change in BDNF–SEP fluorescence was measured as ΔF/F0 after subtracting background fluorescence. Uncaging-triggered averages were calculated as the average increase in SEP fluorescence after each individual uncaging pulse. Red fluorescence increase was smoothed using a 16-frame window.
For visualizing BDNF–mRFP1 localization in CA1 pyramidal neurons, images were obtained using a Leica SP5 laser scanning confocal microscope (Leica).
Spine volume analysis
During 2pFLIM and BDNF–SEP imaging (Figs 2, 3), spine volume was reported using the red fluorescent intensity from mRFP1 or mCh. For two-photon imaging without FLIM (Fig. 4), green fluorescent intensity from eGFP was used. In all experiments, spine volume was measured as the integrated fluorescent intensity after subtracting background (F). Spine volume change was calculated by F/F0, in which F0 is the average spine volume before stimulation. Additionally, to compare basal spine size/morphology between various conditions, maximal spine (Fmax(spine)) and dendrite (Fmax(dendrite)) fluorescent intensities were measured and the Fmax(spine)/Fmax(dendrite) ratio was calculated after subtracting background fluorescence.
In utero viral injection for single-cell BDNF knockout
E14.5/15.5 timed-pregnant Bdnffl/fl mice were deeply anaesthetized using an isoflurane–oxygen mixture. The uterine horns were exposed and approximately 1–2 μl of AAV solution mix (containing AAV1.CAG.EGFP, AAV1.CAG.Flex.tdTomato and AAV1.hSyn.Cre, all from U Penn vector core) was injected through a pulled-glass capillary tube into the right lateral ventricle of each embryo. To achieve sufficient labelling of eGFP CA1 neurons alongside sparse expression of Cre + BDNF knockout tdTomato neurons, eGFP and Flex-tdTomato viruses were used at concentration of ~1012 viral genome copies per μl, and Cre was diluted (~100-fold) in PBS at a dilution determined to achieve a sparse labelling density of Cre-positive CA1 neurons.
Functional LTP
LTP experiments in Fig. 5 and Extended Data Fig. 10 were performed in Max Planck Florida Institute (MPFI) and Duke University, respectively. Mice (wild type, TrkbF616A, or Bdnffl/fl age 21–42 days) were sedated by isoflurane inhalation, and the brain was removed and dissected in a chilled cutting solution (124 mM choline chloride, 2.5 mM KCl, 26 mM NaHCO3, 3.3 mM MgCl2, 1.2 mM NaH2PO4, 10 mM d-glucose and 0.5 mM CaCl2: MPFI or 110 mM sucrose, 60 mM NaCl, 3 mM KCl, 1.25 mM NaH2PO4, 28 mM NaHCO3, 0.5 mM CaCl2, 7.0 mM MgCl2, and 5 mM d-glucose. The solutions were saturated with 95% O2 plus 5% CO2, pH 7.4)37. Coronal slices (250 μm: MPFI) or transverse hippocampal slices (400 μm: Duke) were prepared and maintained in oxygenated ACSF (MPFI/Duke: 127/124 mM NaCl, 2.5/1.75 mM KCl, 10/11 mM d-glucose, 26/25 mM NaHCO3, 1.25/0 mM NaH2PO4, 0/1.25 mM KH2PO4, 1.3/2.0 MgCl2 and 2.4/2.0 CaCl2,) in a submerged chamber at 32–34 °C for at least 1 h before use.
Electrophysiological recordings were performed in ACSF (plus picrotoxin at MPFI). CA1 pyramidal neurons in acute hippocampal slices from wild-type and TrkbF616A mice were visualized using oblique illumination or differential interference contrast (DIC). For Bdnffl/fl experiments, Cre-negative (eGFP-expressing) and Cre-positive (tdTomato-expressing) neurons were identified and targeted with fluorescence microscopy. Patch pipettes (3–6 MΩ) were filled with an internal solution (130 mM K gluconate, 10 mM, Na phosphocreatine 4 mM MgCl2,4 mM NaATP, 0.3 mM MgGTP, 3 mM l-ascorbic acid and 10 mM HEPES, pH 7.4, and 310 mOsm at MPFI or K-gluconate 140 mM, HEPES 10 mM, EGTA 1 mM, NaCl 4 mM, Mg2ATP 4 mM, and Mg2GTP 0.3 mM, pH 7.25, and 290 mOsm at Duke). Series resistances (10–40 MΩ) and input resistances (100–300 MΩ) were monitored throughout the experiment using negative voltage steps. The membrane potential was held at −70 mV. Experiments were performed at room temperature (~21 °C) and slices were perfused with oxygenated ACSF. For TrkbF616A/wild-type experiments, 1NMMP1 or vehicle was added to the ACSF before stimulation. For TrkB-Ig experiments, slices were incubated in 2 μg ml−1 TrkB-Ig or control human IgG for at least 2 h before the experiments. EPSCs were evoked by extracellular stimulation of Schaffer collaterals using a concentric bipolar stimulating electrode (World Precision Instruments) at a rate of 0.03 Hz. LTP was induced by pairing a 2-Hz stimulation with a postsynaptic depolarization to 0 mV for 15 s (MPFI) or 75 s (Duke). EPSC potentiation was assessed for 30–45 min (for TrkbF616A experiments), 40–60 min (for Bdnffl/fl experiments) or 20–30 min (for TrkB-Ig experiments) after stimulation.
Immunoprecipitation
HeLa cells were transfected with the TrkB sensor (TrkB–eGFP and mRFP1–PLC–mRFP1) using Lipofectamine 2000 as described above. Then, 24–48 h after transfection, the media bathing the cells was exchanged for HEPES buffered ACSF for biochemistry (150 mM NaCl, 3 mM KCl, 10 mM HEPES pH 7.35, 20 mM glucose, and 310 mOsM). After a 30-min equilibration period, cells were stimulated with 100 ng ml−1 BDNF for 10 min. Following stimulation, cells were washed in ice-cold PBS (Gibco), and then lysed in modified RIPA buffer (50 mM Tris-HCl pH 7.4, 150 mM NaCl, 1% NP-40, 0.25% sodium deoxycholate, 1 mM EDTA, 1 mM PMSF, 1 mM Na3VO4, and protease inhibitors) for 10 min on ice. The supernatant was collected after a 10 min centrifugation at 16,000g at 4 °C. At this point, a small volume of the supernatant was added to SDS-sample buffer and saved as the ‘cell lysate’ sample. The remaining supernatant was pre-cleared using protein G Sepharose beads (25 μl, Roche) for 30 min at 4 °C. After pre-clearing, the supernatant was incubated with 20 μg mouse monoclonal anti-phosphotyrosine (BD Transduction Labs) at 4 °C overnight. The immunocomplexes were precipitated with protein G Sepharose beads (50 μl) for 3 h at 4 °C and then analysed with western blotting. Antibodies used in western blotting included TrkB (Millipore), GFP (Abcam), actin (Sigma), and pTrkB(Y515) (Sigma).
Electron microscopic immunohistochemistry
Male adult (~2–3 months old) Bdnf-HA knock-in mice26 and aged matched wild-type C57/BL mice were used. The same investigator (T.A.M.) perfused all mice (Bdnf-HA and wild type) to maintain consistency between groups. Mice (3 per group) were deeply anaesthetized with sodium pentobarbital (150 mg kg−1, i.p.) and perfused sequentially through the ascending aorta with: (1) ~5 ml saline (0.9%) containing 2% heparin, and (2) 30 ml of 3.75% acrolein and 2% paraformaldehyde in 0.1 M phosphate buffer (PB; pH 7.4)38. Following removal from the skull, the brain was post-fixed for in 2% acrolein and 2% paraformaldehyde in PB 30 min. Brains were then sectioned (40 μm thick) on a Vibratome and stored at −20 °C in cryoprotectant until use.
For each animal, two dorsal hippocampal sections were processed for immunoelectron microscopy (immunoEM) experiments using previously described methods38. Before immunohistochemical processing, sections were rinsed in PB, and experimental groups were coded with hole-punches so that tissue could be run in single crucibles, ensuring identical exposure to all reagents.
Before processing for immunolabelling, sections were treated with 1% sodium borohydride for 30 min to remove free aldehyde sites. Sections then were rinsed in PB followed by a rinse in 0.1 M Tris-saline (TS; pH 7.6) and then a 30 min incubation in 0.5% BSA in TS. Sections then were incubated in primary rabbit anti-HA (1:1,000; Sigma) in 0.025% Triton-X 100 and 0.1% BSA in TS for 1 day at room temperature and 4 days at 4 °C. Sections then were incubated in donkey anti-rabbit biotinylated IgG (1:400; Jackson Immunoresearch Laboratories) for 30 min followed by a 30 min incubation in avidin-biotin complex (ABC; Vectastain Elite Kit, Vector Laboratories) in TS (1:100 dilution). Sections were developed in 3,3′-diaminobenzidine (Sigma-Aldrich) and H2O2 in TS. All antibody incubations were performed in 0.1% BSA/TS and separated by washes in TS.
Sections were post-fixed in 2% osmium tetroxide for 1 h, dehydrated, and flat embedded in Embed-812 (EMS) between two sheets of Aclar plastic. Brain sections containing the CA1 and dentate gyrus were selected from the plastic embedded sections, glued onto Epon blocks and trimmed to 1 mm-wide trapezoids. Ultra-thin sections (70 nm thickness) through the tissue-plastic interface were cut with a diamond knife (EMS) on a Leica EM UC6 ultratome, and sections were collected on 400-mesh, thin-bar copper grids (EMS). Grids were then counterstained with uranyl acetate and Reynold’s lead citrate.
Ultrastructural analysis
An investigator blinded to animal condition performed the data collection and analysis. One section from each of Bdnf-HA and wild-type animals was analysed (n = 3 each group). The thin sections were examined and photographed on a Tecnai Biotwin transmission electron microscope (FEI). Cell profiles were identified by defined morphological criteria39. Dendritic profiles generally were postsynaptic to axon terminals and contained regular microtubule arrays. Dendritic spines also were usually postsynaptic to axon terminal profiles and sometimes contained a spine apparatus. Axon terminals contained small synaptic vesicles and occasional dense-core vesicles. Unmyelinated axons were profiles smaller than 0.15 μm that contained a few small synaptic vesicles and lacked a synaptic junction in the plane of section. Glial profiles were distinguished by the presence of glial filaments (astrocytic profiles), by the presence of microtubules and/or their tendency to conform irregularly to the boundaries of surrounding profiles. ‘Unknown profiles’ were those that contained immunoperoxidase reaction product but could not be definitively placed in one of the above categories.
From each block, 4 grid squares (each square was 55 × 55 μm2) each from the CA1 near stratum radiatum (nSR in Fig. 3; that is, adjacent to the pyramidal cell layer) and distal stratum radiatum (dSR in Fig. 3; that is, 50–150 μm away from the pyramidal cell layer) were randomly sampled for analysis. Thus, 12,100 μm2 was sampled for each area in each block. Grid squares were selected plastic-tissue interface to ensure even antibody tissue penetration38. Immunoperoxidase labelling for HA was evident as a characteristic, electron-dense DAB reaction product precipitate. All peroxidase labelled profiles from each square were photographed and categorized. Animal codes were not broken until all 6 blocks were analysed.
Statistical analysis
Sample sizes for all experiments were chosen based on signal-to-noise ratios identified in pilot experiments. Variances of all data sets were estimated and compared using Bartlett’s or Levene’s test before further statistical analysis. Randomization of animals and/or slices was not needed.
To evaluate distribution patterns of TrkB sensor activity, spine volume change, and BDNF–SEP signal, peak responses for each data set (the same points used for statistical comparisons) were subjected to a Shapiro–Wilk test for normality. TrkB sensor activity adhered to the null hypothesis (normal distribution) while spine volume change and BDNF–SEP signal did not.
Because TrkB sensor activity had a normal distribution, parametric statistics were used: paired and unpaired two-tailed t-test, ANOVA, and repeated-measures ANOVA with appropriate post-hoc analysis, as indicated in the figure legends and supplementary note. For t-tests, homoscedasticity between groups was evaluated using the F-test. If variance was unequal, Welch’s corrected t-test was performed. For ANOVA, homoscedasticity was evaluated with Bartlett’s test. For multiple comparisons of sensor activity, data were subjected to ANOVA or repeated-measures ANOVA followed by a post-hoc test to determine statistical significance. In cases where each condition was compared to all other conditions in the experiment, the Tukey–Kramer method was employed. In cases where each condition was compared to a single control, Dunnet’s test was used.
Since spine volume change had a non-normal distribution, data were log-transformed to resolve skewness and then analysed with parametric statistics (the same tests described above), as indicated in the figure legends.
For the BDNF–SEP signal, log-transformation of the data did not resolve the skewness. As such, non-parametric statistics were used—Wilcoxon rank-sum test and Kruskal–Wallis test with followed by a Dunn’s test.
Data were only excluded if obvious signs of poor cellular health (dendritic blebbing, spine collapse, etc.) were apparent.
Supplementary Material
Extended Data
Extended Data Figure 1. Design and development of a FRET-based sensor for TrkB activation.
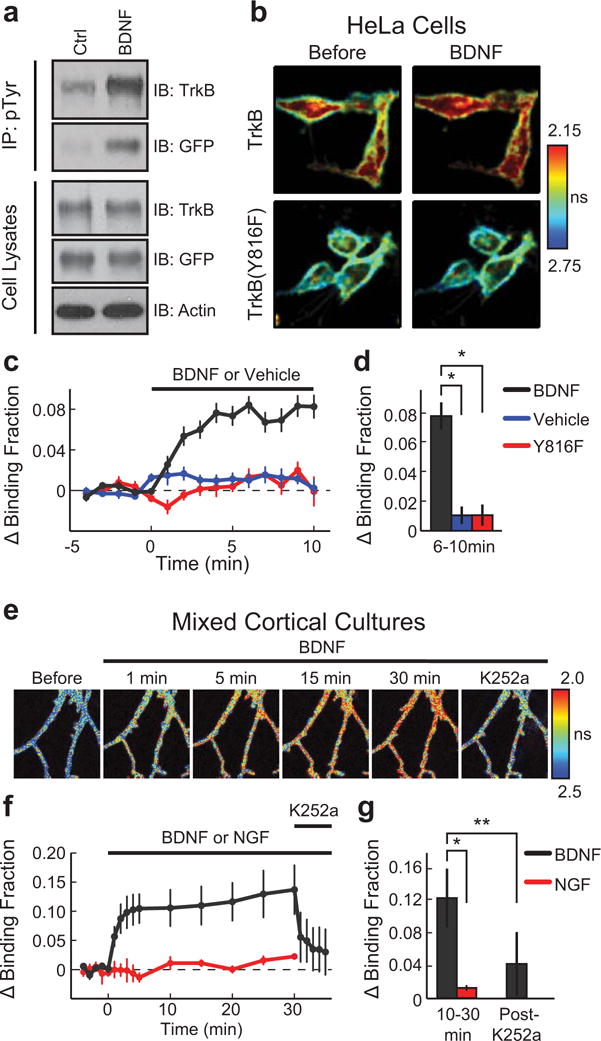
a, (Upper) Western blot analysis (IB) of cell extracts from HeLa cells stimulated with either BDNF or vehicle. Extracts were immunoprecipitated with an antibody for phosphorylated tyrosine residues (pTyr) and then probed with antibodies for TrkB and GFP. (Lower) IB of BDNF and vehicle stimulated cell extracts prior to IP using antibodies for TrkB, GFP, and actin. For source data, see Supplementary Figure 1.
b, FLIM images of TrkB and TrkBY816F activation acquired before and 2–6 min after BDNF stimulation (averaged multiple images taken over 5 min). Warmer colours indicate shorter lifetimes and higher TrkB activity.
c, Time course of TrkB and TrkBY816F activation measured as the change in binding fraction of TrkB-mEGFP or TrkBY816F-mEGFP bound to mRFP-PLC-mRFP before and after BDNF or vehicle stimulation. n = 22/8 TrkB plus BDNF, 9/4 TrkB plus vehicle, and 11/4 TrkBY816F plus BDNF (cells/experiments).
d, TrkB activation (averaged over 6–10 min) for experiments in (c).
e, FLIM images of TrkB activation in a neuron in a mixed cortical dissociated culture before and after BDNF stimulation followed by K252a application at 30 min.
f, Time course of TrkB activation measured as described in (c) before and after BDNF or NGF stimulation followed by K252a application. n = 8 BDNF and 4 NGF (neurons).
g, TrkB activation (averaged over 10–30 min and 3–5 min following K252a application) for experiments in (f).
Data are mean +/− s.e.m. *p < 0.05 as determined by a two-tailed unpaired samples t-test (g) or an analysis of variance (ANOVA) followed by Tukey’s method to correct for multiple comparisons. (d). **p < 0.05 as determined by a two-tailed paired samples t-test.
Extended Data Figure 2. Rescue of sLTP with TrkB-mEGFP following post- synaptic TrkB knockout.
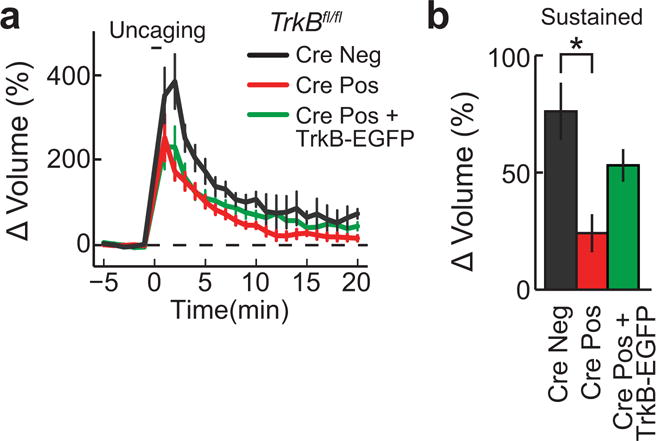
a-b, Time course (a) and quantification (b) of glutamate-uncaging-induced spine volume change for TrkBfl/fl hippocampal slices transfected with mEGFP (Cre Neg), mEGFP plus Cre (Cre Pos), and mCherry, TrkB-mEGFP, and Cre (Cre Pos + TrkB-EGFP). n = 7/20 Cre Neg, 9/24 Cre Pos, and 5/11 Cre Pos + TrkB-EGFP (cells/spines).
Data are means +/− s.e.m. *p < 0.05) as determined by an ANOVA followed by Tukey’s method to correct for multiple comparisons.
Extended Data Figure 3. Characterization of prolonged TrkB activation and spine volume change during single spine sLTP.
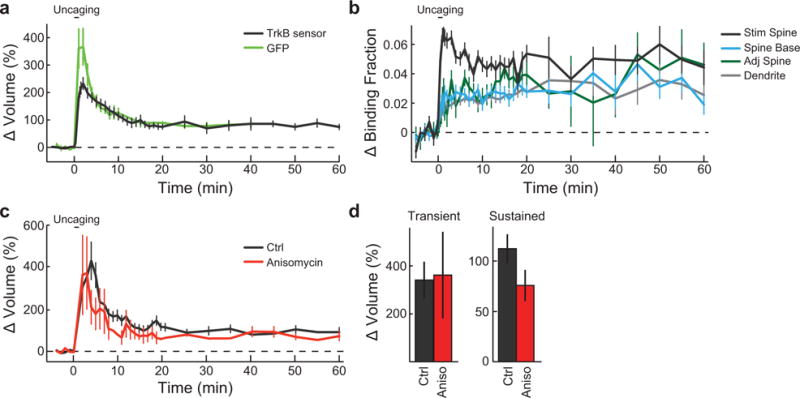
a, Prolonged time course of spine volume change following 2p-glutamate uncaging in rat hippocampal slices transfected with the TrkB sensor (TrkB) or mEGFP (GFP). n = 50/54 for TrkB sensor (9/10 for experiments longer than 20 min) and 8/8 for mEGFP (cells/spines).
b, Prolonged time course of TrkB activation in stimulated spines (Stim spine), the base of the spine neck (Spine base), adjacent spines (Adj spine), and the dendritic shaft adjacent to the stimulated spine (Dendrite). n = 50 cells with 54 Stim spine, Spine base, and Dendrite plus 59 Adj spine.
c-d, Time course (c) and quantification (d) of the transient (averaged over 1–2 min) and sustained (averaged over 20–40 min) phases of glutamate uncaging-induced spine volume change in rat hippocampal slices in the absence and presence of anisomycin (25 μM). n = 12/14 Ctrl and 5/5 anisomycin (cells/spines).
Data are mean +/− s.e.m.
Extended Data Figure 4. Comparison of temporal dynamics of BDNF release, TrkB activation, and spine volume change during single spine sLTP.

a, Time course of normalized changes in TrkB activity and spine volume change (percent of maximal activity and volume change).
b, Magnified view of normalized changes of BDNF-release, TrkB activation, and spine volume during and 1 minute after the uncaging epoch.
Extended Data Figure 5. Determination of the specificity of glutamate uncaging evoked TrkB activation.
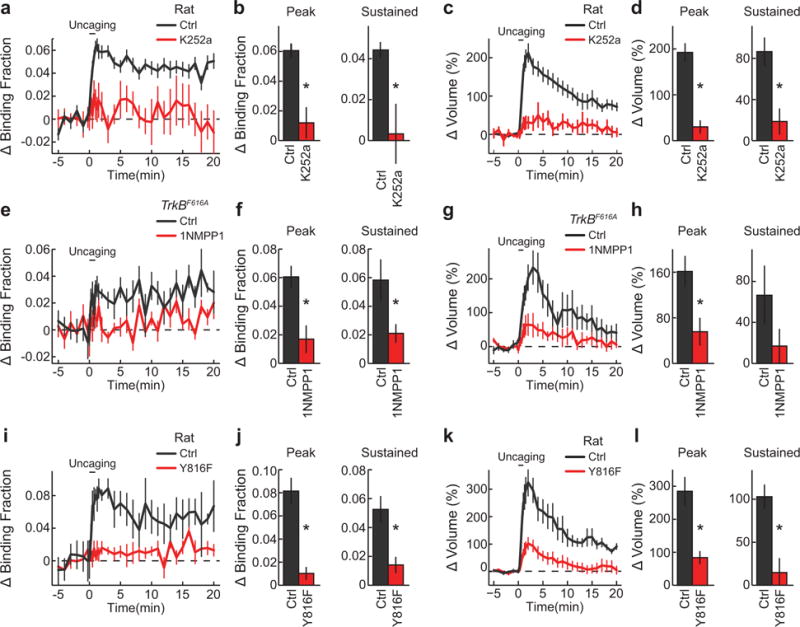
a, Time course of TrkB activation following glutamate uncaging before (Ctrl) and at least 30 min after K252a application to the perfusion bath (K252). n = 41/45 Ctrl and 4/9 K252a (cells/spines).
b, Peak (averaged over 1–2 min) and sustained (averaged over 10–20 min) TrkB activation for experiments in (a).
c, Time course of spine volume change for experiments in (a).
d, Transient and sustained spine volume change for experiments in (a).
e–h, Similar experiments with (a-d) but in TrkBF616A hippocampal slices transfected with the TrkBF616A sensor before (Ctrl) and at least 30 min after 1NMPP1 application (1NMPP1; 2μ;M). n = 4/5 Ctrl and 3/6 1NMPP1 (cells/spines).
i–l, Similar experiments with (a-d) but with the TrkB (Ctrl) and TrkBY816F (Y816F) sensors. n = 9/10 Ctrl and 7/11 Y816F (cells/spines).
Data are mean +/− s.e.m. *p<0.05 as determined by two-tailed unpaired samples t-test.
Extended Data Figure 6. Effect of temperature on the spatiotemporal dynamics of TrkB activation.
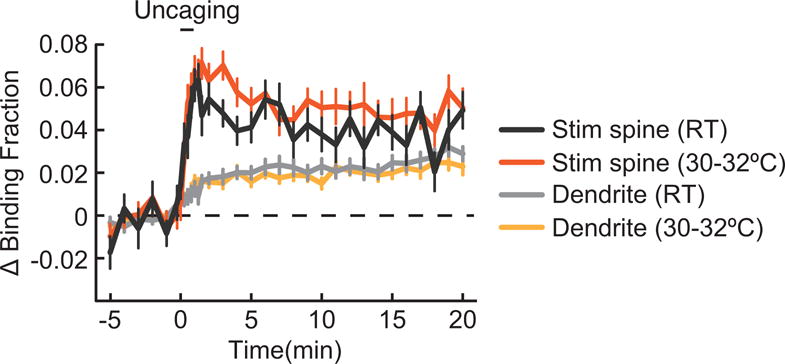
Time course of TrkB activation at room temperature (RT; 24–26°C) and 30–32°C in the stimulated (Stim spine) and dendrite. n = 20 spines and dendrites for RT and 25 for 30–32°C. Data are mean +/− s.e.m.
Extended Data Figure 7. Effects of sensor expression levels on changes reported by the sensor.
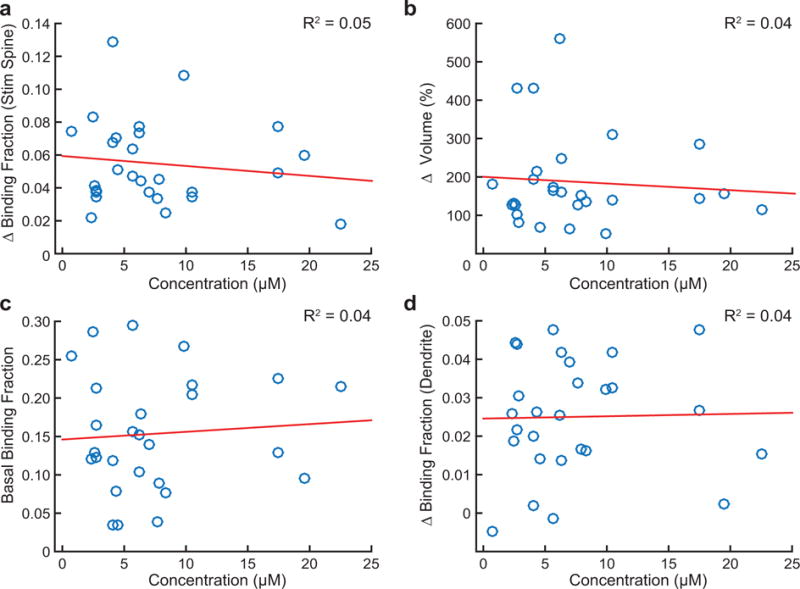
a-d, Effect of TrkB-mEGFP concentration as measured in individual neurons on corresponding change in binding fraction of the stimulated spine (a), change in spine volume (b), binding fraction prior to uncaging (basal binding fraction) (c), and change in binding fraction of the dendrite (d). n = 25/28 (cells/spines).
Data are mean values and were fit to a linear regression model with corresponding coefficients of determination (R2) provided for each.
Extended Data Figure 8. Basal spine size and CaMKII activation in the presence and absence of post- synaptic BDNF.
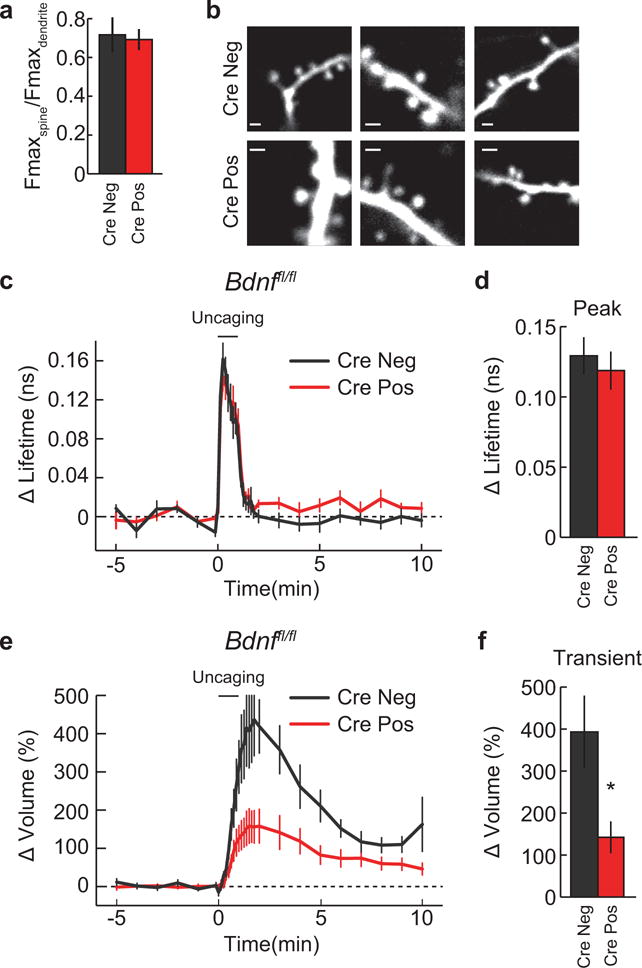
a-b, Quantification (a) and representative 2p images (f) of basal spine size/morphology in Bdnffl/fl slices transfected with EGFP (Cre Neg) or EGFP plus Cre (Cre Pos). n = 14/50 Cre Neg and 29/117 Cre Pos (cells/spines). Scale bar equates to 1μm.
c-d, Time course (c) and quantification (averaged over 0–45 s) (d) of CaMKII activation in Bdnffl/fl slices transfected with the CaMKII sensor (Cre Neg) or CaMKII plus Cre (Cre Pos). n = 7/13 Cre Neg and 7/15 for Cre Pos (cells/spines).
e-f, Time course and quantification of the transient phase of spine volume change for experiments in (c).
Data are mean +/− s.e.m. *p < 0.05 as determined by a two-tailed unpaired samples t-test.
Extended Data Figure 9. Design and validation of BDNF-SEP.
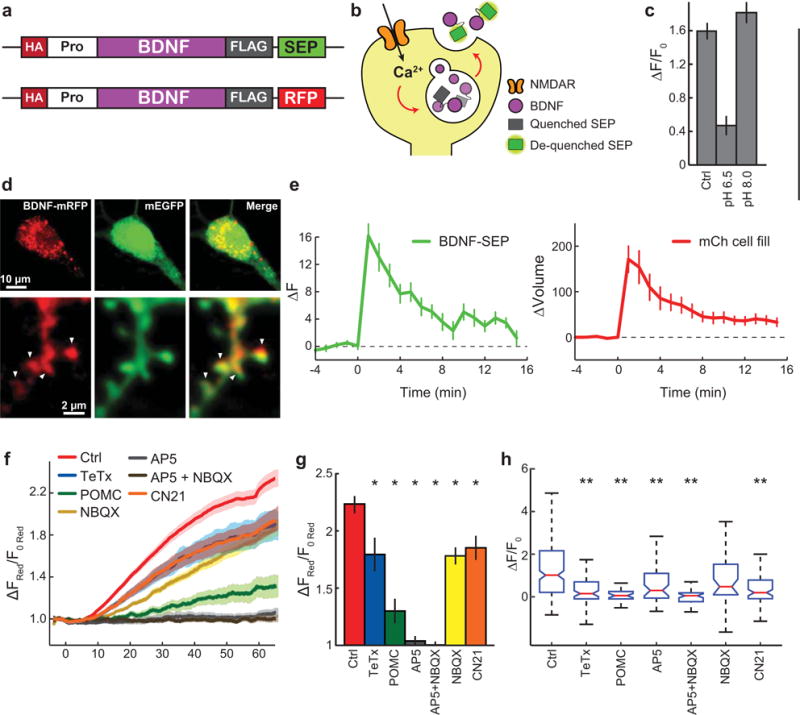
a, Schematic of BDNF-SEP and BDNF-RFP. HA, hemagglutinin tag; Pro, amino acids 19–128 of human BDNF; BDNF, amino acids 129 – 247 of human BDNF corresponding to the mature chain; FLAG, FLAG tag; SEP, supereclipitic pHluorin; RFP, red fluorescent protein.
b, Mechanistic model linking changes in SEP fluorescence with BDNF release. c, Change in BDNF-SEP fluorescence following glutamate uncaging under control (Ctrl), acidic (pH 6.5), and basic (pH 8.0) conditions.
d, Confocal images of a CA1 pyramidal neuron transfected with mEGFP and BDNF- mRFP. Arrowheads indicate dendritic spines.
e, Prolonged time course of BDNF-SEP fluorescence change (left) and spine volume change (right) in response to glutamate uncaging. n = 11/20 (cells/spines).
f–g, Time course (f) and quantification (g) of spine volume change for experiments in Fig. 4c, d. Ctrl – control conditions; TeTx – neurons transfected with tetanus toxin, an inhibitor of exocytosis; POMC – neurons transfected with the POMC peptide, an inhibitor of activity- dependent BDNF release; AP5 – NMDAR inhibitor; AP5+NBQX – NMDAR and AMPAR inhibitors; and CN21 – CaMKII inhibitor. n = 31/218 Ctrl, 6/82 TeTx, 2/29 POMC, 3/50 AP5, 2/46 AP5+NBQX, 4/40 NBQX, and 7/88 CN21 (cells/spines).
h, Data from Fig. 4d presented as medians +/− interquartile range.
Data are mean +/− s.e.m. unless otherwise indicated. *p < 0.05) as determined by an ANOVA followed by Dunnet’s method to correct for multiple comparisons. **p < 0.05 as determined by a Kruskal-Wallis test followed by Dunn’s test.
Extended Data Figure 10. CA1-LTP requires exogenous BDNF.
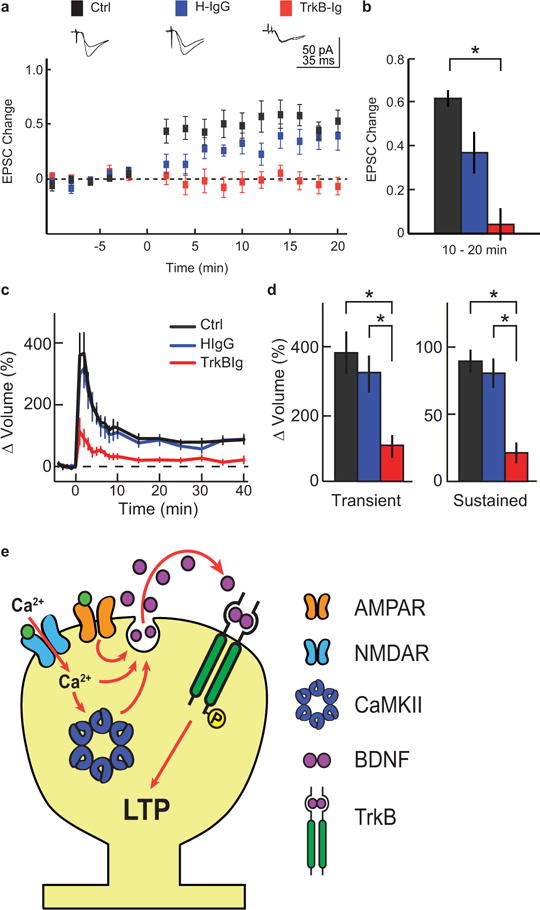
a, Time course of average EPSC amplitude changes recorded in CA1 pyramidal cells evoked by Schaffer collateral stimulation before and after LTP induction in the absence (Ctrl) or presence of human-IgG (H-IgG) or TrkB-Ig. Representative traces are above the graphs. n = 22 Ctrl, 9 H-IgG, and 12 TrkB-Ig (animals).
b, Quantification of EPSC amplitude changes averaged over 10–20 min following LTP induction.
c–d, Time course (c) and quantification (d) of the transient and sustained glutamate-uncaging-induced spine volume change in rat hippocampal slices in the absence (Ctrl) or presence of human-IgG (H-IgG) or TrkB-Ig. n = 8/8 Ctrl, 6/8 TrkBIg, and 4/6 HIgG (cells/spines).
e, Model of spine autonomous, autocrine, BDNF release and post-synaptic TrkB activation.
Data are mean +/− s.e.m. *p < 0.05 as determined by an ANOVA followed by Tukey’s method to correct for multiple comparisons.
Acknowledgments
We thank A. West and Y. Huang for critical discussion. This work was supported by grants from the National Institute of Health (F31NS078847 (SH), R01NS068410 (RY), DP1NS096787(RY), R01NS05621 (JOM), R01MH080047 (RY), R01DA08259 (TAM), R01HL098351 (TAM), P01HL096571 (TAM), and RO1NS030687 (BLH)), the Wakeman Fellowship (SH), and Human Frontier Science Program (TL).
Footnotes
Supplementary Information: is linked to the online version of the paper at www.nature.com/nature.
Author Contributions S.C.H, N.G.H, R.Y., and J.O.M. designed experiments; S.C.H and N.G.H. collected and analysed imaging data with assistance from C.E.H; P.P.-B and E.P. collected and analysed patch clamp data; T.A.M. collected electron microscopic images and analysed them with B.L.H.; T.L. performed in utero viral injections; S.C.H, N.G.H, R.Y, and J.O.M. analysed remaining data and wrote the paper. All authors discussed results and comments on this manuscript.
The authors declare no competing financial interests.
References
- 1.Lohof AM, Ip NY, Poo MM. Potentiation of developing neuromuscular synapses by the neurotrophins NT-3 and BDNF. Nature. 1993;363:350–353. doi: 10.1038/363350a0. [DOI] [PubMed] [Google Scholar]
- 2.Kang H, Welcher AA, Shelton D, Schuman EM. Neurotrophins and time: different roles for TrkB signaling in hippocampal long-term potentiation. Neuron. 1997;19:653–664. doi: 10.1016/s0896-6273(00)80378-5. [DOI] [PubMed] [Google Scholar]
- 3.Minichiello L, et al. Essential role for TrkB receptors in hippocampus-mediated learning. Neuron. 1999;24:401–414. doi: 10.1016/s0896-6273(00)80853-3. [DOI] [PubMed] [Google Scholar]
- 4.Figurov A, Pozzo-Miller LD, Olafsson P, Wang T, Lu B. Regulation of synaptic responses to high-frequency stimulation and LTP by neurotrophins in the hippocampus. Nature. 1996;381:706–709. doi: 10.1038/381706a0. [DOI] [PubMed] [Google Scholar]
- 5.Korte M, et al. Hippocampal long-term potentiation is impaired in mice lacking brain-derived neurotrophic factor. Proc Natl Acad Sci USA. 1995;92:8856–8860. doi: 10.1073/pnas.92.19.8856. [DOI] [PMC free article] [PubMed] [Google Scholar]
- 6.Kovalchuk Y, Hanse E, Kafitz KW, Konnerth A. Postsynaptic induction of BDNF-mediated long-term potentiation. Science. 2002;295:1729–1734. doi: 10.1126/science.1067766. [DOI] [PubMed] [Google Scholar]
- 7.Tanaka J, et al. Protein synthesis and neurotrophin-dependent structural plasticity of single dendritic spines. Science. 2008;319:1683–1687. doi: 10.1126/science.1152864. [DOI] [PMC free article] [PubMed] [Google Scholar]
- 8.Lai KOO, et al. TrkB phosphorylation by Cdk5 is required for activity-dependent structural plasticity and spatial memory. Nat Neurosci. 2012;15:1506–1515. doi: 10.1038/nn.3237. [DOI] [PMC free article] [PubMed] [Google Scholar]
- 9.Matsuzaki M, Honkura N, Ellis-Davies GC, Kasai H. Structural basis of long-term potentiation in single dendritic spines. Nature. 2004;429:761–766. doi: 10.1038/nature02617. [DOI] [PMC free article] [PubMed] [Google Scholar]
- 10.Okamoto K, Nagai T, Miyawaki A, Hayashi Y. Rapid and persistent modulation of actin dynamics regulates postsynaptic reorganization underlying bidirectional plasticity. Nat Neurosci. 2004;7:1104–1112. doi: 10.1038/nn1311. [DOI] [PubMed] [Google Scholar]
- 11.Kim IH, et al. Disruption of Arp2/3 results in asymmetric structural plasticity of dendritic spines and progressive synaptic and behavioral abnormalities. J Neurosci. 2013;33:6081–6092. doi: 10.1523/JNEUROSCI.0035-13.2013. [DOI] [PMC free article] [PubMed] [Google Scholar]
- 12.Kim IH, Wang H, Soderling SH, Yasuda R. Loss of Cdc42 leads to defects in synaptic plasticity and remote memory recall. eLife. 2014;3:e02839. doi: 10.7554/eLife.02839. [DOI] [PMC free article] [PubMed] [Google Scholar]
- 13.Yasuda R. Imaging spatiotemporal dynamics of neuronal signaling using fluorescence resonance energy transfer and fluorescence lifetime imaging microscopy. Curr Opin Neurobiol. 2006;16:551–561. doi: 10.1016/j.conb.2006.08.012. [DOI] [PubMed] [Google Scholar]
- 14.Harvey CD, Yasuda R, Zhong H, Svoboda K. The spread of Ras activity triggered by activation of a single dendritic spine. Science. 2008;321:136–140. doi: 10.1126/science.1159675. [DOI] [PMC free article] [PubMed] [Google Scholar]
- 15.Lee SJRJ, Escobedo-Lozoya Y, Szatmari EM, Yasuda R. Activation of CaMKII in single dendritic spines during long-term potentiation. Nature. 2009;458:299–304. doi: 10.1038/nature07842. [DOI] [PMC free article] [PubMed] [Google Scholar]
- 16.Murakoshi H, Wang H, Yasuda R. Local, persistent activation of Rho GTPases during plasticity of single dendritic spines. Nature. 2011;472:100–104. doi: 10.1038/nature09823. [DOI] [PMC free article] [PubMed] [Google Scholar]
- 17.Miesenböck G, De Angelis DA, Rothman JE. Visualizing secretion and synaptic transmission with pH-sensitive green fluorescent proteins. Nature. 1998;394:192–195. doi: 10.1038/28190. [DOI] [PubMed] [Google Scholar]
- 18.Matsuda N, et al. Differential activity-dependent secretion of brain-derived neurotrophic factor from axon and dendrite. J Neurosci. 2009;29:14185–14198. doi: 10.1523/JNEUROSCI.1863-09.2009. [DOI] [PMC free article] [PubMed] [Google Scholar]
- 19.Dean C, et al. Synaptotagmin-IV modulates synaptic function and long-term potentiation by regulating BDNF release. Nat Neurosci. 2009;12:767–776. doi: 10.1038/nn.2315. [DOI] [PMC free article] [PubMed] [Google Scholar]
- 20.Hedrick NG, et al. Rho GTPase complementation underlies BDNF-dependent homo- and heterosynaptic plasticity. Nature. 2016;538:104–108. doi: 10.1038/nature19784. [DOI] [PMC free article] [PubMed] [Google Scholar]
- 21.Middlemas DS, Meisenhelder J, Hunter T. Identification of TrkB autophosphorylation sites and evidence that phospholipase C-γ1 is a substrate of the TrkB receptor. J Biol Chem. 1994;269:5458–5466. [PubMed] [Google Scholar]
- 22.Vest RS, Davies KD, O’Leary H, Port JD, Bayer KU. Dual mechanism of a natural CaMKII inhibitor. Mol Biol Cell. 2007;18:5024–5033. doi: 10.1091/mbc.E07-02-0185. [DOI] [PMC free article] [PubMed] [Google Scholar]
- 23.Lu W, et al. Subunit composition of synaptic AMPA receptors revealed by a single-cell genetic approach. Neuron. 2009;62:254–268. doi: 10.1016/j.neuron.2009.02.027. [DOI] [PMC free article] [PubMed] [Google Scholar]
- 24.Huang YZ, Pan E, Xiong ZQQ, McNamara JO. Zinc-mediated transactivation of TrkB potentiates the hippocampal mossy fiber-CA3 pyramid synapse. Neuron. 2008;57:546–558. doi: 10.1016/j.neuron.2007.11.026. [DOI] [PubMed] [Google Scholar]
- 25.Dieni S, et al. BDNF and its pro-peptide are stored in presynaptic dense core vesicles in brain neurons. J Cell Biol. 2012;196:775–788. doi: 10.1083/jcb.201201038. [DOI] [PMC free article] [PubMed] [Google Scholar]
- 26.Yang J, et al. Neuronal release of proBDNF. Nat Neurosci. 2009;12:113–115. doi: 10.1038/nn.2244. [DOI] [PMC free article] [PubMed] [Google Scholar]
- 27.Lou H, et al. Sorting and activity-dependent secretion of BDNF require interaction of a specific motif with the sorting receptor carboxypeptidase E. Neuron. 2005;45:245–255. doi: 10.1016/j.neuron.2004.12.037. [DOI] [PubMed] [Google Scholar]
- 28.Chen X, et al. A chemical-genetic approach to studying neurotrophin signaling. Neuron. 2005;46:13–21. doi: 10.1016/j.neuron.2005.03.009. [DOI] [PubMed] [Google Scholar]
- 29.He XP, et al. Conditional deletion of TrkB but not BDNF prevents epileptogenesis in the kindling model. Neuron. 2004;43:31–42. doi: 10.1016/j.neuron.2004.06.019. [DOI] [PubMed] [Google Scholar]
- 30.Luikart BW, et al. TrkB has a cell-autonomous role in the establishment of hippocampal Schaffer collateral synapses. J Neurosci. 2005;25:3774–3786. doi: 10.1523/JNEUROSCI.0041-05.2005. [DOI] [PMC free article] [PubMed] [Google Scholar]
- 31.Huang YZ, McNamara JO. Mutual regulation of Src family kinases and the neurotrophin receptor TrkB. J Biol Chem. 2010;285:8207–8217. doi: 10.1074/jbc.M109.091041. [DOI] [PMC free article] [PubMed] [Google Scholar]
- 32.Zacharias DA, Violin JD, Newton AC, Tsien RY. Partitioning of lipid-modified monomeric GFPs into membrane microdomains of live cells. Science. 2002;296:913–916. doi: 10.1126/science.1068539. [DOI] [PubMed] [Google Scholar]
- 33.Patterson MA, Szatmari EM, Yasuda R. AMPA receptors are exocytosed in stimulated spines and adjacent dendrites in a Ras-ERK-dependent manner during long-term potentiation. Proc Natl Acad Sci USA. 2010;107:15951–15956. doi: 10.1073/pnas.0913875107. [DOI] [PMC free article] [PubMed] [Google Scholar]
- 34.He XPP, et al. Conditional deletion of TrkB but not BDNF prevents epileptogenesis in the kindling model. Neuron. 2004;43:31–42. doi: 10.1016/j.neuron.2004.06.019. [DOI] [PubMed] [Google Scholar]
- 35.Xiong ZQ, McNamara JO. Fleeting activation of ionotropic glutamate receptors sensitizes cortical neurons to complement attack. Neuron. 2002;36:363–374. doi: 10.1016/s0896-6273(02)00977-7. [DOI] [PubMed] [Google Scholar]
- 36.Stoppini L, Buchs PA, Muller D. A simple method for organotypic cultures of nervous tissue. J Neurosci Methods. 1991;37:173–182. doi: 10.1016/0165-0270(91)90128-m. [DOI] [PubMed] [Google Scholar]
- 37.Murakoshi H, Lee SJJ, Yasuda R. Highly sensitive and quantitative FRET-FLIM imaging in single dendritic spines using improved non-radiative YFP. Brain Cell Biol. 2008;36:31–42. doi: 10.1007/s11068-008-9024-9. [DOI] [PMC free article] [PubMed] [Google Scholar]
- 38.Pologruto TA, Sabatini BL, Svoboda K. ScanImage: flexible software for operating laser scanning microscopes. Biomed Eng Online. 2003;2:13. doi: 10.1186/1475-925X-2-13. [DOI] [PMC free article] [PubMed] [Google Scholar]
- 39.Pan E, et al. Vesicular zinc promotes presynaptic and inhibits postsynaptic long-term potentiation of mossy fiber-CA3 synapse. Neuron. 2011;71:1116–1126. doi: 10.1016/j.neuron.2011.07.019. [DOI] [PMC free article] [PubMed] [Google Scholar]
- 40.Milner TA, Waters EM, Robinson DC, Pierce JP. In: Neurodegeneration, Methods and Procedures. Manfredi G, Kawamata H, editors. Spring. 2011. pp. 23–59. [Google Scholar]
- 41.Peters A, Palay SL, Webster HD. The Fine Structure of the Nervous System. 3rd. Oxford Univ. Press; 1991. [Google Scholar]
Associated Data
This section collects any data citations, data availability statements, or supplementary materials included in this article.


