
Figure 5. Functional and structural LTP depends on post-synaptic BDNF-TrkB signalling.
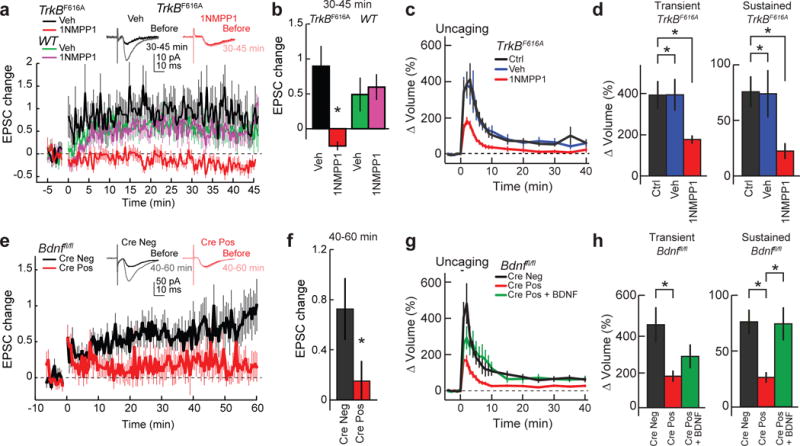
a, b, Time course (a) and quantification (b; 30–45 min) of excitatory postsynaptic current (EPSC) change recorded in CA1 pyramidal cells of hippocampal slices from TrkbF616A and wild-type mice, before and after LTP induction in the presence of vehicle or 1NMPP1. Representative traces of TrkbF616A slices with vehicle or 1NMPP1 are shown above the graphs. n = 11 TrkbF616A vehicle, 10 TrkbF616A 1NMPP1, 11 wild-type vehicle, and 13 wild-type 1NMPP1 (cells). c, d, Time course (c) and quantification (d) of transient and sustained glutamate-uncaging-induced spine volume change for TrkbF616A hippocampal slices in the absence or presence of vehicle or 1NMPP1. n = 20/20 control, 10/13 vehicle, and 16/20 1NMPP1 (cells/spines). e–h, Similar experiments to a and b but from Bdnffl/fl mice infected with or without Cre. Representative traces are shown above the graphs. n = 20 Cre− and 19 Cre+ (cells). g, h, Time course (g) and quantification (h) of transient and sustained glutamate-uncaging-induced spine volume change for Bdnffl/fl hippocampal slices transfected with eGFP or eGFP plus Cre. For Cre+ plus BDNF, Cre-positive cells were treated with BDNF for 10 min before glutamate uncaging. n = 13/14 Cre−, 22/32 Cre+, and 6/7 Cre+ plus BDNF (cells/spines). Data are mean ± s.e.m. *P < 0.05, two-tailed t-test (b, f) or ANOVA with Tukey’s test (d, h).